Project 1 - Parsing NASA thermodynamic data
Aim : Reading & analyzing NASA thermodynamic data file with the help of file parsing by matlab.
Objectives :
1) Understanding the commands to read the data file.
2) Find the logic behind the data.
3) Ploting the graph from input data file.
Body Of the content :
Parsing : Resolve a sentence into it's component parts & describe their synthetic role. Analyse (a string or text) into logical syntactic components.
We are using THERMO.dat file for getting data of NASA thermodynamic by using some set logics & formulas we get the data of specific heat, Enthalpy, Entropy & plot the parameters with respect to temprature.
The formulas of parameters are as follows

where
Cp = specific heat
H = enthalpy
T = temprature
R = universial gas constant
Commands used for matlab program:
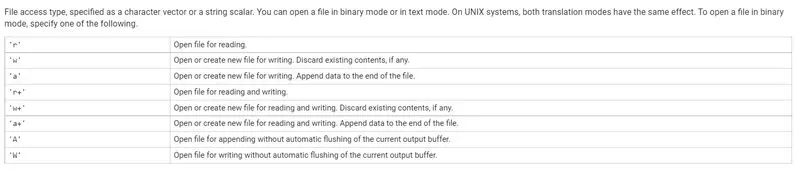
1) fopen is used to open the file 'THERMO.dat' . Where is different permission are as below
2) fgetl returns the next line of the specified file, removing new line characters.
3) findstr searches the longer of the two input arguments for any occurrences of the shorter argument and returns the starting index of each occurrence. If it finds no occurrences, then findstr returns the empty array, [] .
4) str2num converts a character array or string scalar to a numeric matrix. The input can include spaces, commas, and semicolons to indicate separate elements. ... The str2num function does not convert cell arrays or nonscalar string arrays, and is sensitive to spacing around + and - operators.
5) strsplit splits str at the delimiters specified by delimiter . If str has consecutive delimiters, with no other characters between them, then strsplit treats them as one delimiter.
6) mkdir folderName creates the folder folderName . If folderName exists, MATLAB® issues a warning. ... status = mkdir(___) creates the specified folder and returns a status of 1 if the operation is successful or if the folder exists. Otherwise, mkdir returns 0 and does not throw a warning or error to the Command Window.
7) cd displays the current folder.
Matlab program :
% Parsing NASA thermodynamic data

clear all
close all
clc
f1 = fopen('THERMO.dat','r');
tline1 = fgetl(f1);
tline2 = fgetl(f1);
T = findstr(tline2,' ');
global_low_temp = str2num(tline2(T(1)+3:11));
global_mid_temp = str2num(tline2(T(1)+12:21));
global_high_temp = str2num(tline2(T(1)+22:end));

% for skipping first 3 header lines
for j = 1:3;
    fgetl(f1);
end

% Finding specific heat, enthalpy, entropy
for n = 1:53
    tline3 = fgetl(f1);
    S = strsplit(tline3,' ');
    spacies_name = char(S(1));
    %M = findstr(tline3,'G');
    L = strsplit(tline3(45:end),' ');
    Local_low_temp(n) = str2num(L{2});
    Local_mid_temp(n) = str2num(L{3});
    Local_high_temp(n) = str2num(L{4});

    % Calling next line of values to find coefficents
    tline4 = fgetl(f1);
    a = findstr(tline4,'E');
    a1 = str2num(tline4(1:a(1)+3));
    a2 = str2num(tline4(a(1)+4:a(2)+3));
    a3 = str2num(tline4(a(2)+4:a(3)+3));
    a4 = str2num(tline4(a(3)+4:a(4)+3));
    a5 = str2num(tline4(a(4)+4:a(5)+3));

    tline5 = fgetl(f1);
    a6 = str2num(tline5(1:a(1)+3));
    a7 = str2num(tline5(a(1)+4:a(2)+3));
    a8 = str2num(tline5(a(2)+4:a(3)+3));
    a9 = str2num(tline5(a(3)+4:a(4)+3));
    a10 = str2num(tline5(a(4)+4:a(5)+3));

    tline6 = fgetl(f1);
    a11 = str2num(tline6(1:a(1)+3));
    a12 = str2num(tline6(a(1)+4:a(2)+3));
    a13 = str2num(tline6(a(2)+4:a(3)+3));
    a14 = str2num(tline6(a(3)+4:a(4)+3));

    t1 = Local_low_temp(n);
    t2 = Local_high_temp(n);
    t = linspace(t1,t2,100);
    R = 8.173;

    for i = length(t)
        if (t > Local_mid_temp(n))
            cp = (a1+a2*t+a3*(t^2)+a4*(t^3)+a5*(t^4))*R;
            H = (a1+(a2*t)/2+(a3*t^2)/3+(a4*t^3)/4+(a5*t^4)/5+(a6/t))*R*t;
            S = (a1.*log(t)+a2.t+(a3.(t^2))/2+(a4.(t^3))/3+(a5.*(t^4))/4+a7).*R;
        else
            cp = (a8+a9.*t+a10.*(t.^2)+a11.*(t.^3)+a12.*(t.^4)).*R;
            H = (a8+(a9.*t)./2+(a10.*t.^2)./3+(a11.*t.^3)./4+(a12.*t.^4)./5+(a13./t)).*R.*t;
            S = (a8.*log(t)+a9.*t+(a10.*(t.^2))/2+(a11.*(t.^3))/3+(a12.*(t.^4))/4+a14).*R;
        end
    end
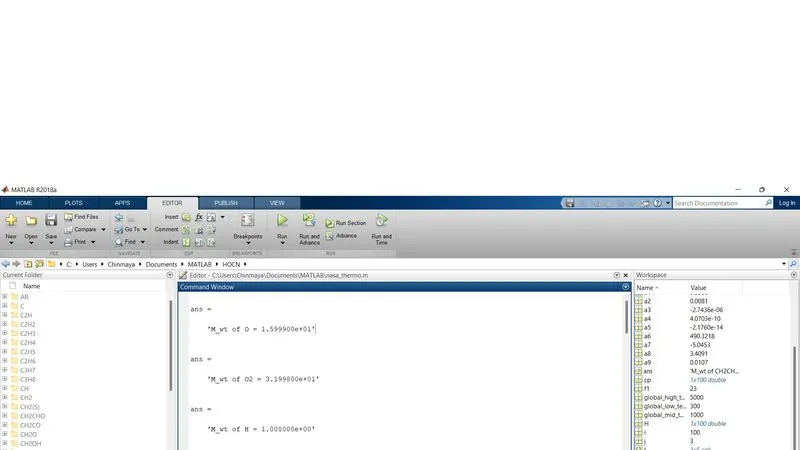
    M_wt = molecular_weight(spacies_name);
    sprintf('M_wt of %s = %d',spacies_name,M_wt)
    p = sprintf('%s',spacies_name);
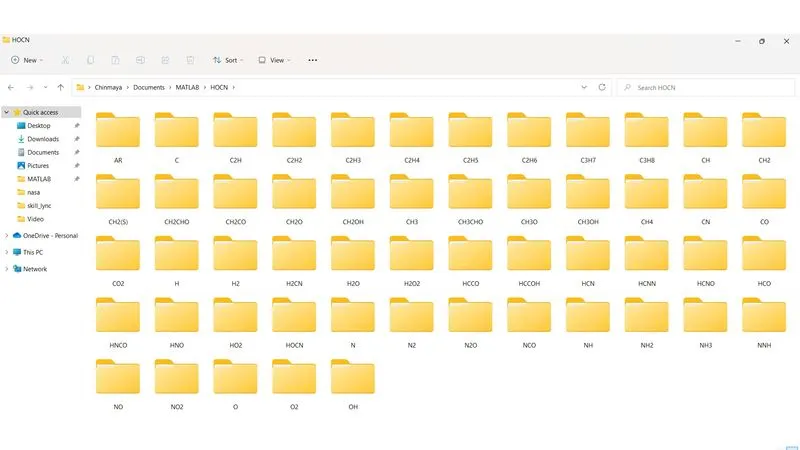
    mkdir(p);
    cd(p)

    % Plot for temperature vs specific heat
    figure(1);
    plot(t,cp,'linewidth',3,'color','b');
    xlabel('tempearture');
    ylabel('specific heat');
    grid on;
    title('Temprature vs Specific Heat');
    saveas(1,'specific_heat.jpg');

    % Plot for temperature vs enthalpy
    figure(2);
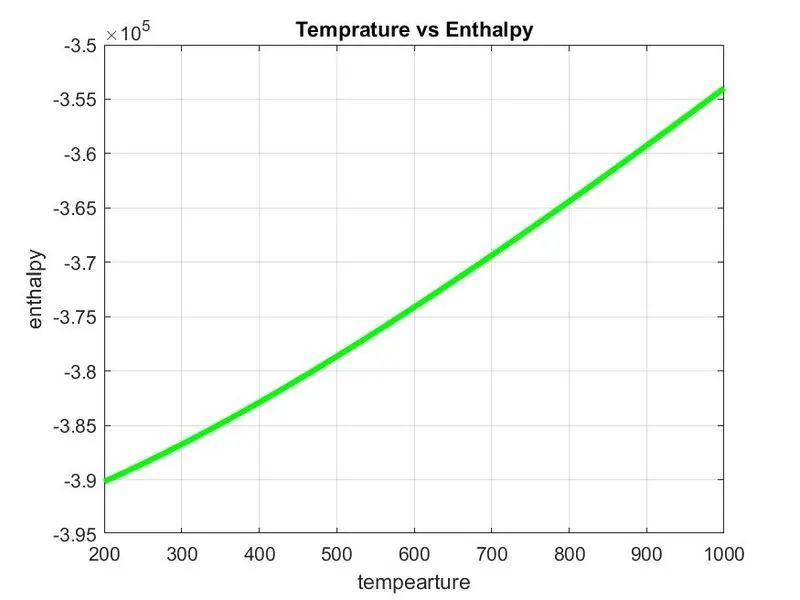
    plot(t,H,'linewidth',3,'color','g');
    xlabel('tempearture');
    ylabel('enthalpy');
    grid on;
    title('Temprature vs Enthalpy');
    saveas(2,'enthalpy.jpg');

    % Plot for temperature vs entropy
    figure(3);
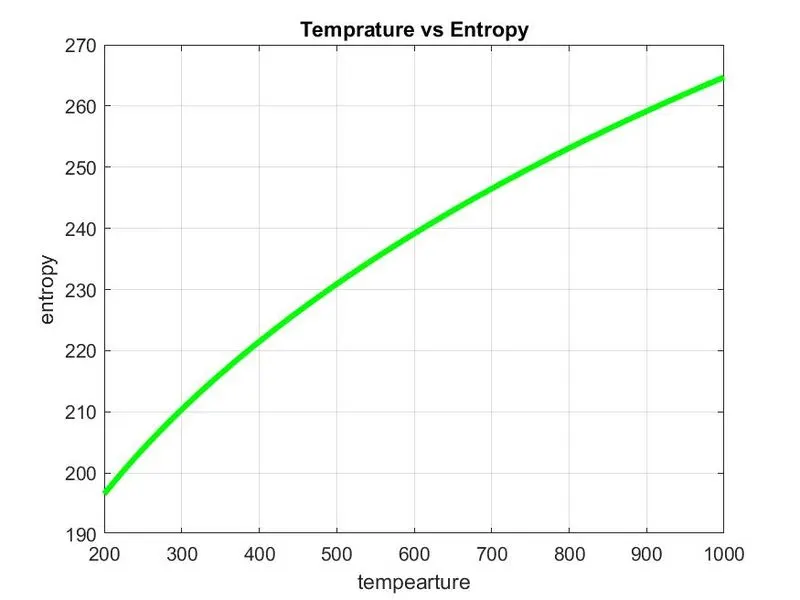
    plot(t,S,'linewidth',3,'color','g');
    xlabel('tempearture');
    ylabel('entropy');
    grid on;
    title('Temprature vs Entropy');
    saveas(3,'entropy.jpg');

    % Changing current folder
    cd ..
end
Matlab program for molecular weight:
% Function for calculating molecular weight
function [M] = molecular_weight(S_name)
elements = ['O','H','C','N','A','S'];
atomic_mass = [15.999,1.008,12.011,14.007,39.948,32.065];
M = 0;
for i = 1:length(S_name);
   for j = 1:length(elements);
    if strcmpi(S_name(i),elements(j));
        M = M+atomic_mass(j);
        K = (j);
    end
end
n = str2double(S_name(i));
if(n>0)
    M = M+(atomic_mass(K)*(n-1));
end
end
Output:
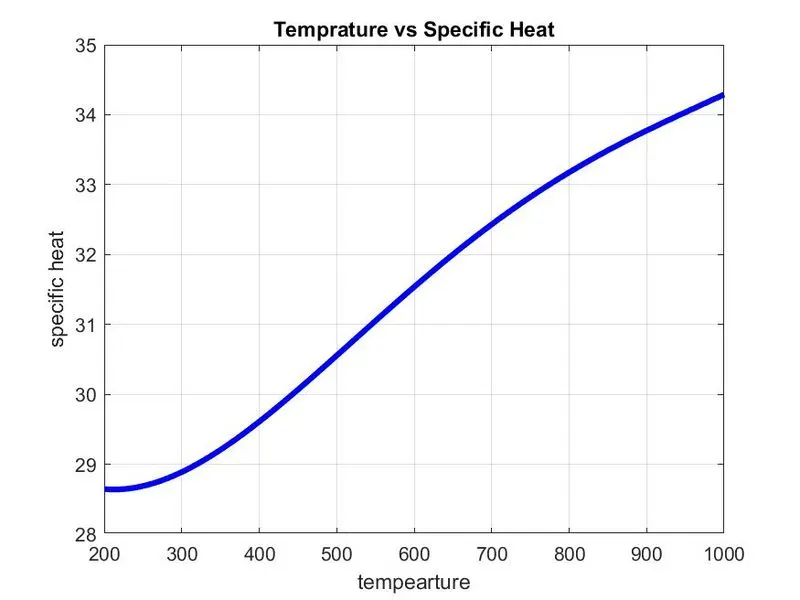
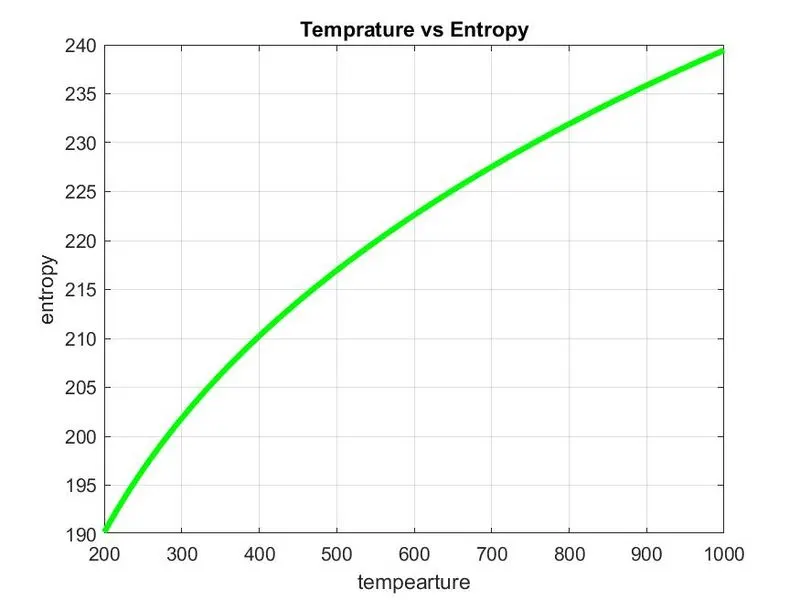
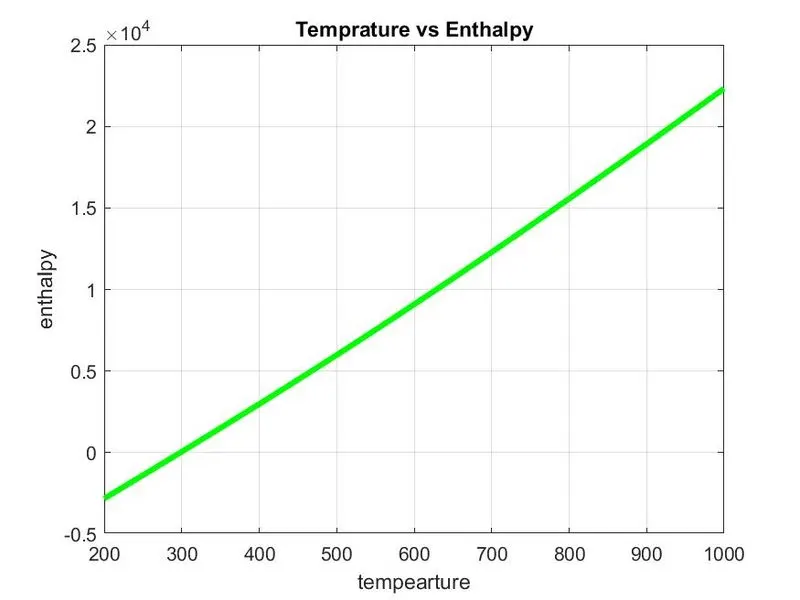
Plots for O2
Plots for N2
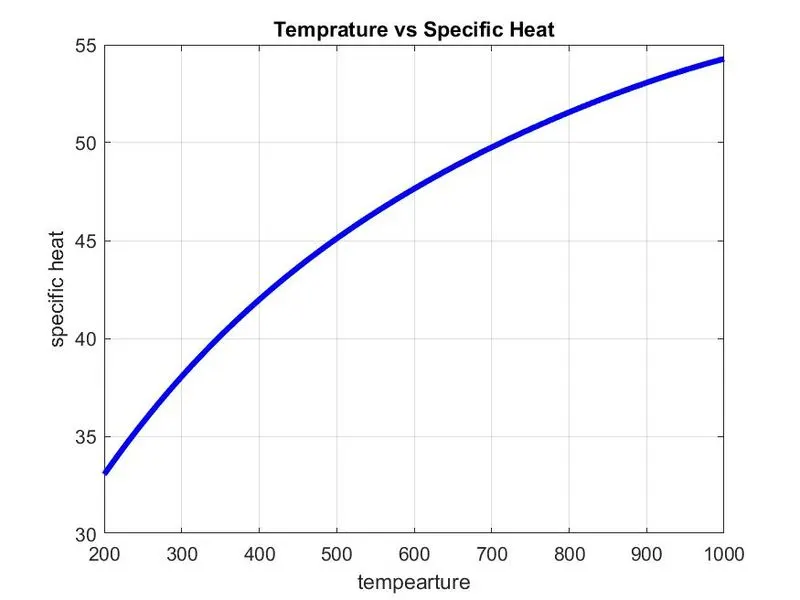
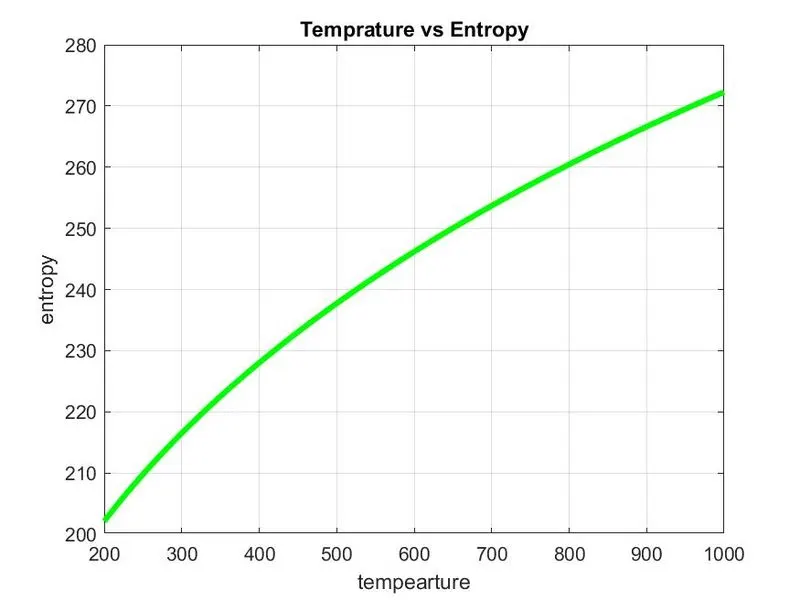
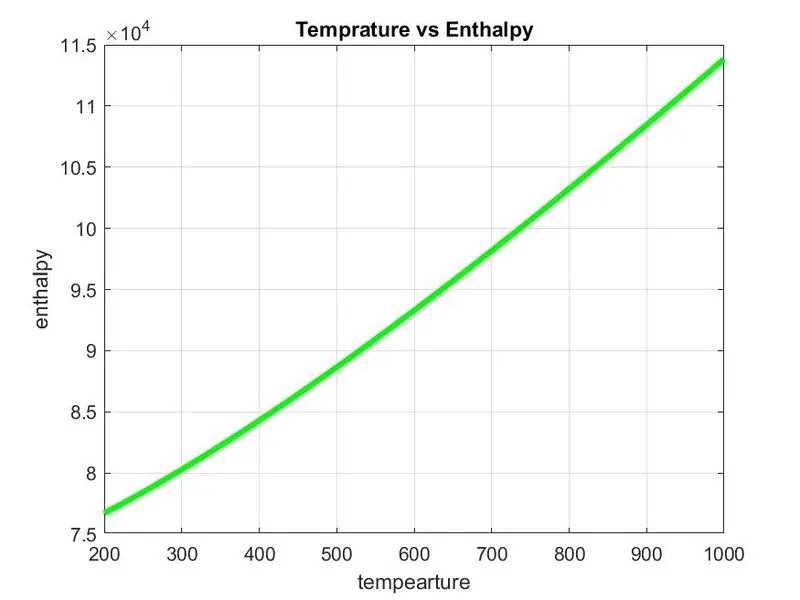
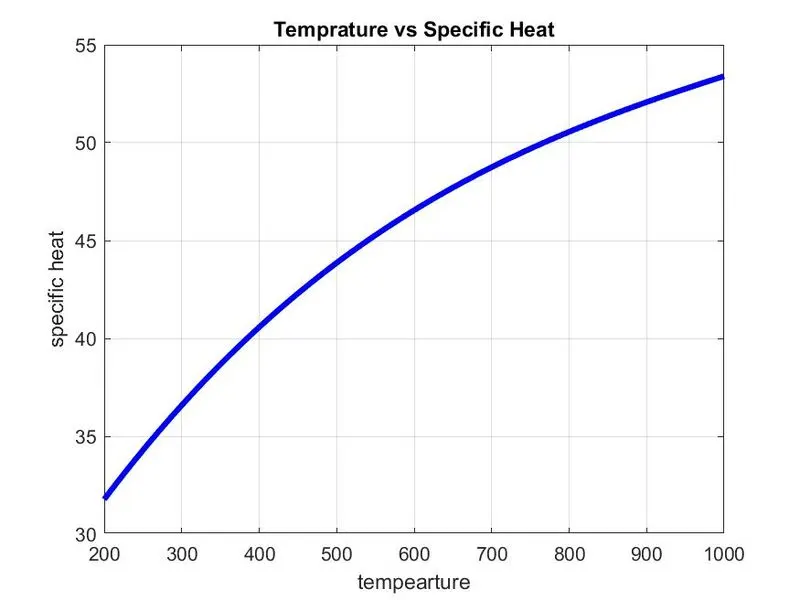
Plots for CO2:
Folder of all species :
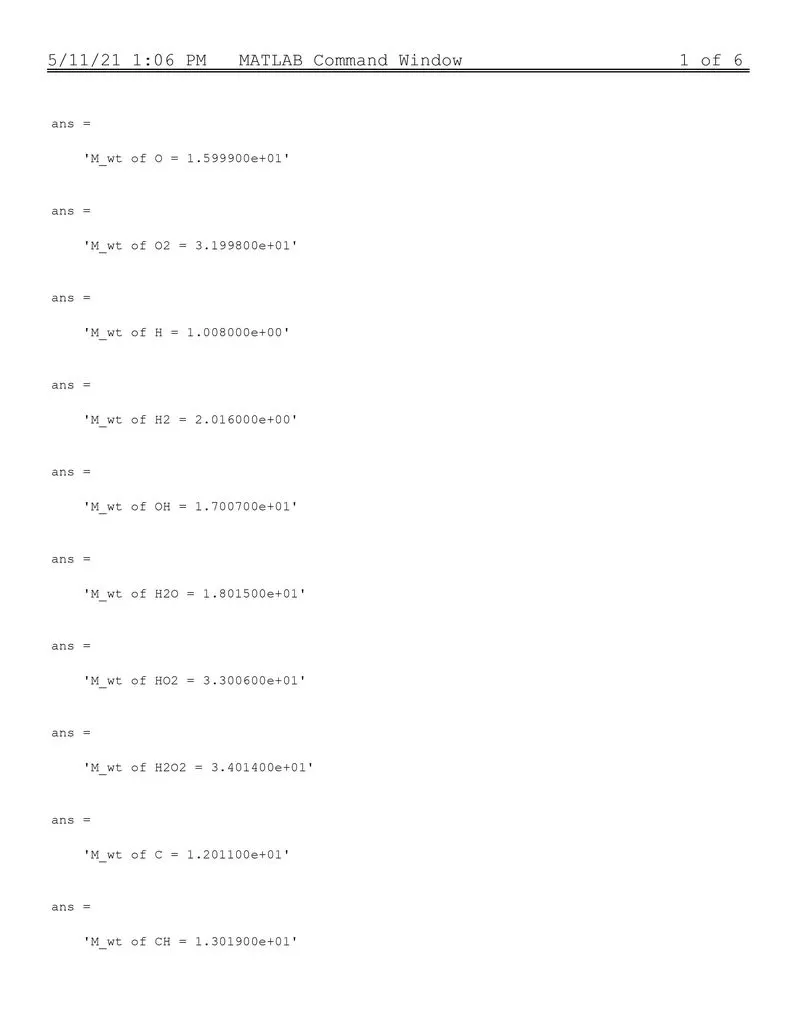
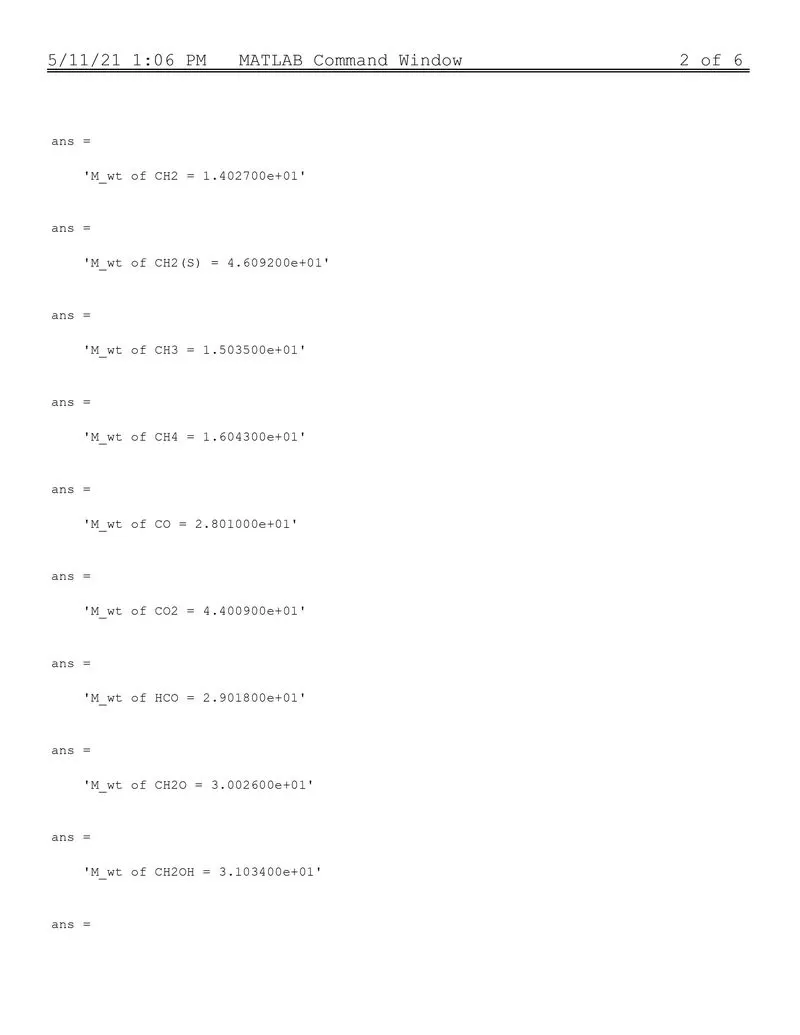
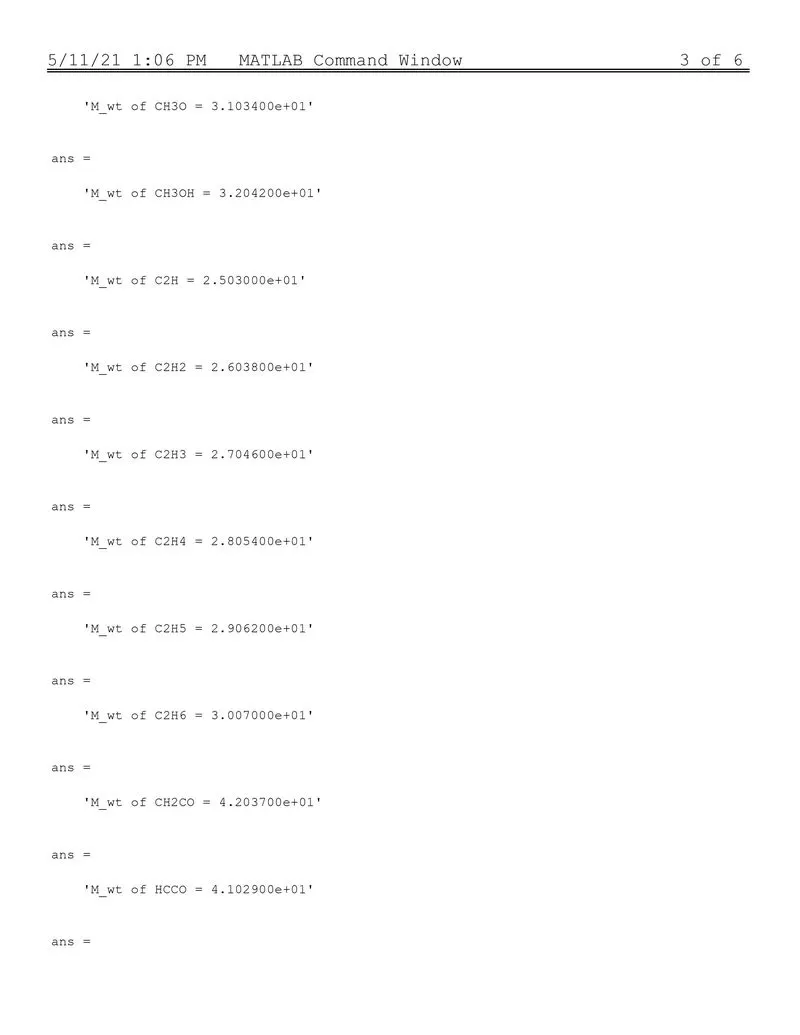
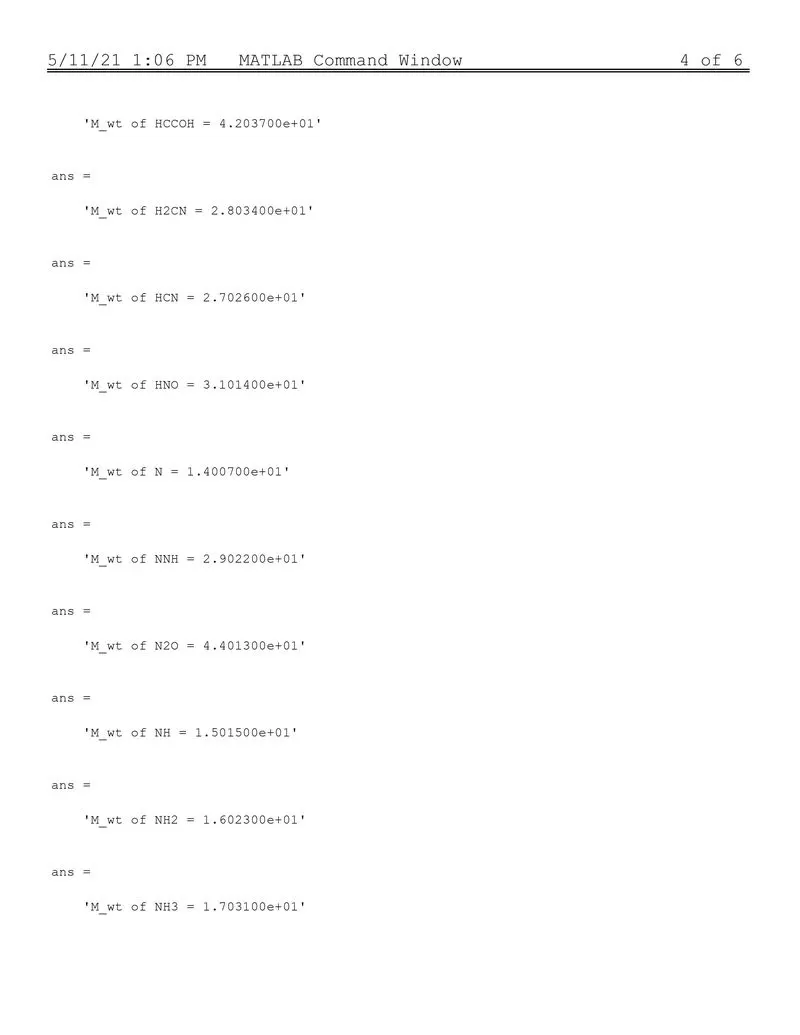
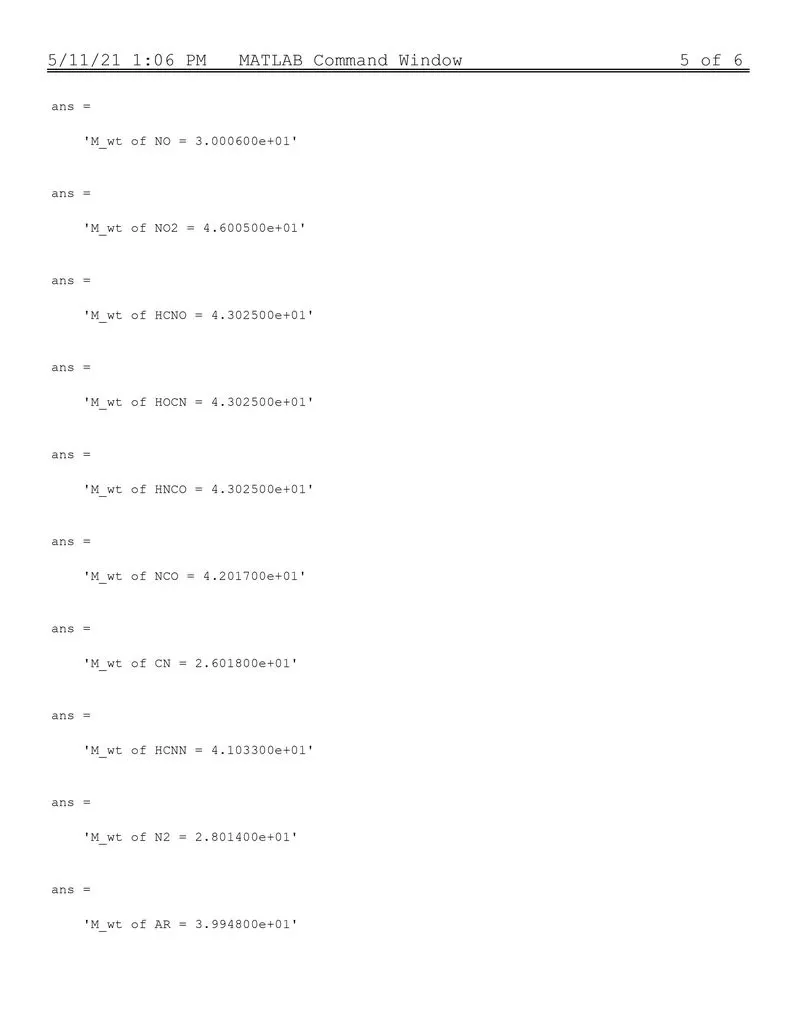
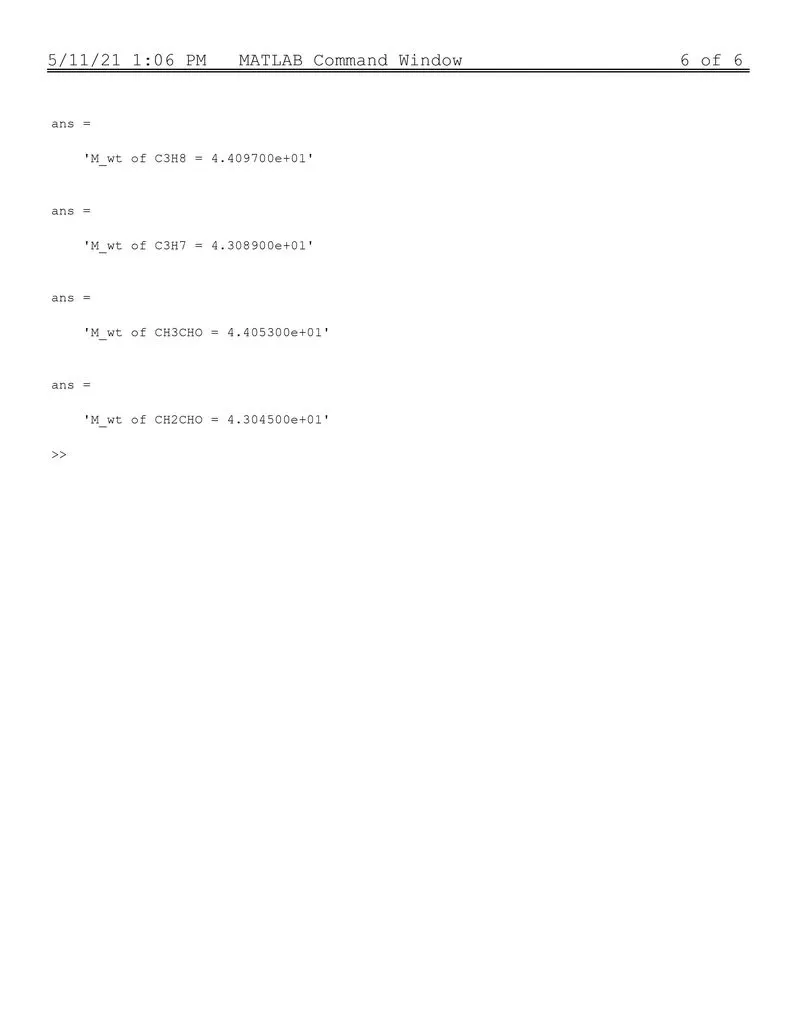
Molecular weight from command window:
Explanation of program:
1)'clear all' command is used to clear the previous data stored in the workspace.
' close all' command is used to close all previous plots.
'clc' command is used to clear the command window.
2) To open the 'THERMO.dat' data file, a fopen command is used and reading premission is provided.
3) After that to read the data of global temprature we skipped the header line with the help of fgetl command. Now the next line is global temprature and it is named tline2. Now the single string line with three temprature to separate them we have to find the position of single string array. So to do that we have to use findstr command with the gap between two temprature. Now we have string array in three different cell. We have to call and convert them to number with the help of str2num command.
4) We have to skip next three lines with the help of fgetl command in for loop for length of 3. In the program it consist 53 set of species. Here we have to calculate specific heat, enthalpy and entropy.
5) Now we have to call next line with the help of fgetl command. This line contains data of species name and low , mid,high local tempratures. Now we have to call the first line to divide the continous string with the help of 'strsplit' command and delimiter as gap between them. So we divide the string into separate strings. Now we know that our first string is species name so have used braces , which are used to content adressing of cell arrays.
6) Now we get species name.To get the temprature values for species we have to divide the continous line in two string arrays by 'strsplit' command. Now the local temprature is called with braces with addresss and converted this string to number with the hep of str2num.
7) Now to calculate the coeffecients for three lines ,fgetl command is used. After calling the first line the string consists of 5 coeffecient which has to be separated by the logic in our line as letter E, so we can use that to separate the coeffecient bt findstr command which will give us the position of letter E. From this we an separate coeffecient in string format . To convert this str2num command is used. We get all coeffecients and this is repeated for next two lines.
8) To calculate specific heat, enthalpy and entropy, we have to define temprature range between local low and local high with the help of limspace for 100 values. For loop is used to get the range of temprature. In this loop the formula of specific heat, enthalpy and entropy is used.
9) Now we have have 14 coffecients. First 7 are High-temprature coeffecients and the second 7 are Low-temprature coeffecients.Here the if command is used.
10) sprintf command is same as fprintf except that it returns the data in a matlab string variable rather than writing it to a file. mkdir command is used to create the specified folder 'p'. 'cd' command is used to display the current folder.
11) Next we represent the data in graphs and save it in folder.
figure(1) is used to get the figure.
plot command is used to plot temprature and specific heat with the line width 3 and blue colour.
xlabel for displaying temprature and ylabel for displaying specific heat is used.
grid command is used to display the gridline.
title command is used for displaying the title line.
saveas command is used to save the figure.
for temprature vs enthaply and the temprature vs entropy the same process is followed as above.
12) Now we have completed the program for one set of species . For all species we have to use for loop for length of 53 speices to get all the species data.
13)Now the function for molecular weight is written as below.
M variable is used to store the molecular weight data which is initially set as 0. elements is used to store the element. atomic_mass is used to store the value.
By using strcmp command each species elements are compared and molecular mass is stored using two for loops one to iterate the species element and one to compare the elements.
str2double converts the text in str to double precision values.
Conclusion : From this we can conclude that for the big data files file parsing is a good method to use . It is prefferable to use as it makes the data extraction form large files easily.