Project 1 - Parsing NASA thermodynamic data
Parsing NASA thermodynamic data using MATLAB
Section 1 :
PROBLEM DEFINITION
Calculate the Specific heat, enthalpy and entropy for all the species in the NASA thermodynamic data file provided
Data to be extracted :-
1) Species name
2) High temp and low temp coefficients
Using the above data :-
1) Calculate Molecular weight for all species
2) Calculate Cp, H and S using the formula given below:-
3) Plot Cp vs T, H vs T & S vs T for all the species
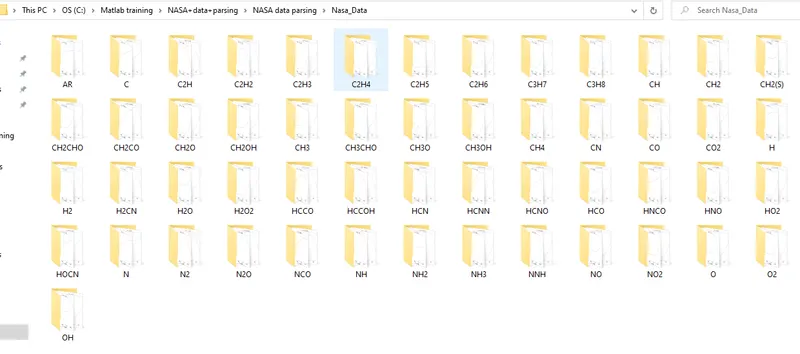
4) Save the plots in separate directory for each species
Section2:
Main code
clear all
close all
clc
f1=fopen('THERMO.dat')
% Skipping the header line
header=fgetl(f1)
% Readging Global Temperatures from the file ' THERMO.dat'
t1=fgetl(f1);
t2=strsplit(t1,' ');

% Converting the Strings in temp2 array to numbers
Globaltemp_High=str2num(t2{4})
Globaltemp_Mid=str2num(t2{3})
Globaltemp_Low=str2num(t2{2})

T=linspace(Globaltemp_Low,Globaltemp_High,500);

R=8.314 %Universal gas constant in J/mol-K

% Skipping Comment lines
for i= 1:3
    skip=fgetl(f1);
end

%Assigning string to Sp_data as Start
Sp_data=[' '];
%Assigning string to Readtill as END. Point in the file till where the to read
Readtill=['END'];


 while ~feof(f1)


    %display(i);
    %feof is a command to end of a file
    % ~ is logical NOT operator

    % Getting the Species Name
    Sp_line=fgetl(f1);
    Sp_data=strsplit(Sp_line,' ');
   if strcmp(Sp_data,Readtill)==1 % Loop for reading the data file till the specified point in the data file is reached
       break
   end

    Sp_name=Sp_data{1}
    line_1=fgetl(f1);

    %Reading next line to get the first set of 5 co-efficients
    p=strfind(line_1,'E');
        a1=line_1(1:p(1)+3);
        a1=str2num(a1);
        a2=line_1(p(1)+4:p(2)+3);
        a2=str2num(a2);
        a3=line_1(p(2)+4:p(3)+3);
        a3=str2num(a3);
        a4=line_1(p(3)+4:p(4)+3);
        a4=str2num(a4);
        a5=line_1(p(4)+4:p(5)+3);
        a5=str2num(a5);

    line_2=fgetl(f1);
    %Reading next line to get the first set of 5 co-efficients
    p=strfind(line_1,'E');
    a6=line_2(1:p(1)+3);
    a6=str2num(a6);
    a7=line_2(p(1)+4:p(2)+3);
    a7=str2num(a7);
    a8=line_2(p(2)+4:p(3)+3);
    a8=str2num(a8);
    a9=line_2(p(3)+4:p(4)+3);
    a9=str2num(a9);
    a10=line_2(p(4)+4:p(5)+3);
    a10=str2num(a10);

    line_3=fgetl(f1);
    %Reading next line to get the first set of 5 co-efficients

    a11=line_3(1:p(1)+3);
    a11=str2num(a11);
    a12=line_3(p(1)+4:p(2)+3);
    a12=str2num(a12);
    a13=line_3(p(2)+4:p(3)+3);
    a13=str2num(a13);
    a14=line_3(p(3)+4:p(4)+3);
    a14=str2num(a14);

Cp=specific_heat(R,Globaltemp_Mid,T,a1,a2,a3,a4,a5,a8,a9,a10,a11,a12);
S=entropy(R,Globaltemp_Mid,T,a1,a2,a3,a4,a5,a7,a8,a9,a10,a11,a12,a14);
H=enthalpy(R,Globaltemp_Mid,T,a1,a2,a3,a4,a5,a6,a8,a9,a10,a11,a12,a13);
mw=mol_Weight(Sp_name);


% Changing directory to create sub folders and saving the plots
cd('/MATLAB Drive/Published/NASA data parsing/Nasa_Data')
mkdir(Sp_name) % Creating folder with Species name
cd(Sp_name) % Changing to the current species folder

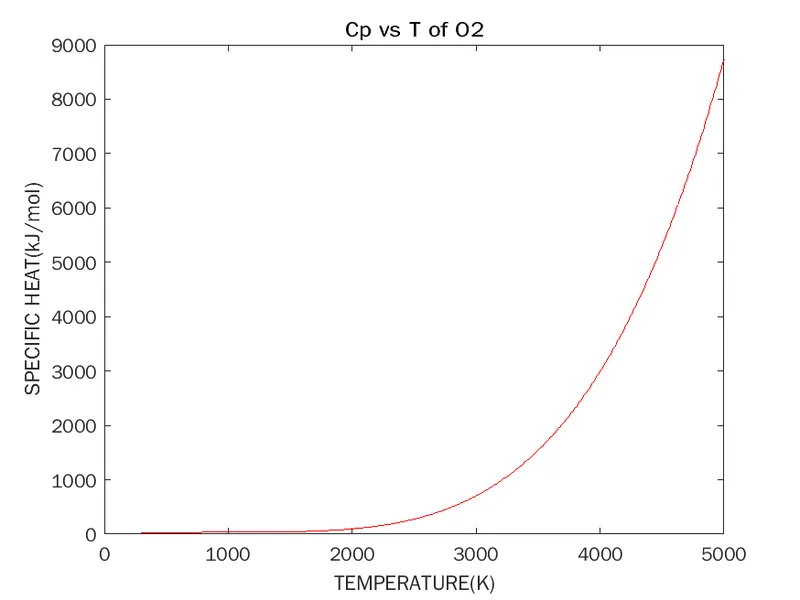
%Plotting T vs Cp

figure(1)
plot(T,Cp,'color','r')
xlabel('TEMPERATURE(K)')
ylabel('SPECIFIC HEAT(kJ/mol)')
title(sprintf('Cp vs T of %s',Sp_name))
saveas(figure(1),'SPECIFIC HEAT.png')


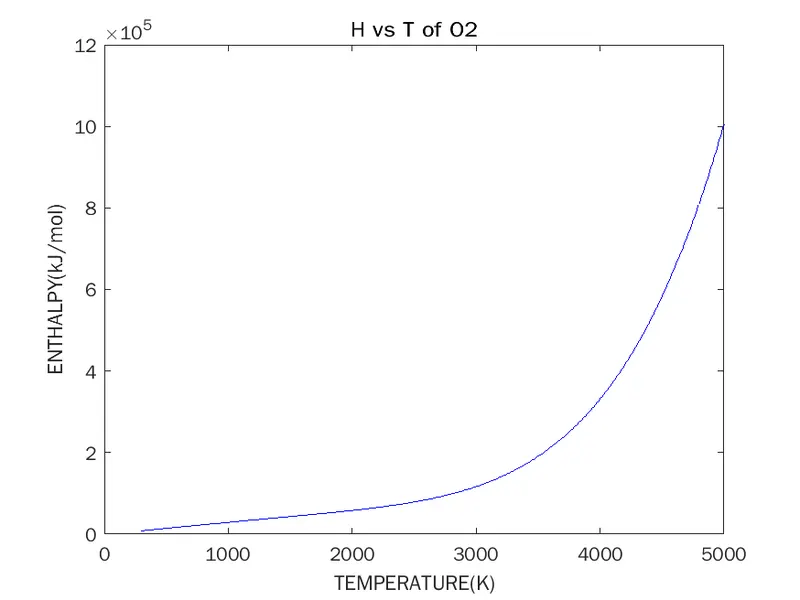
%Plotting T vs H
figure(2)
plot(T,H,'color','b')
xlabel('TEMPERATURE(K)')
ylabel('ENTHALPY(kJ/mol)')
title(sprintf('H vs T of %s',Sp_name'))
saveas(figure(2),'ENTHALPY.png')


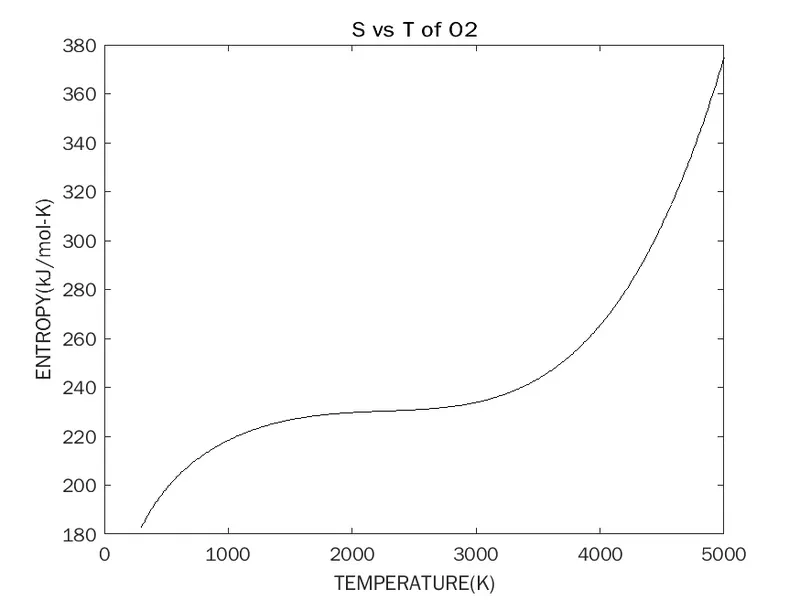
%Plotting T vs S
figure(3)
plot(T,S,'color','k')
xlabel('TEMPERATURE(K)')
ylabel('ENTROPY(kJ/mol-K)')
title(sprintf('S vs T of %s',Sp_name'))
saveas(figure(3),'ENTROPY.png')


cd('/MATLAB Drive/Published/NASA data parsing') % Changing back to the main directory

 end
Section 3:
Functions for Specific heat, Enthaply and Entropy
1) Function for calculating Specific heat
%Funtion to calculate Specific heat
function Cp= specific_heat(R,Globaltemp_Mid,T,a1,a2,a3,a4,a5,a8,a9,a10,a11,a12)

       if T>Globaltemp_Mid
          Cp=R*(a1+(a2*T)+(a3*(T.^2))+(a4*(T.^3))+(a5*(T.^4)));
       else
          Cp=R*(a8+(a9*T)+(a10*(T.^2))+(a11*(T.^3))+(a12*(T.^4)));
       end
end
2) Function for calculating Enthalpy
%Function to calculate Enthalpy
function H=enthalpy(R,Globaltemp_Mid,T,a1,a2,a3,a4,a5,a6,a8,a9,a10,a11,a12,a13)

    if T >Globaltemp_Mid
          H=R*(a1*T)+(a2*(T.^2))+((a3*(T.^3))/3)+((a4*(T.^4))/4)+((a5*(T.^5))/5)+a6;
       else
          H=R*(a8*T)+(a9*(T.^2))+((a10*(T.^3))/3)+((a11*(T.^4))/4)+((a12*(T.^5))/5)+a13;
       end
end
3) Function for calculating Entropy
%Funtion to calculate Entropy

function S= entropy(R,Globaltemp_Mid,T,a1,a2,a3,a4,a5,a7,a8,a9,a10,a11,a12,a14)

    if T >Globaltemp_Mid
          S=R*(a1.*log(T))+(a2*T)/+((a3*(T.^2))/2)+((a4*(T.^3))/3)+((a5*(T.^4))/4)+a7;
       else
          S=R*(a8.*log(T))+(a9*T)/+((a10*(T.^2))/2)+((a11*(T.^3))/3)+((a12*(T.^4))/4)+a14;
       end
end
4) Function for calculating Molecular Weight
function mw = mol_Weight(Sp_name)

    element=['H','C','N','O','Ar']; % Defining Elemnets

    atomic_mass=[1.008 12.011 14.007 15.999 39.948];% Defining Atomic mass

    mw=0;
    for i=1:length(Sp_name)
        for j=1:length(element)

            if strcmp(Sp_name(i),element(j)) % Comparing Species name and Element name
                mw=mw+atomic_mass(j);
                index=j; % Variable to store the position of the last Element read
            end
        end
        n=str2num(Sp_name(i));
        if n>1
            mw=mw+atomic_mass(index)*(n-1);
        end
    end
    formatspec='Molecular weight of %s = %3.3f \n';
    fprintf(formatspec,Sp_name,mw)
end
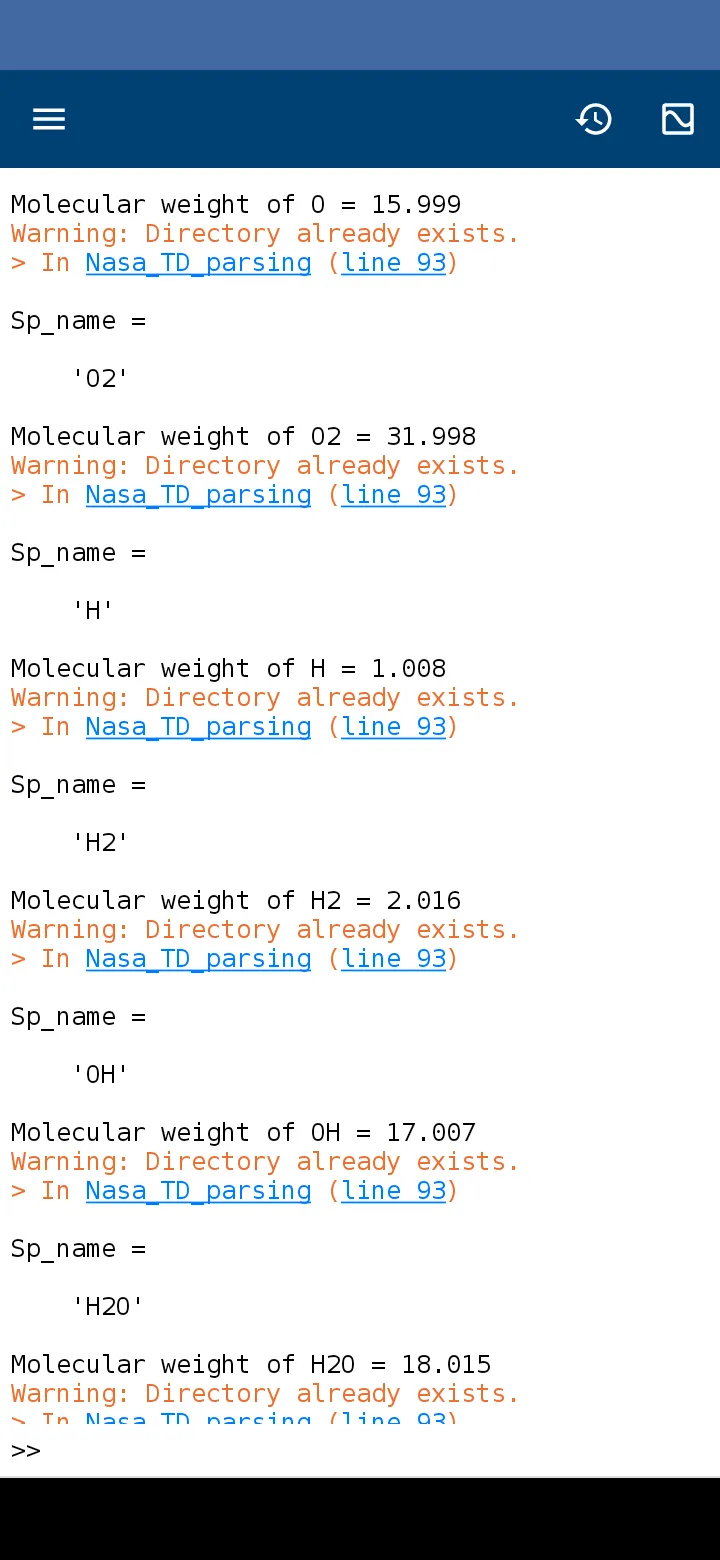
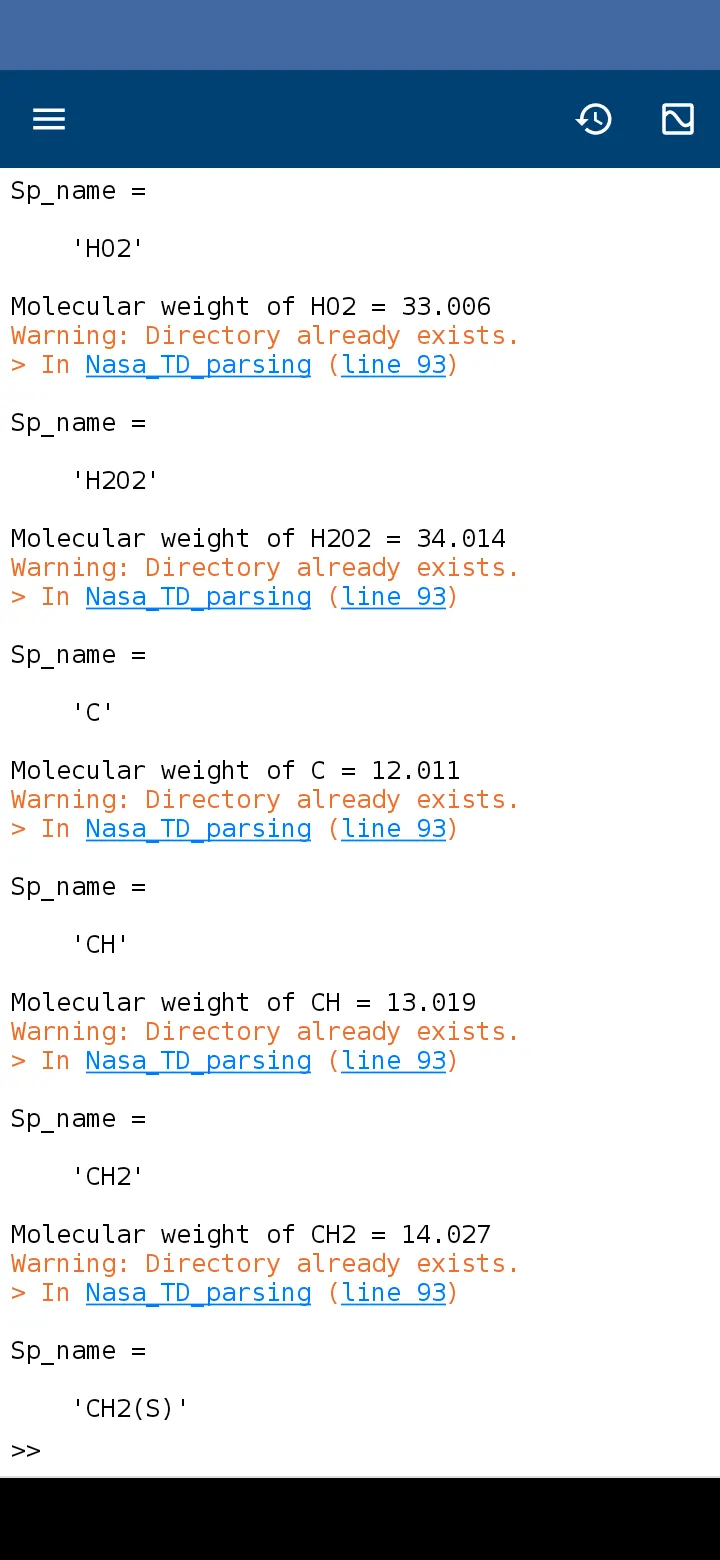
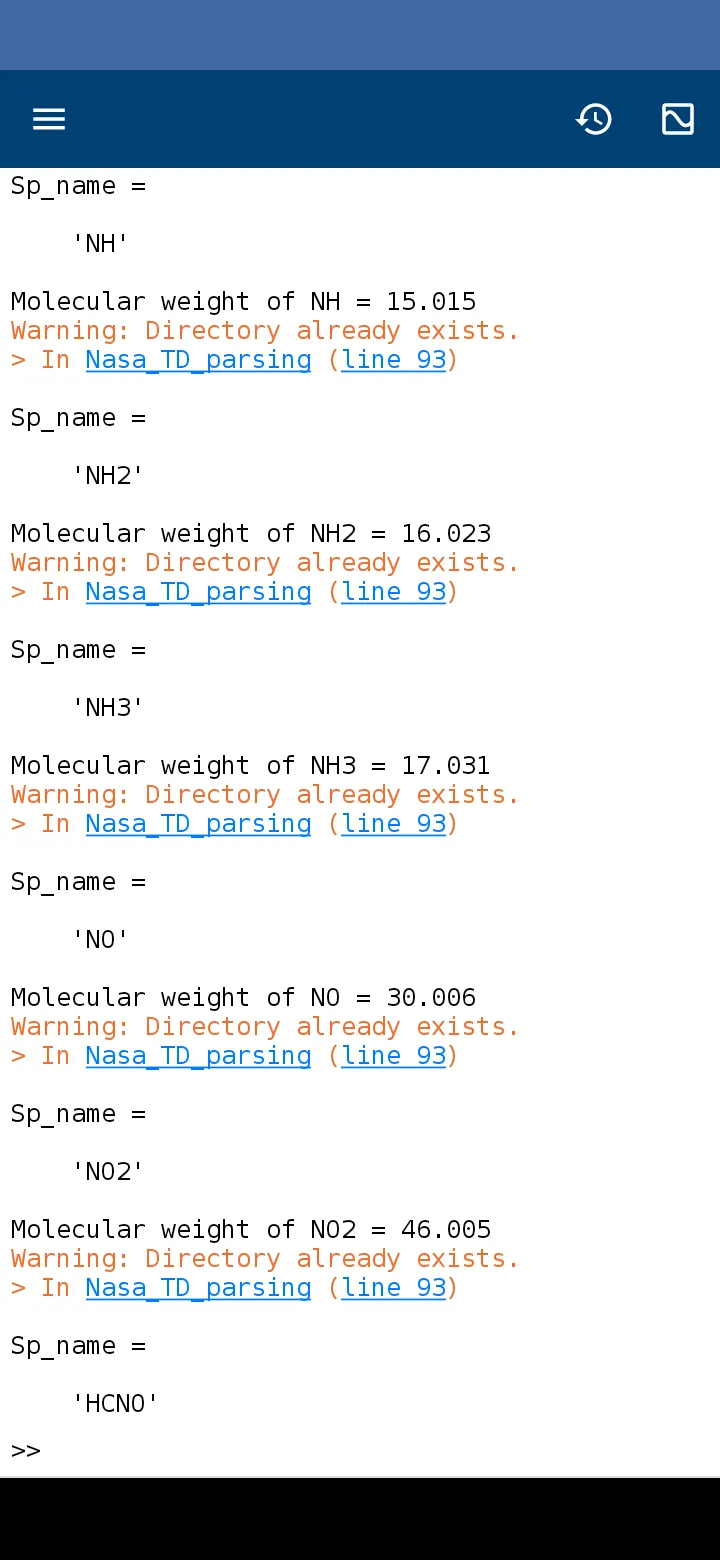
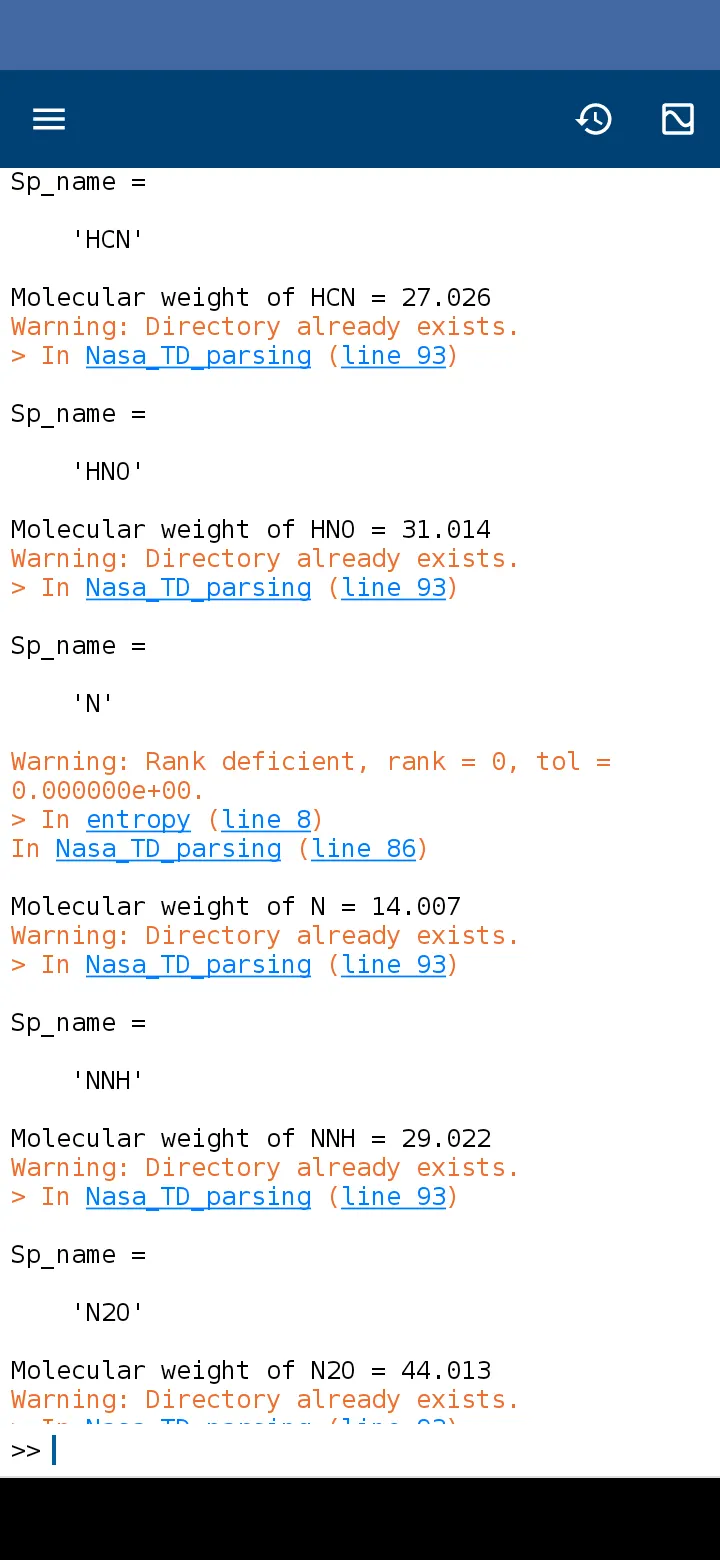
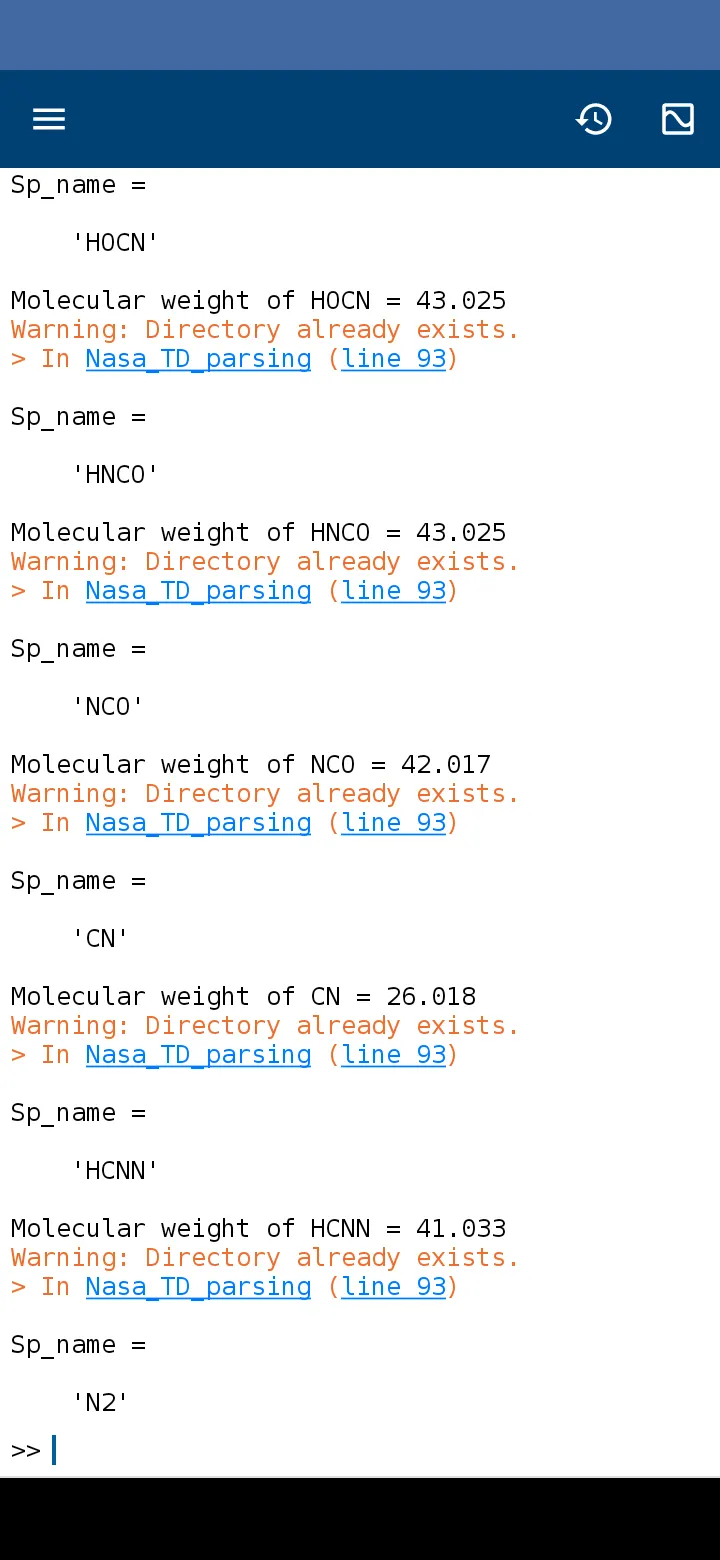
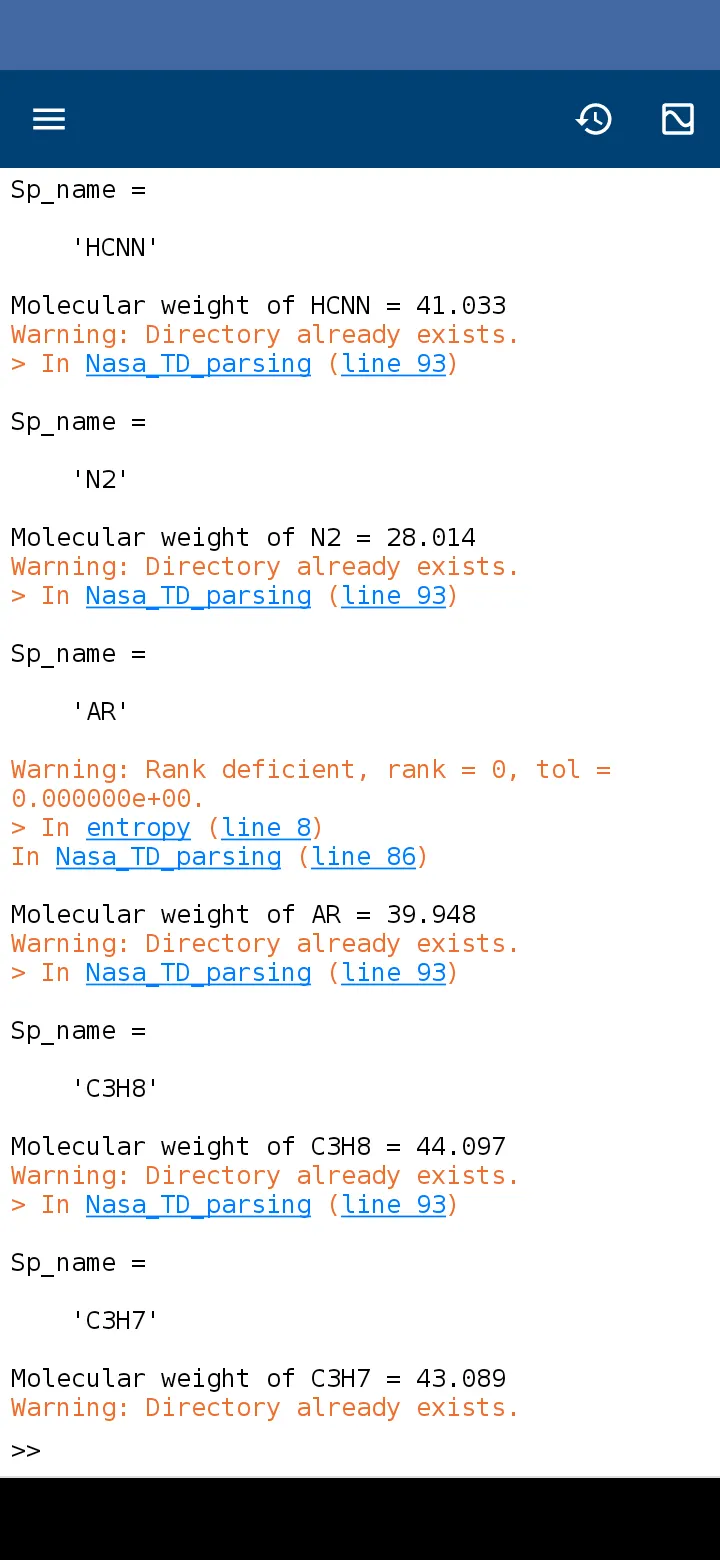
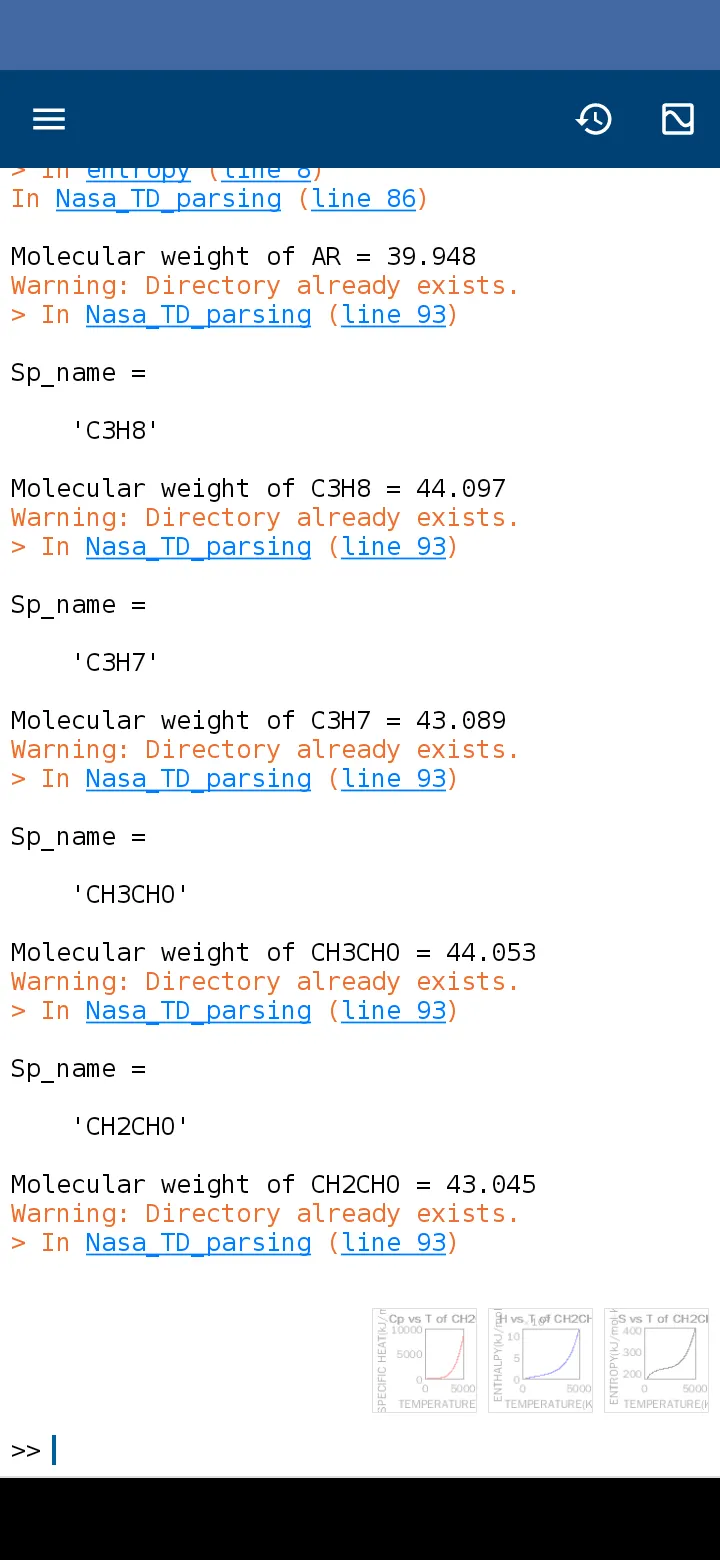
- The molecular weight is calculated based on the Species name
- Species name is compared to the Element name to calculate the molecular weight
- To check for any numbers in the species ( eg H2O, CH3CHO) the string is converted to numbers
- If 'n' elements are present in the species name then the atomic mass will be multiplied 'n-1' time since the atomic mass of that element is added one time when the for loop runs.
Section 4 :
Results
a) Species folder screenshot :
b) Plots
i) Plots of O2
ii) Plots of N2
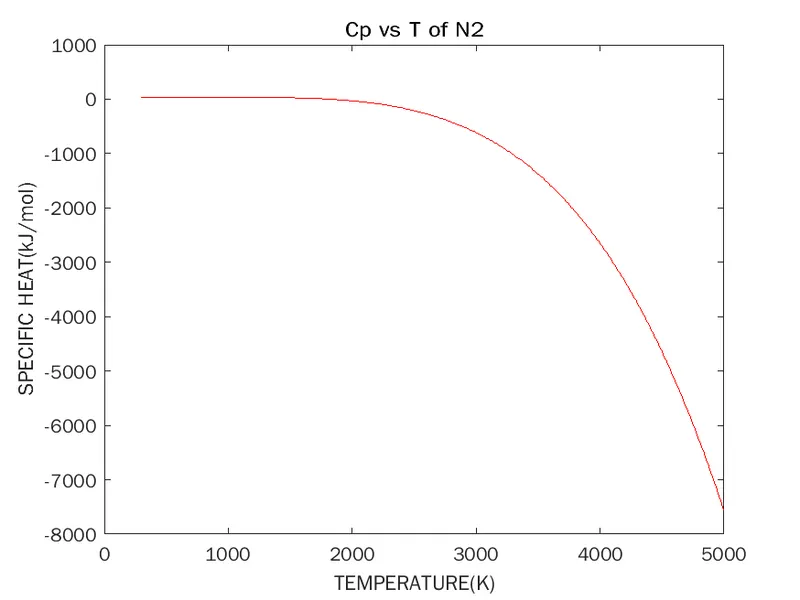
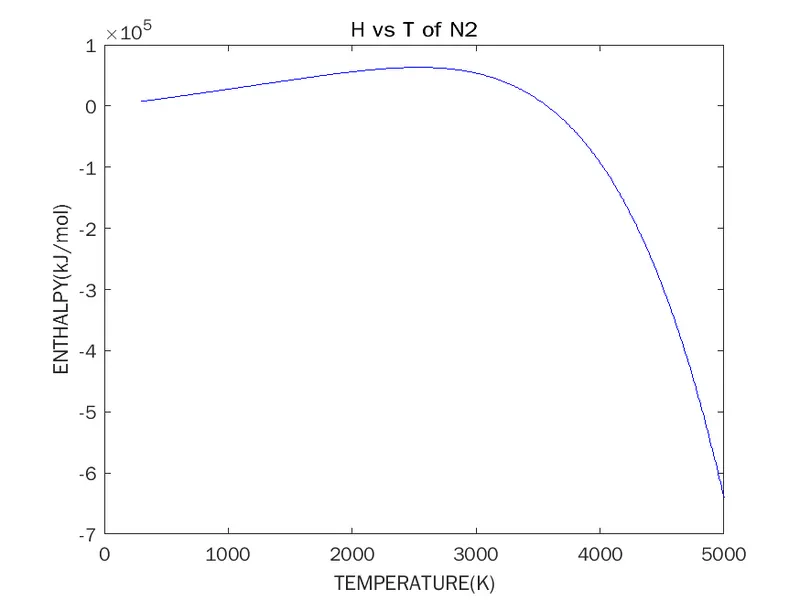
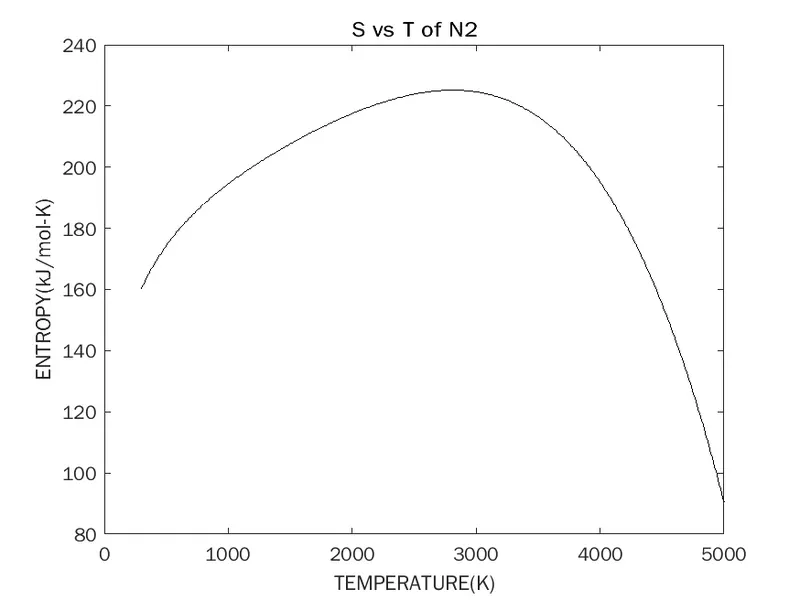
iii) Plots of CO2
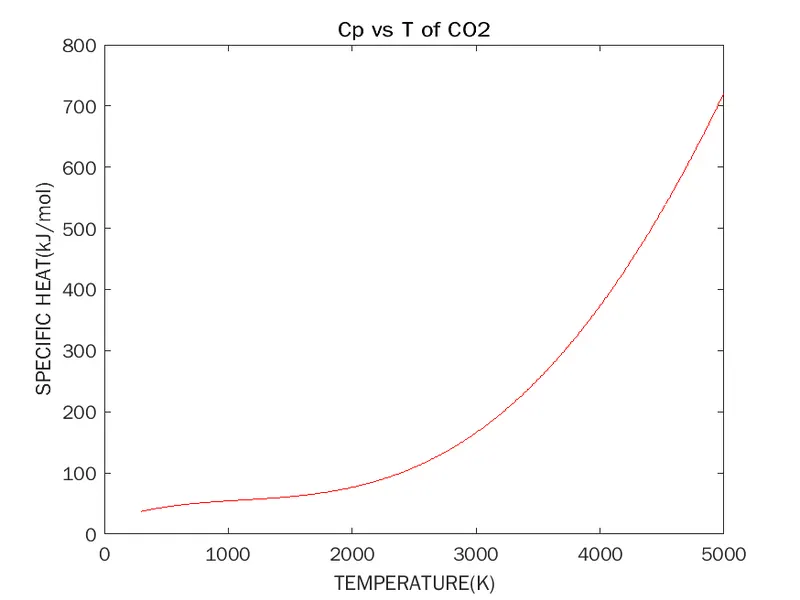
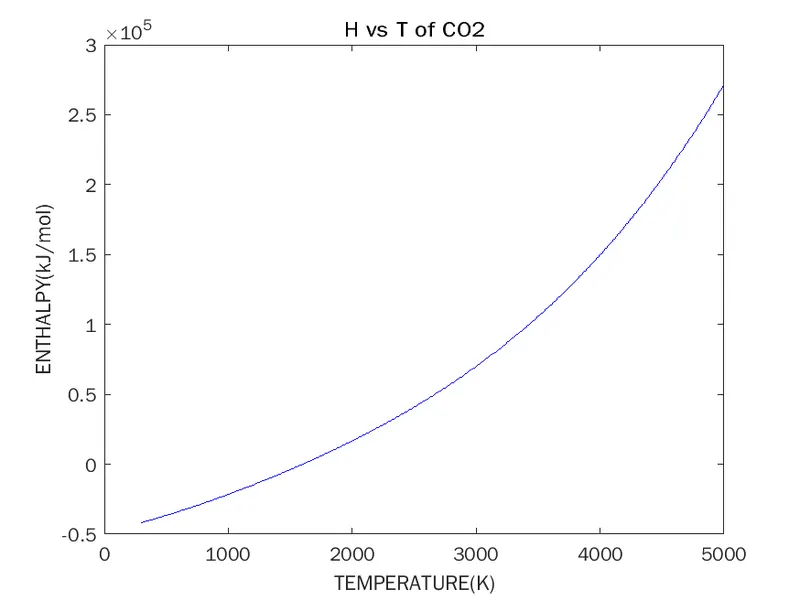
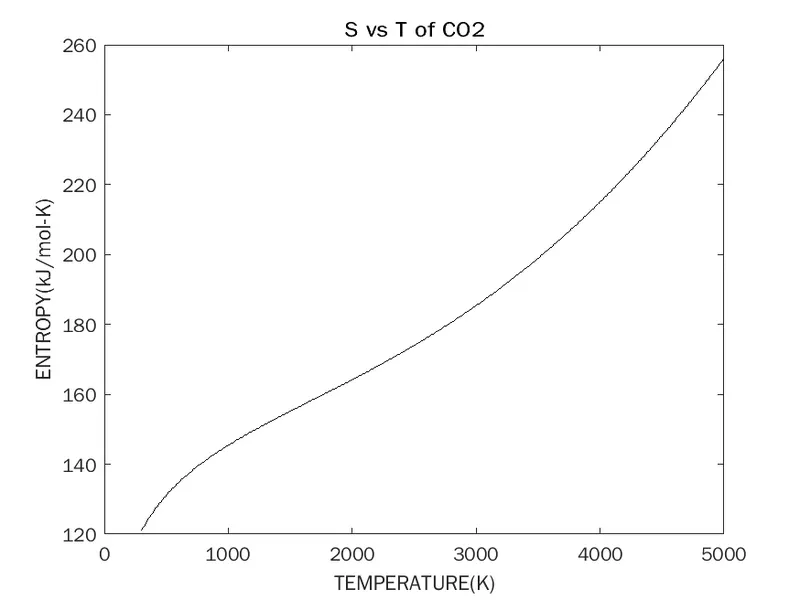
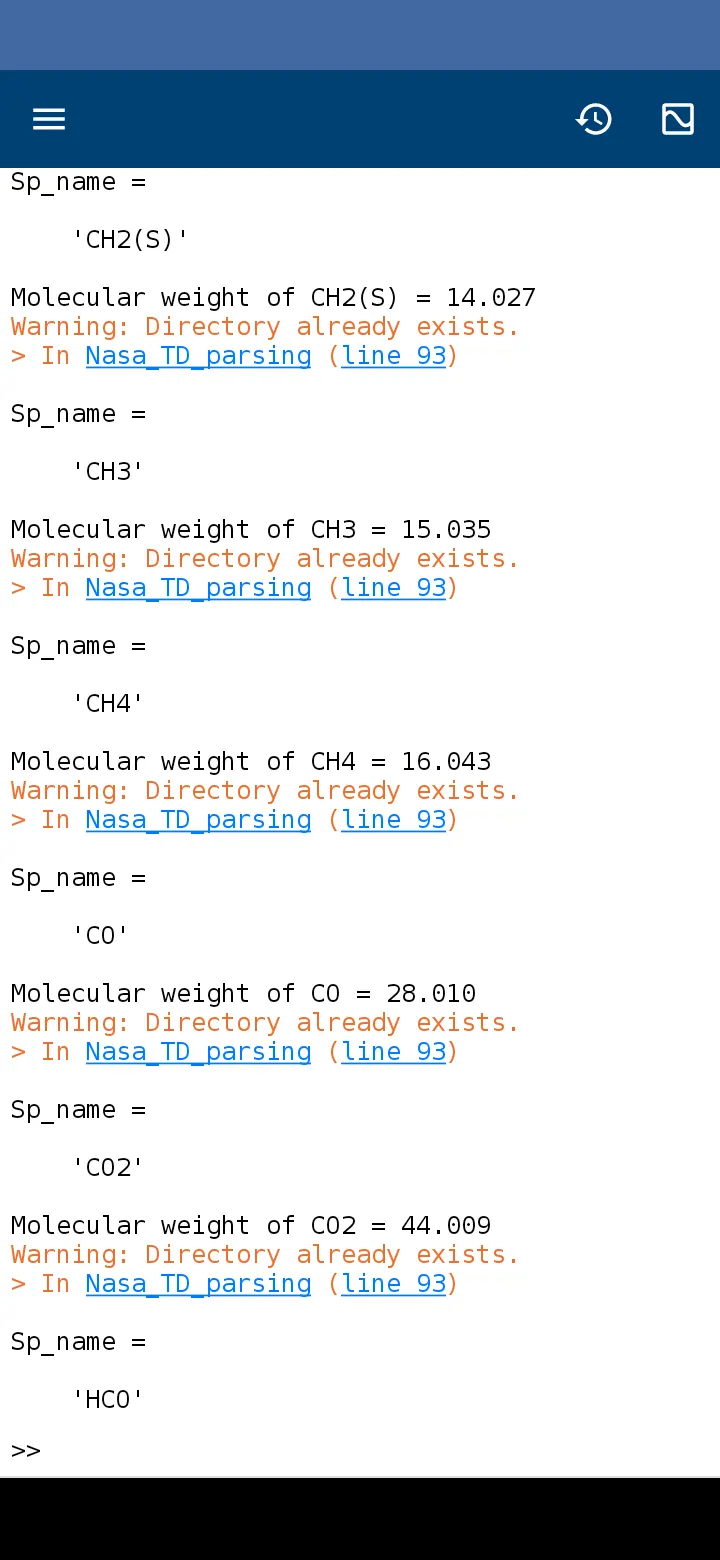
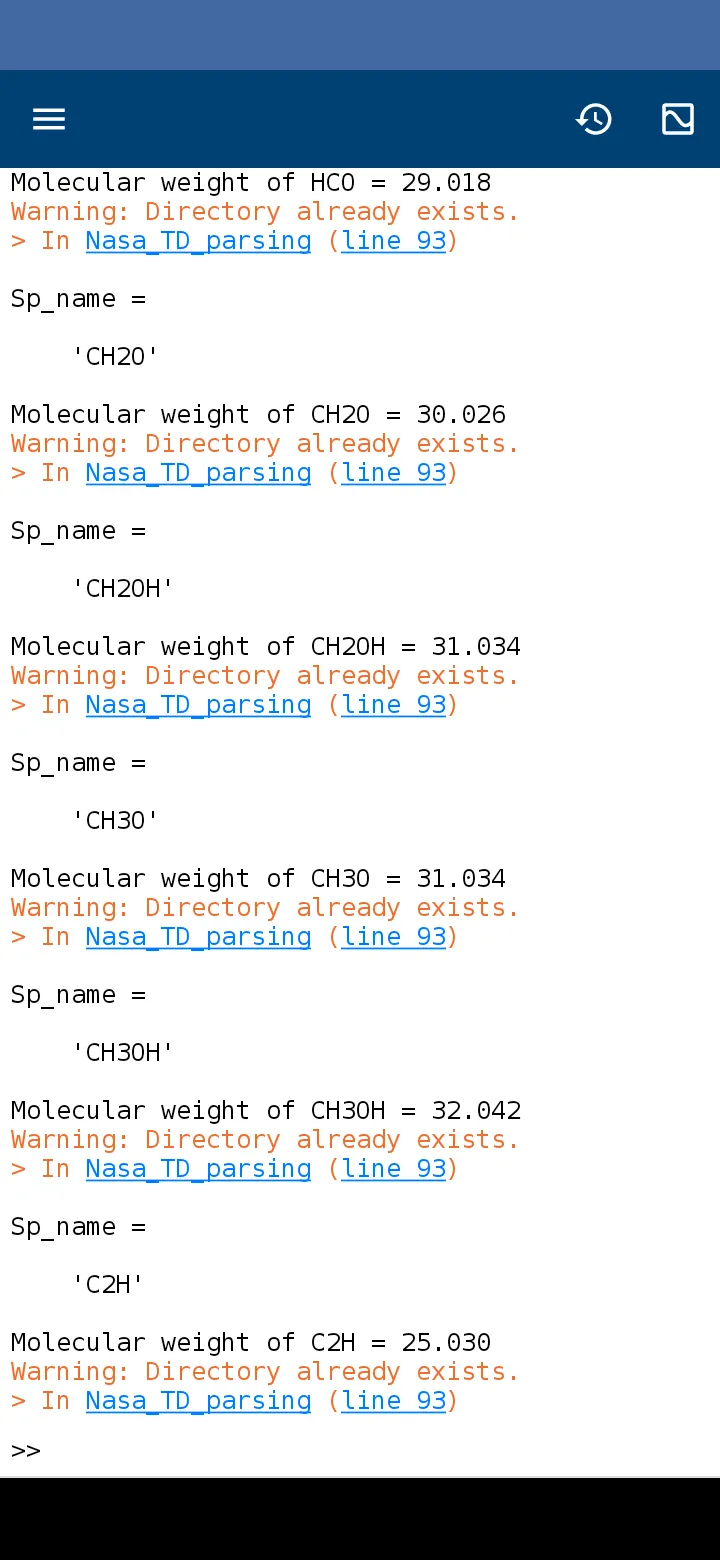
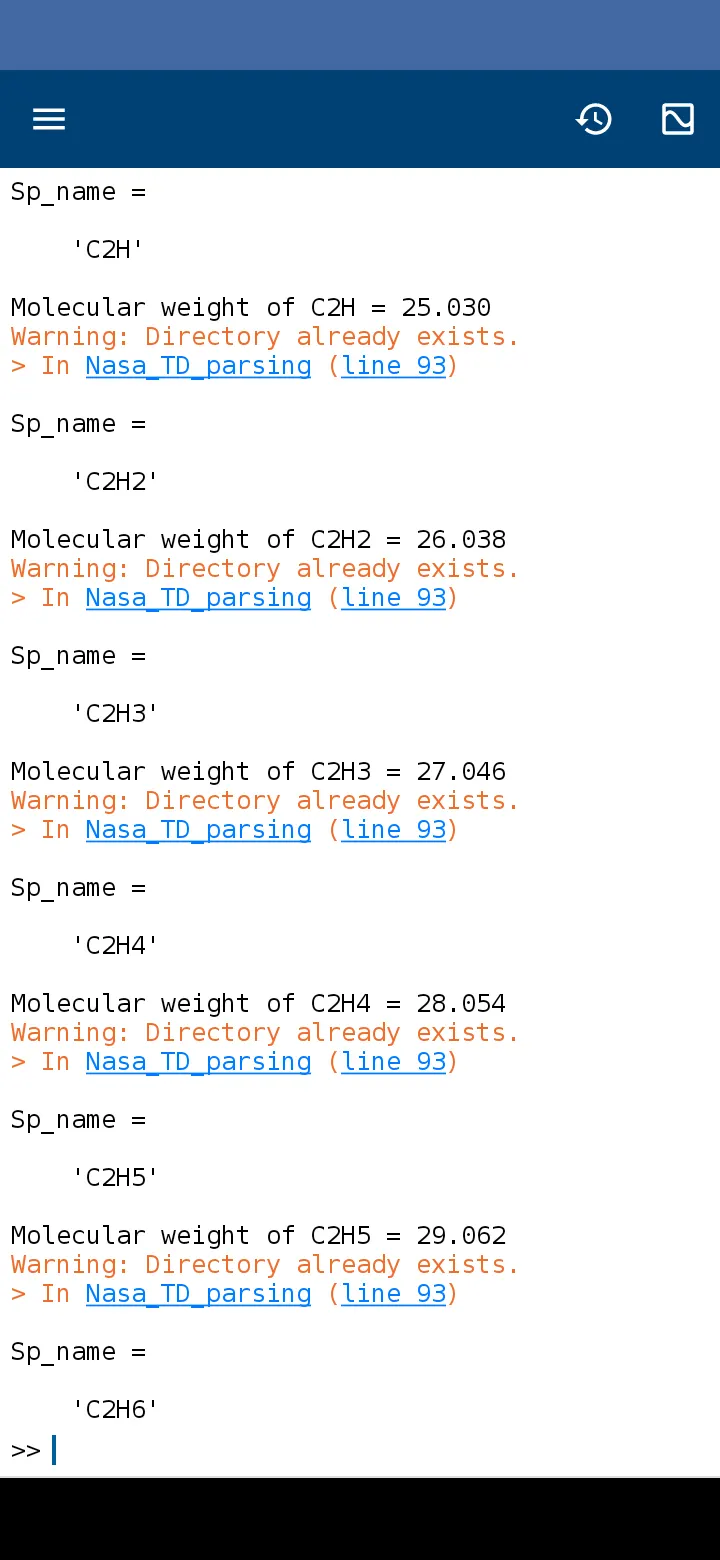
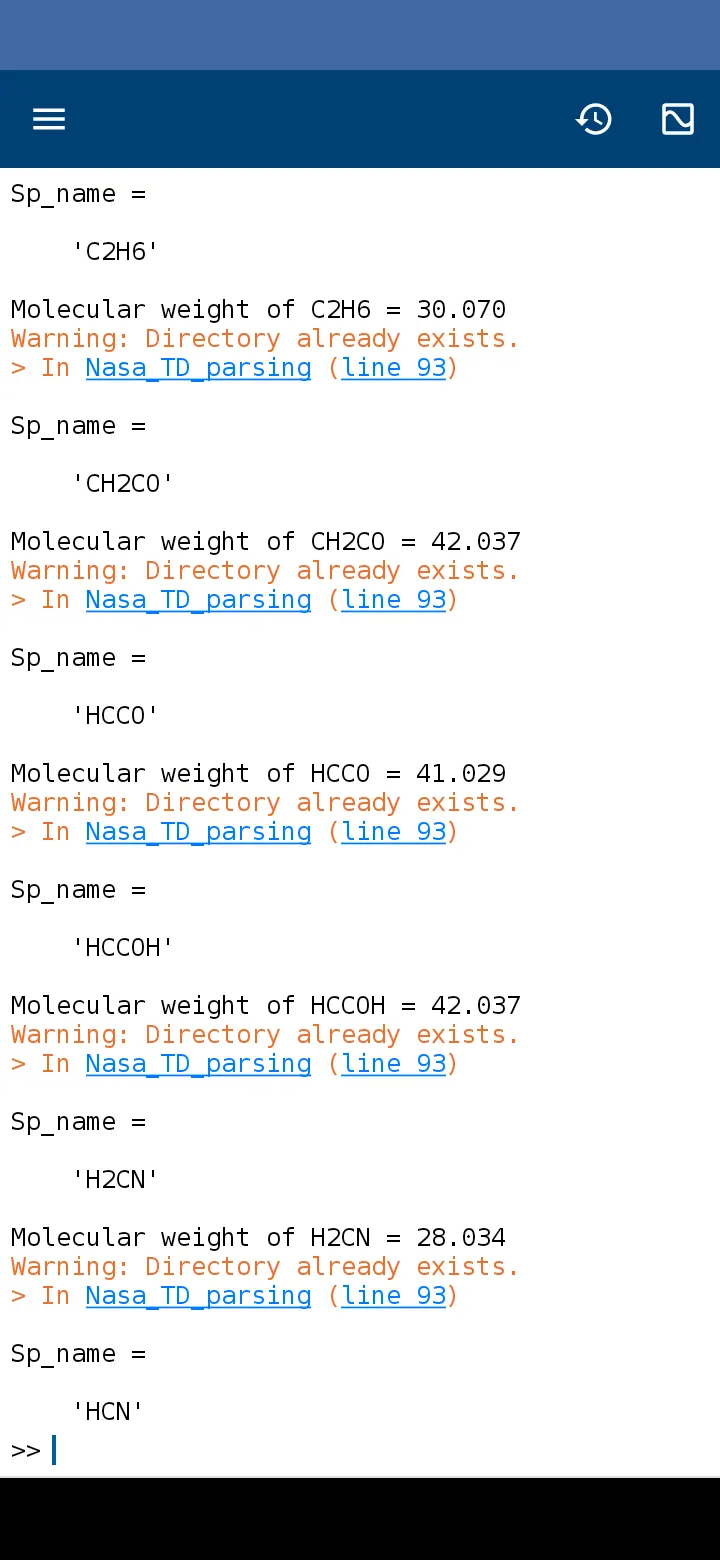
c) Molecular weights shown in command window
Section 5:
Inference :
Data parsing is a very useful concept to import data from an external source to MATLAB.
Using a combination of fgetl, strfind, strplit and various string functions available in MATLAB, it is possible to extract data and perform data analysis
Reference
Commands used :-
strfind - https://in.mathworks.com/help/matlab/ref/strfind.html?s_tid=doc_ta
strsplit - https://in.mathworks.com/help/matlab/ref/strsplit.html?s_tid=doc_ta
str2num - https://in.mathworks.com/help/matlab/ref/str2num.html?s_tid=doc_ta
fgetl - https://in.mathworks.com/help/matlab/ref/fgetl.html
feof - https://in.mathworks.com/help/matlab/ref/feof.html
mkdir - https://in.mathworks.com/help/matlab/ref/mkdir.html?s_tid=doc_ta
cd - https://in.mathworks.com/help/matlab/ref/cd.html
saveas - https://in.mathworks.com/help/matlab/ref/saveas.html?s_tid=doc_ta
---------------------------------------------------------------------------------END----------------------------------------------------------------------------------------------------------------