Project 1 - Parsing NASA thermodynamic data
AIM:
To write a Matlab program to extract the 14 co-efficients from NASA thermodynamic data file and to calculates the enthalpy,entropy and specific heats for all the species in the data file. Also by plotting the graphs of every species and to find the molecular mass of all species
Description:
File parsing is done to extract data from the file,it should be as generic as possible to fetch the data from different files.In this program we are getting the 14 co-effecients from the data and by using this we calculate enthalpy,entropy and specific heat for different species and the condition is that the FIRST 7 coefficients are HIGH - temperature coefficients and the SECOND 7 coefficients are LOW- temperature coefficients.
The formulae to calculate specific heat, enthalpy and entropy are given below.
Here R is the universal gas constant, T is the temeprature
Cp/R = a1 + a2 T + a3 T^2+ a4 T^3 + a5 T^4
H/RT = a1 + a2 T/2 +a3 T^2/3 + a4 T^3 /4 +a5 T^4/5 + a6/T
S/R = a1 lnT + a2 T+ a3 T^2/2 +a4 T^3/3 +a5 T^4 /4+a7
Program Algorithm:
- THERMO.dat file is imported to the program by using the 'fopen' command and each and every line is read by using 'fgetl' command.
- Inorder to get the header information 'strsplit' command is used to split the string and the global temperatures are fetched.
- Next three statements are irrelevennt, hence its is skipped by using the 'fgetl' line inside the 'for loop'.
- Now the species data is read, since there are 53 species and the logic remains the same hence 'for loop' for the 53 species is declared and the main program is given inside the 'for loop'.
- The species first line contains the species name and local temperatures and next three lines contains the co-effecients.
- Hence by using the 'strsplit' command the species_name and the local temperatures are obtained.
- Inorder to get the co-effecients 'strfind' command is used find the variable 'E' by using this as reference co-effecients are assigned.
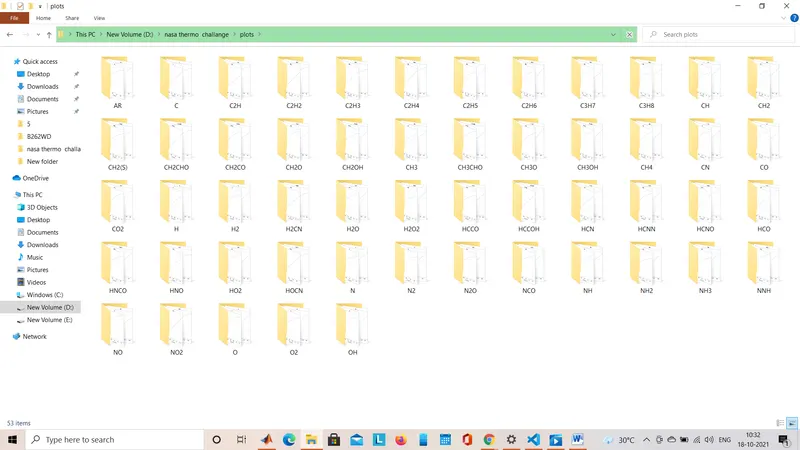
- To create a seperate folder to save the plot for every species 'mkdir' command is used.
- For plotting we need a set of temperatures hence the local species temperature are splitted into 1000 points by using 'linspace' command.
- To assign the high and low temperature co-effecients each and every local temperature is compared with the local mid temperature.
- Thus by using the formulae specific heat ,entropy and enthalpy are calculated and plotting is carried out
- For saving the plots 'cd' command is used.
- To find the molecular mass for each and every element atomic weight is assigned now by using the 'strcmp' command each species elements are compared and molecular mass is stored using two 'for loops', one to iterate the species elements and one to compare the elements.
- In some species like HNO3 the element's atomic weight to be added twice (or) thrice,hence flag operator is used to get the position and that element atomic weight is added to the molecular weight by using the 'if' condition.
Program:
clear all
close all
clc

% Getting the data file

 f1 = fopen('THERMO.dat','r');
 fgetl(f1)

 % Reading the header information

 A = fgetl(f1);
 A = strsplit(A,' ');

 global_low_temp = str2num(A{2});
 global_mid_temp = str2num(A{3});
 global_high_temp = str2num(A{4});

 % Skipping next three lines

  for i = 1:3
      fgetl(f1);
  end

  % Reading the species
  for i = 1:53

      header = fgetl(f1);
      x = strsplit(header,' ');
      species_name = (x{1});
      z = length(x);
      local_low_temp = str2double(x{z-3});
      local_high_temp = str2double(x{z-2});
      local_mid_temp = str2double(x{z-1});

      t1 = local_low_temp;
      t2 = local_mid_temp;
      t3 = local_high_temp;

      % Getting first line coefficients (a1-a5)

      line_1 = fgetl(f1);

      a = strfind(line_1,'E');
      a1 = str2double(line_1(1:a(1)+3));
      a2 = str2double(line_1(a(1)+4:a(2)+3));
      a3 = str2double(line_1(a(2)+4:a(3)+3));
      a4 = str2double(line_1(a(3)+4:a(4)+3));
      a5 = str2double(line_1(a(4)+4:a(5)+3));

      % Getting second line coefficients (a6-a10)

      line_2 = fgetl(f1);

      a_1 = strfind(line_2,'E');
      a6 = str2num(line_2(1:a_1(1)+3));
      a7 = str2double(line_2(a_1(1)+4:a_1(2)+3));
      a8 = str2double(line_2(a_1(2)+4:a_1(3)+3));
      a9 = str2double(line_2(a_1(3)+4:a_1(4)+3));
      a10 = str2double(line_2(a_1(4)+4:a_1(5)+3));

      % Getting third line coeffecients(a10-a14)

      line_3 = fgetl(f1)

      a_2 = strfind(line_1,'E');
      a11 = str2double(line_3(1:a_2(1)+3));
      a12 = str2double(line_3(a_2(1)+4:a_1(2)+3));
      a13 = str2double(line_3(a_2(2)+4:a_1(3)+3));
      a14 = str2double(line_3(a_2(3)+4:a_1(4)+3));

      % Creating folder

      % mkdir([This PC > New Volume (D:) > nasa thermo challange])

      T = linspace(t1,t3,1000);
      R = 8.314;

      % To get array of specific heat ,enthalpy,and entropy

      for k = 1:length(T)

      % To compare the species temperature to assign the coeffieceints
      % a1-a7( high temperature coeffieceints),a8-a14(low temperature
      % coeffecients)

      if T(k)>t2

          % high temperature coeffeceints

          cp(k) = (a1+a2.*T(k)+a3.*T(k).^2+a4.*T(k).^3+a5.*T(k).^4)*R;

          H(k) = (a1+(a2.*T(k))/2+(a3.*T(k).^2)/3+(a4.*T(k).^3)/4+(a5.*T(k).^4)/5+(a6./T(k)))*R.*T(k);

          S(k) = a1.*log(T(k))+a2.*T(k)+(a3.*T(k).^2)/2+(a4.*T(k).^3)/3+(a5.*T(k).^4)/4+a7;

      else
          % low temperature coeffeceints

          cp(k) = (a8+a9.*T(k)+a10.*T(k).^2+a11.*T(k).^3+a12.*T(k).^4)*R;

          H(k) = (a8+a9.*T(k))/2+(a10.*T(k).^2)/3+(a11.*T(k).^3)/4+(a12.*T(k).^4)/5+(a13./T(k))*R.*T(k);

          S(k) = a8.*log(T(k))+a9.*T(k)+(a10.*T(k).^2)/2+(a11.*T(k).^3)/3+(a12.*T(k).^4)/4+a14;

      end
      end

      % Plotting the graphs

        figure(1);
        plot(T,cp);
        grid on;
        title(species_name);
        xlabel('Temperature');
        ylabel('Specific heat');

        figure(2);
        plot(T,H);
        grid on;
        title(species_name);
        xlabel('Temperature');
        ylabel('Enthapy');

         figure(3);
        plot(T,S);
        grid on;
        title(species_name);
        xlabel('Temperature');
        ylabel('Entropy');

        % Changing the directory and saving the file

          mkdir(['D:\nasa thermo  challange\plots\',species_name]);
          cd(['D:\nasa thermo  challange\plots\',species_name]);
          saveas(1,'specific heat','jpg');
          saveas(2,'enthalpy','jpg');
          saveas(3,'entropy','jpg');

          % molecular_mass calculation

          elements = ['H','C','O','N','A']'

          atomic_weight = [1.0079 12.0107 15.999 14.0067 39.948];

          mol_mass = 0;

            for l = 1:length(species_name)
                for m = 1:length(atomic_weight)
                    if strcmp(species_name(l),elements(m))
                        mol_mass = mol_mass+atomic_weight(m);
                        position = m;
                    end
                end
                n = str2double(species_name(1));
                if n>1
                    mol_mass = mol_mass+atomic_weight(position)*(n-1);
                end
            end
              sprintf('Molecular weight of %s: %f u',species_name,mol_mass)
  end
        fclose(f1)
Folder with plottings:
Molecular Mass of each Species:
ans =
'Molecular weight of HCNO: 43.024300 u'
ans =
'Molecular weight of HOCN: 43.024300 u'
ans =
'Molecular weight of HNCO: 43.024300 u'
ans =
'Molecular weight of NCO: 42.016400 u'
ans =
'Molecular weight of CN: 26.017400 u'
ans =
'Molecular weight of HCNN: 41.032000 u'
ans =
'Molecular weight of N2: 14.006700 u'
ans =
'Molecular weight of AR: 39.948000 u'
ans =
'Molecular weight of C3H8: 13.018600 u'
Conclusion:
This program runs on its own to extract data(co-effecients) from the file ,calculate the specific heat, enthalpy and entropy and plot its variation with respect to temperature and saving it in a seperate folder.Also molecular mass of each species is founded.