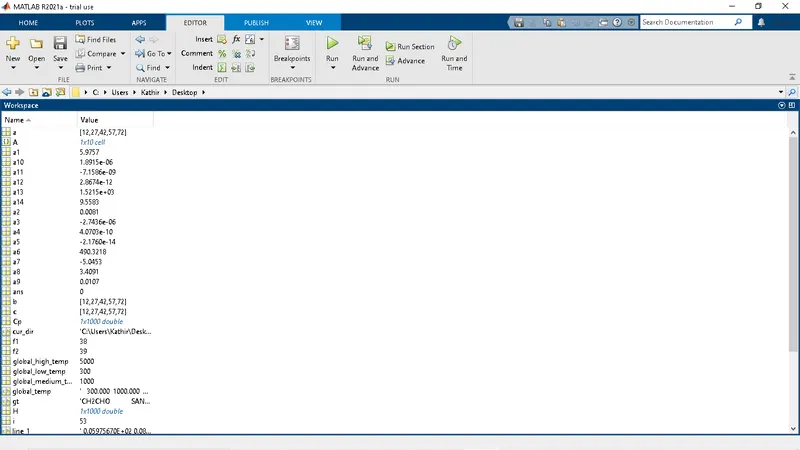
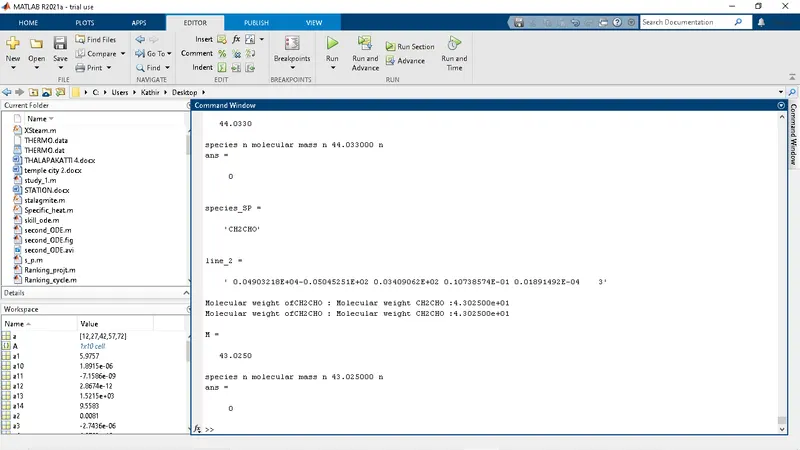
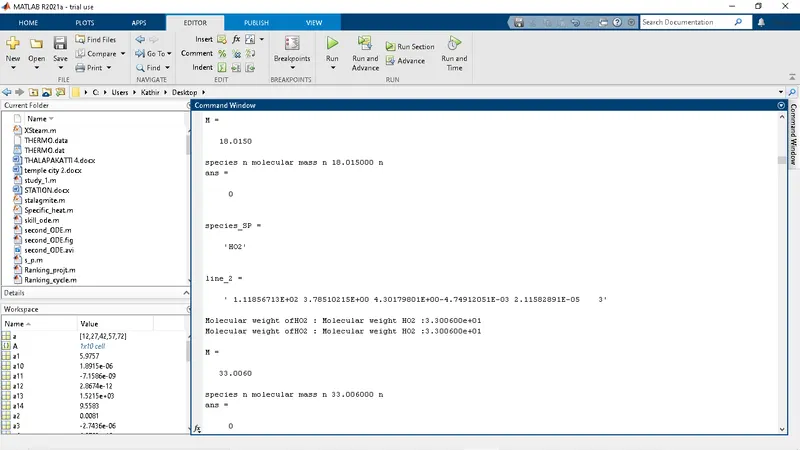
Project 1 - Parsing NASA thermodynamic data
AIM: Function that extracts NASA thermodynamic data file and caclulate thermodynamic properties of various species
OBJECTIVE:
- write function that excats 14 coefficients and calculates the enthalpy, entropy,specific heat.
- calculate molecular weight and display command window.
- save the plot image and suitable title.
- screenshoot the window where all the folders are saved.
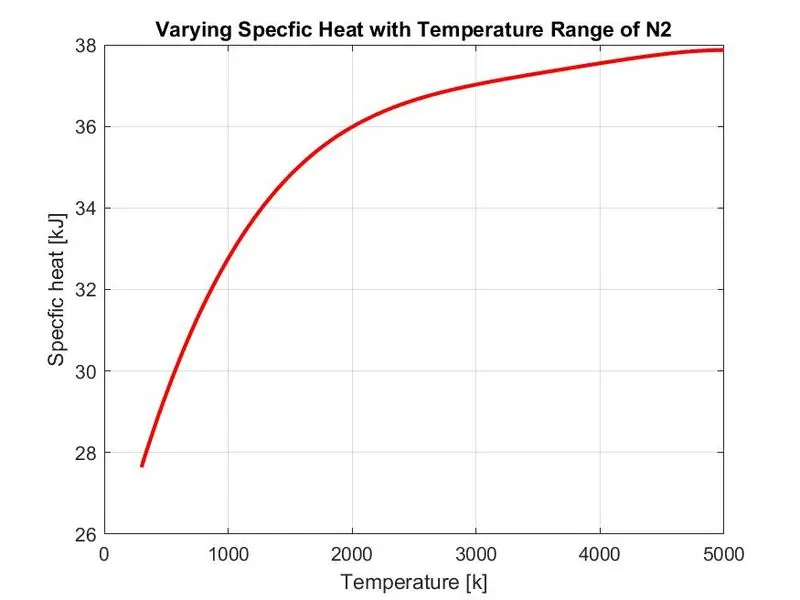
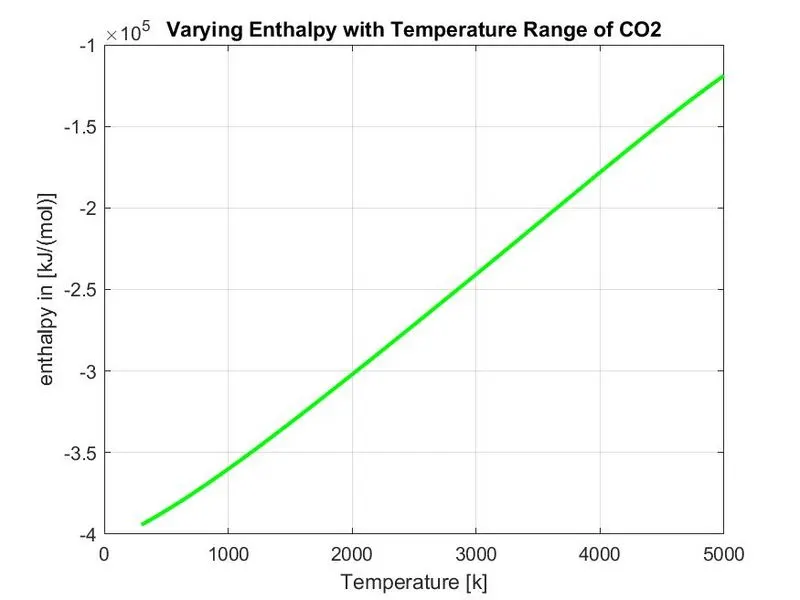
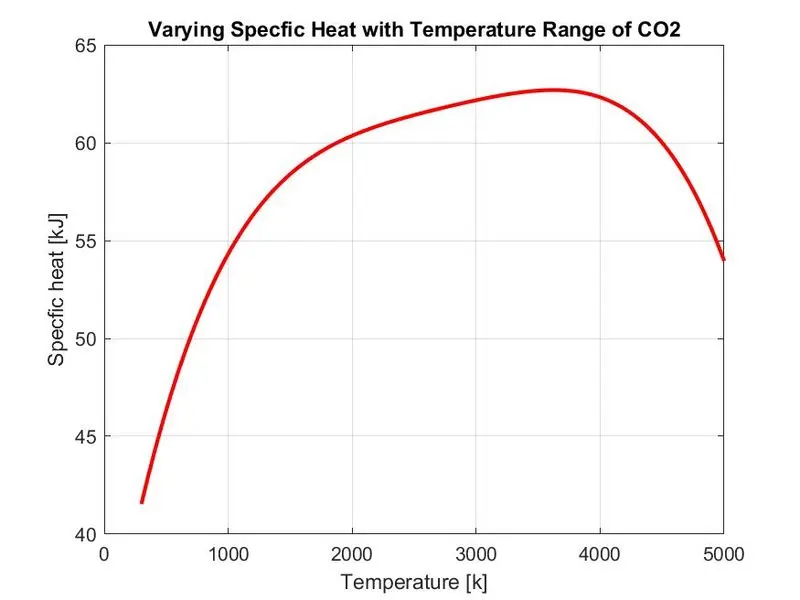
- plot for o2, N2 and co2 species.
FILE PARSING:
parsing the file means reading data stream of some sort and buliding in memory model.
NASA THERMODYNAMIC FILE :
NASA thermodynamic file which is THERMO,dat file which they are temperature range and 53 species are given in the data and each species contans 14 coefficients. To find specfic heat, enthalpy, entropy using formula.
where,
Cp = Specfic heat
S = Entropy[kj/mol-k]
H = Entropy[kj/mol]
T = Temperature
R = Universal gas constant
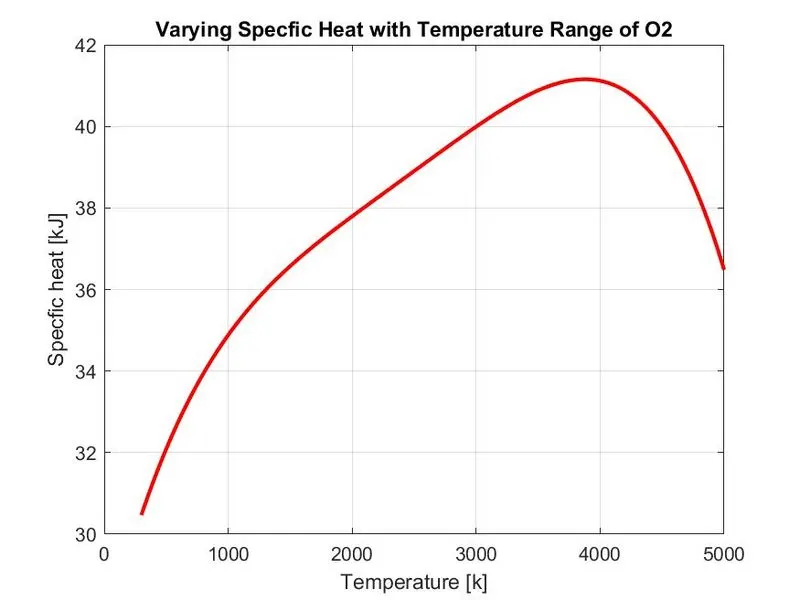
SPECIFIC HEAT:
The relationship between heat and temperature change is usually ecpressed in specific heat.
Cp = R*(a1 + (a2*T) + (a3*(T).^2) + (a4*(T).^4))
ENTROPY:
S = R*(a1.*log(T) + (a2*T) + ((a3*(T).^2)/2 + ((a4*(T).^3)/3) + ((a5*(T).^4/4) + a7)
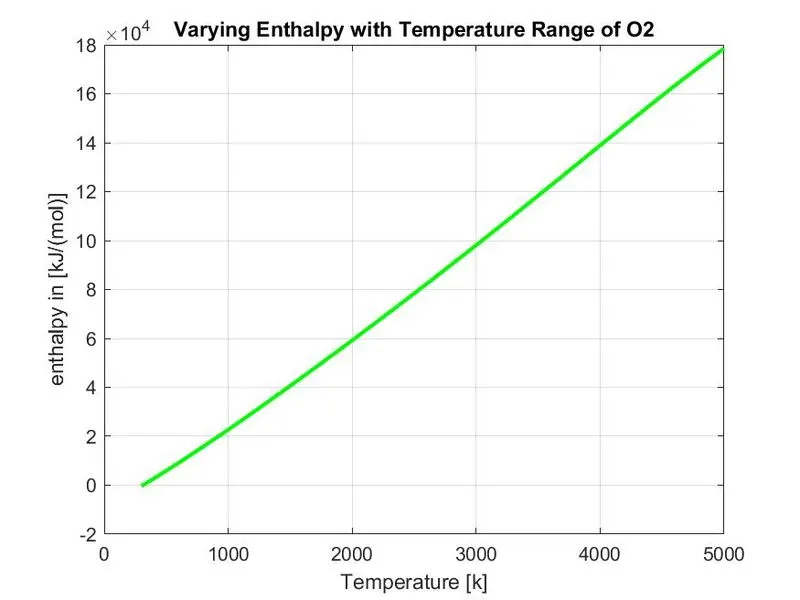
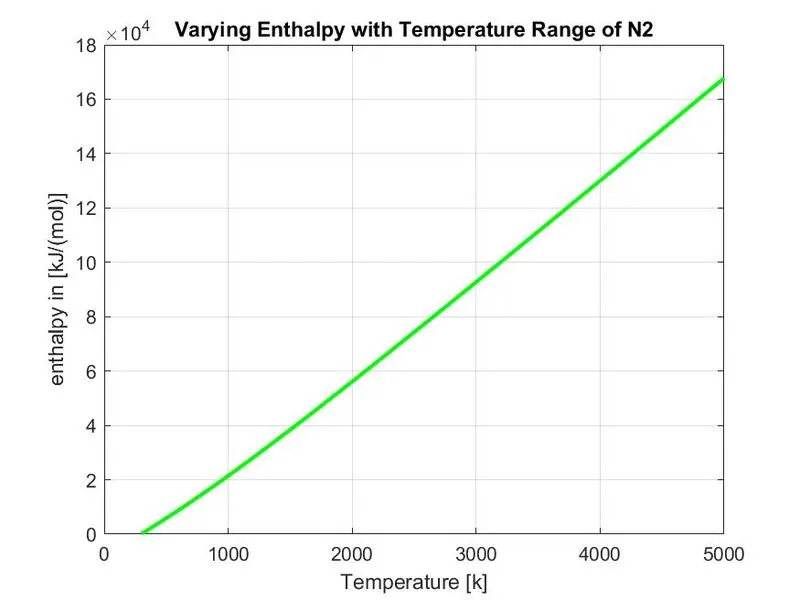
ENTHALPY:
H = R*T.*((a2*T)/2) + ((a3*(T).^2)/3) + ((a4*(T).^3)/4) + ((a5*(T).^4)/5) + ((a6./T)))
CODE:
MAIN CODE:
clear all
close all
clc

% make directory
mkdir 'C:UserAdminDesktopNASA File Parsing'

% read the file
f1 = fopen('THERMO.dat','r')
gt = fgetl(f1)

% obtaining temperature reading
global_temp = fgetl(f1);

% splitting
t = strsplit(global_temp);

% converting string cell using str2num,
global_low_temp = str2num(t{2});
global_medium_temp = str2num(t{3});
global_high_temp = str2num(t{4});

% temperature range
Temp = linspace(global_low_temp,global_high_temp,1000);
% gas conctant
R = 8.314;

% skipping three command line in file
for i = 1:3
    gt = fgetl(f1);
end

for i = 1:53
    gt = fgetl(f1);
    A = strsplit(gt,' ');
    species_SP = (A{1})

   line_1 =fgetl(f1);
   a = strfind(line_1,'E');

   % extracting higher and lower temp coefficient

   % extracting fist 7 coefficient higher temp
   a1 =  line_1(1:a(1)+3);
   a1 = str2num(a1);
   a2 = line_1(a(1)+4:a(2)+3);
   a2 = str2num(a2);
   a3 = line_1(a(2)+4:a(3)+3);
   a3 = str2num(a3);
   a4 = line_1(a(3)+4:a(4)+3);
   a4 = str2num(a4);
   a5 = line_1(a(4)+4:a(5)+3);
   a5 = str2num(a5);

   line_2 = fgetl(f1)
   b = strfind(line_1,'E');
   a6 = line_2(1:b(1)+3);
   a6 = str2num(a6);
   a7 = line_2(a(1)+4:b(2)+3);
   a7 = str2num(a7);

   % extracting second 7 coefficient low temp
   a8 = line_2(b(2)+4:b(3)+3);
   a8 = str2num(a8);
   a9 = line_2(b(3)+4:b(4)+3);
   a9 = str2num(a9);
   a10 = line_2(b(4)+4:b(5)+3);
   a10 = str2num(a10);

   line_3 = fgetl(f1);
   c =strfind(line_1,'E');

   a11 = line_3(1:c(1)+3);
   a11 = str2num(a11);
   a12 = line_3(c(1)+4:c(2)+3);
   a12 = str2num(a12);
   a13 = line_3(c(2)+4:c(3)+3);
   a13 = str2num(a13);
   a14 = line_3(c(3)+4:c(4)+3);
   a14 = str2num(a14);

   % Specfic heat calculaion
   Cp = Specific_heat(a1,a2,a3,a4,a5,a8,a9,a10,a11,a12,Temp,R,global_medium_temp);

   % Enthalpy calculation
   H = Enthalpy(a1,a2,a3,a4,a5,a6,a8,a9,a10,a11,a12,a13,Temp,R,global_medium_temp);

   % Entropy calculation
   S = Entropy(a1,a2,a3,a4,a5,a7,a8,a9,a10,a11,a12,a14,Temp,R,global_medium_temp);

   % Molecular weight
   Molecularweight(i) = Molecular_weight(species_SP);

   % Read and write molecular list
   Molecular_list = fopen('Molucular weight.txt','a++');
   fprintf( Molecular_list,'Molecular weight of %s is %d n',species_SP,Molecularweight);
   fclose(Molecular_list);

   % plotting(CP,H,S,Temp,species_SP)

   cur_dir = pwd;
   mkdir(species_SP);
   cd(species_SP);


   % plot 1, specfic heat (cp) vs temperature range (temp)

   figure(1)
   plot(Temp,Cp,'linewidth',2,'color','r');
   xlabel('Temperature [k]');
   ylabel('Specfic heat [kJ]');
   title(sprintf('Varying Specfic Heat with Temperature Range of %s',species_SP));
   grid on
   saveas(figure(1),'Specfic Heat.jpg');

   % plot 2, Enthalpy (H) vs Temperature Range (Temp)


   figure(2)
   plot(Temp,H,'linewidth',2,'color','g');
   xlabel('Temperature [k]');
   ylabel('enthalpy in [kJ/(mol)]');
   title(sprintf('Varying Enthalpy with Temperature Range of %s',species_SP));
   grid on
   saveas(figure(2),'Enthalpy.jpg')

  % plot 3, enthalpy (s) vs Temperature range (temp)

  figure(3)
  plot(Temp,S,'linewidth',2,'color','b');
  xlabel('Temperature [k]');
  ylabel('entropy in [kj/(mol-k)]');
  title(sprintf('Varying Entropy with Temperature Range of %s',species_SP));
  grid on
  saveas(figure(2),'Entropy.jpg')

  cd(cur_dir);

  % Molecular weight
  M = Molecular_weight(species_SP)
  f2 = fopen('molecular mass','W');
  fprintf('%s n %s n %f n','species','molecular mass',M)
  fclose(f2)

end
STEPS:
- Fist, we can input the parameter R and open file THERMO.dat file and reading the file using fopen command.
- Read the fist THERMO using fgetl command and split temperature using strsplit command to convert str2num command to low,medium and high temperature.
- Then we assign temp range linspace command. run file using fgetl command.
- The run to find the 53 element in the data and splitting the cell array find the species.
- Then, we read the new line find the 'E' string using strfind command.
- Find the 7 coefficient for both higher and lower temperature.
- Specify enthalpy, entropy, specific heat and molecular weight.
- Change the diractory using cd command file using mkdir command to create folder.
- They will use to saveas command to plot.
SPECIFIC HEAT FUNCTION:
% specfic heat calculation function

function Cp = Specific_heat(a1,a2,a3,a4,a5,a8,a9,a10,a11,a12,Temp,R,global_medium_temp)
% comparing global temp

if Temp <= global_medium_temp
    Cp = R*(a8 + (a9*Temp) + (a10*(Temp).^2) + (a11*(Temp).^3) + (a12*(Temp).^4));
else
    Cp = R*(a1 + (a2*Temp) + (a3*(Temp).^2) + (a4*(Temp).^3) + (a5*(Temp).^4));
end
ENTHALPY FUNCTION:
% Enthalpy calculation function

function H = Enthalpy(a1,a2,a3,a4,a5,a6,a8,a9,a10,a11,a12,a13,Temp,R,global_medium_temp)
% comapring with global temp

if Temp <= global_medium_temp
    H = R*Temp.*(a8 + ((a9*Temp)/2) + ((a10*(Temp).^2)/3) + ((a11*(Temp).^3)/4) + ((a12*(Temp).^4)/5) + ((a13./Temp)));
else
    H = R*Temp.*(a1 + ((a2*Temp)/2) + ((a3*(Temp).^2)/3) + ((a4*(Temp).^3)/4)  + ((a5*(Temp).^4)/5) + ((a6./Temp)));
end
ENTROPY FUNCTION:
% Entropy calculation function

function S = Entropy(a1,a2,a3,a4,a5,a7,a8,a9,a10,a11,a12,a14,Temp,R,global_medium_temp)
% comparing global temp
for i = 1:length(Temp)
if Temp(i) <= global_medium_temp
    S(i) = R.*(a8.*log(Temp(i)) + (a9.*Temp(i)) + (a10*Temp(i).^2/2) + (a11*((Temp(i)).^3)/3) + (a12*((Temp(i)).^4)/4) + a14);
else

    S(i) = R.*(a1.*log(Temp(i)) + (a2.*Temp(i)) + (a3*Temp(i).^2/2) + (a4*((Temp(i)).^3)/3) + (a5*((Temp(i)).^4)/4) + a7);

end
end
MOLECULAR WEIGHT:
% Molecular weight calculation function

function Molecularweight = Molecular_weight(species_SP)
% standard automic name
atomic_name = ['H','C','O','N','A'];
% Hydrogen, Carbon, Oxygen, Nitrogen, Argon

fprintf('Molecular weight of');
fprintf(species_SP);
fprintf(' : ');
% standard automic number
Atomic_Weight = [1.008 12.001 15.999 14.007 39.948];
% starting range
Molecularweight = 0;

for i = 1:length(species_SP)
    for j = 1:length(atomic_name)
        if strcmpi(species_SP(i),atomic_name(j))
            Molecularweight = Molecularweight + Atomic_Weight(j);
            position = j;
        end
    end

    n = str2num(species_SP(i));

    if n>1

        Molecularweight = Molecularweight + Atomic_Weight(position)*(n-1);

    end
end
fprintf('Molecular weight %s :',species_SP);
fprintf('%d',Molecularweight);
disp(' ');
end
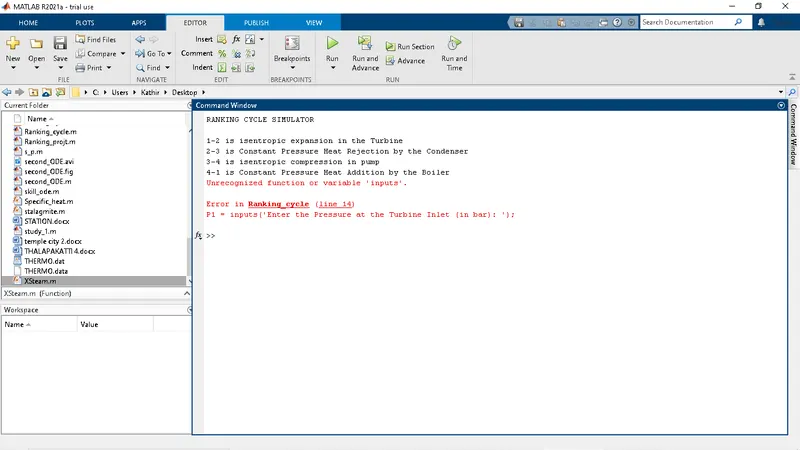
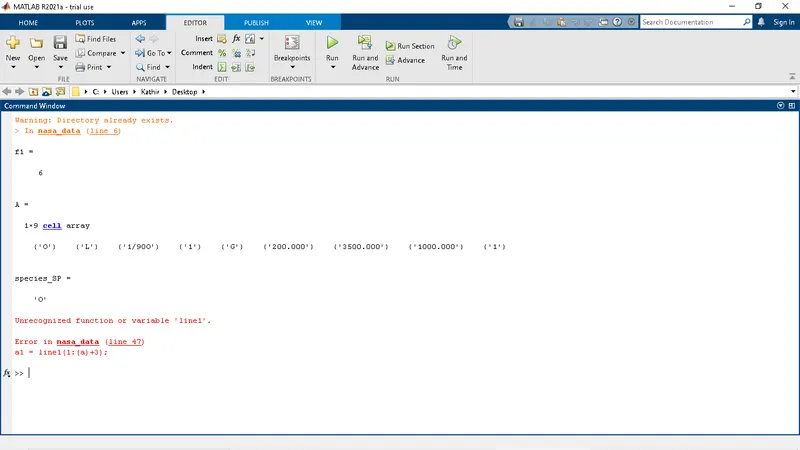
ERRORS :
FINAL RESULT:
PLOTS:
PLOT OF SPECIES O2:
PLOT OF SPECIES N2 :
PLOT SPECIES CO2:
SCREENSHOT DIRECTORY OF SAVED FILE:

OUTPUT: