Project 1 - Parsing NASA thermodynamic data
Aim:
1.To write a function that extracts the 14 co-efficients and calculates the enthalpy, entropy and specific heats for all the species in the data file.
2.Calculate the molecular weight of each species.
3.Plot the Cp,Enthalpy and Entropy for the local temperature for each species and dump the plots in sperate folders automatically generated with the 'THERMO.dat' file as inputs and generate the plots.
Introduction:
Parsing is refers to the analysis of the input code into components part in order to facilitate writing of compilers and interpreters.
It is also used to describe split.
File Parsing means reading the data of the given file of stream of data or a set of datas in a memory of the sematic contenet of the data.That facilitates some data transformation.
Governing Equation:
1. Cp/R = a1 + a2 T + a3 T^2 + a4 T^3 + a5 T^4
2. H/RT = a1 + a2 T/2 + a3 T^2/3 + a4 T^3/4 + a5 T^4/5 + a6/T
3. S/R = a1 lnT + a2 T +a3 T^2/2 + a3 T^2/2 + a4 T^3/3 + a5 T^4/4 + a7
Main Code:
The code blow is used to calculate the specific heat, enthalphy,plotting and calculating the molecular weight of the elemenet.
clear all
close all
clc

f1=fopen('THERMO.dat','r');
%Opening the thermo file
file_name = fgetl(f1);
%Get file name from the first line
tline_1 = fgetl(f1);
%get the file value in second line
A=strsplit(tline_1,' ');
%split the string values

%Geting the value of global temperature
global_low_temp = str2double(A{2});
global_mid_temp = str2double(A{3});
global_high_temp = str2double(A{4});

%Getting comments from thermo file
for i = 1:3
    comments = fgetl(f1);
end

for j = 1:53

    %getting species name
    tline_2 = fgetl(f1);
    s = strsplit(tline_2,'');
    %splitting the string values
    species_name = s{1};
    A=strfind(tline_2,'G');
    temp_values=tline_2(A+4:length(tline_2));
    B=strsplit(temp_values,' ');

    %Getting the value of the local temp of different species
    local_low_temp = str2double(B{1});
    local_high_temp = str2double(B{2});
    local_mid_temp = str2double(B{3});

    %Extracting coefficient from first line
    line_1 = fgetl(f1);
    l1 = strfind(line_1,'E');
    a1 = str2double(line_1(1:(l1(1)+3)));
    a2 = str2double(line_1((l1(1)+4:l1(2)+3)));
    a3 = str2double(line_1((l1(2)+4:l1(3)+3)));
    a4 = str2double(line_1((l1(3)+4:l1(4)+3)));
    a5 = str2double(line_1((l1(4)+4:l1(5)+3)));

    %Extracting coefficient from second line
    line_2 = fgetl(f1);
    l2 = strfind(line_2,'E');
    a6 = str2double(line_2(1:(l2(1)+3)));
    a7 = str2double(line_2((l2(1)+4:l2(2)+3)));
    a8 = str2double(line_2((l2(2)+4:l2(3)+3)));
    a9 = str2double(line_2((l2(3)+4:l2(4)+3)));
    a10 = str2double(line_2((l2(4)+4:l2(5)+3)));

    %Extracting coefficient from third line
    line_3 = fgetl(f1);
    l3 = strfind(line_3,'E');
    a11 = str2double(line_3(1:(l3(1)+3)));
    a12 = str2double(line_3((l3(1)+4:l3(2)+3)));
    a13 = str2double(line_3((l3(2)+4:l3(3)+3)));
    a14 = str2double(line_3((l3(3)+4:l3(4)+3)));

    %Creating folder for the species
    Spe_dir=pwd;
    mkdir(species_name);
    cd(species_name);

    T = linspace(local_low_temp,local_high_temp,400);
    mt = local_mid_temp;

    %Calling the thermodynamic equations function "coefficient"
    [Cp, H, S] = file_parsing_func(a1,a2,a3,a4,a5,a6,a7,a8,a9,a10,a11,a12,a13,a14,T,mt);

    %Plotting the curve
    %Curve between Temperature and Specific Heat
    figure(1)
    plot(T,Cp,'linewidth',3,'color','r');
    title(species_name);
    xlabel('Temperature[K]');
    ylabel('Specific Heat [J/mol-K]');
    grid on

    %Curve between Temperature and Enthalpy
    figure(2)
    plot(T,H,'linewidth',3,'color','b');
    title(species_name);
    xlabel('Temperature[K]');
    ylabel('Enthalpy [J/Kg]');
    grid on

    %Curve between Temperature and Entropy
    figure(3)
    plot(T,S,'linewidth',3,'color','g');
    title(species_name);
    xlabel('Temperature[K]');
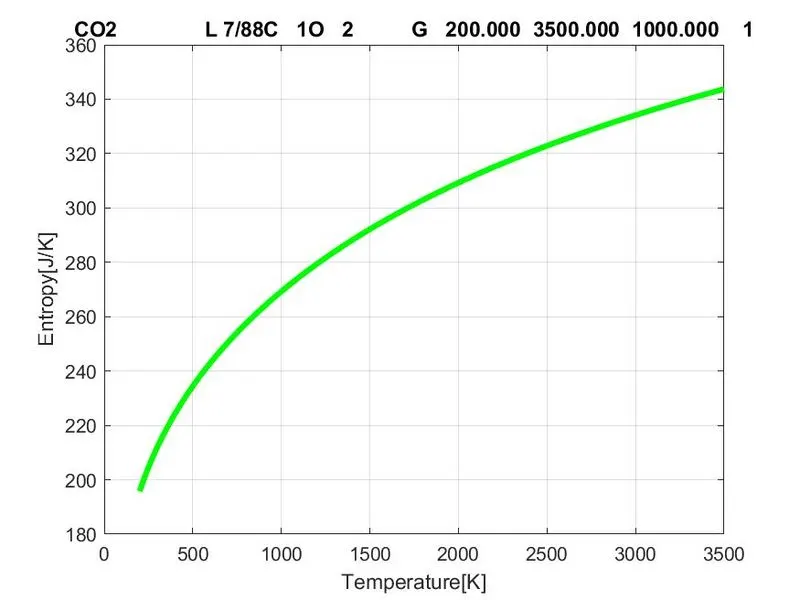
    ylabel('Entropy[J/K]');
    grid on

    %Saving the plot in jpg format
    saveas(figure(1),'Specific Heat.jpg');
    saveas(figure(2),'Enthalpy.jpg');
    saveas(figure(3),'Entropy.jpg');
    cd(Spe_dir);

    %Calculating the molecular mass
    elements=['H','C','O','N','A'];
    atomic_weight=[1 12 16 14 40];
    weight = 0;
    for l=1:length(species_name)
        for m=1:length(atomic_weight)
            if strcmp(species_name(l),elements(m))
                weight = weight + atomic_weight(m);
                position = m;
            end
        end

        n=str2double(species_name(l));
        if n>1
            weight=weight+atomic_weight(position)*(n-1);

        end
    end

    %Printing the molecular weight of different species in command window
    fprintf('molecular_weight of %s:- ',species_name)
    fprintf('%d amu n',weight)

end

fclose(f1);
Explaination:
clear all,close all and clc is used to remove datas ,clear the window and clear the command respectivley
To open the given file the command fopen is used, fgetl command is used to return to the next line of the specific file. removing the newline characters.since the first line is not required for this project, the global temperatures is stored in 3 variables 'global_min','global_max','global_mid'.
Then the array for the temperature is defined with contains 400 different set of values between the global min and global max. And for loop is made to ignore the 3 next commands in the file.
The temperature coefficients 53 species were defined using a for loop,strok is used to read the first character of the elements.
Strdouble command converts the text in str to double precision values ,str consists the real or complex number of the values.
After calculating the high-low temperatures coefficients the functions for specific heat,enthalphy and entropy are written and the plots are made in respective graphs and are also made such that they get stored in respective elements folder names.
the file is finally closed using the close command
Function Code:
%Function program to calculate Specific Heat, Enthalpy and Entropy
function [Cp, H, S] = file_parsing_func(a1,a2,a3,a4,a5,a6,a7,a8,a9,a10,a11,a12,a13,a14,T,mt)
R = 8.314;
%universal gas constant = R

for k = 1:length(T)
    if T(k)>mt

        %Specific Heat
        Cp = (a1 + a2.*T + a3.*T.^2 +a4.*T.^3 + a5.*T.^4).*R;

        %Enthalpy
        H = (a1 + a2.*T./2 + a3.*T.^2./3 + a4.*T.^3./4 + a5.*T.^4./5 + a6./T).*R.*T;

        %Entropy
        S = (a1.*log(T) + a2.*T + a3.*T.^2./2 + a4.*T.^3./3 + a5.*T.^4./4 + a7).*R;

    else

        %Specific Heat
        Cp = (a8 + a9.*T + a10.*T.^2 + a11.*T.^3 + a12.*T.^4).*R;

        %Entahlpy
        H = (a8 + a9.*T./2 + a10.*T.^2./3 + a11.*T.^3./4 + a12.*T.^4./5 + a13./T).*R.*T;

        %Entropy
        S = (a8.*log(T) + a9.*T + a10.*T.^2./2 + a11.*T.^3./3 + a12.*T.^4./4 + a14).*R;
    end
end
end
Outputs:
Plots of O2:
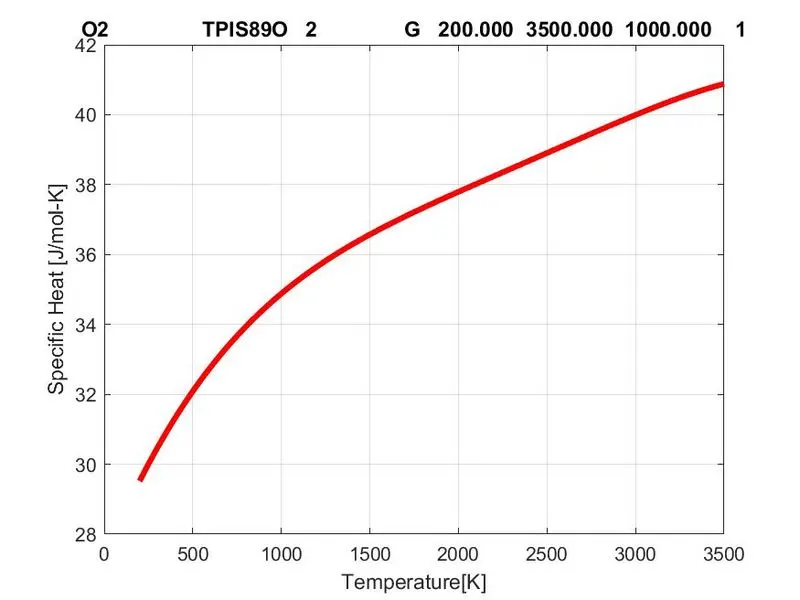
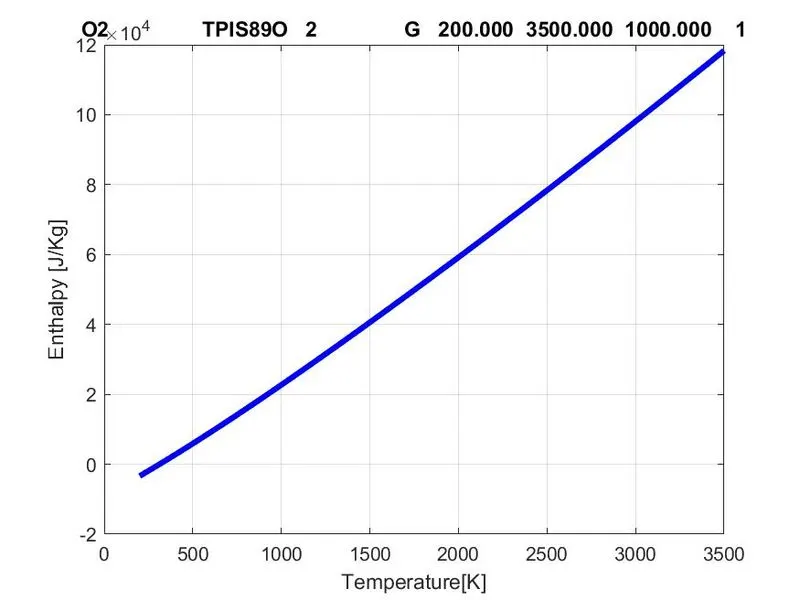
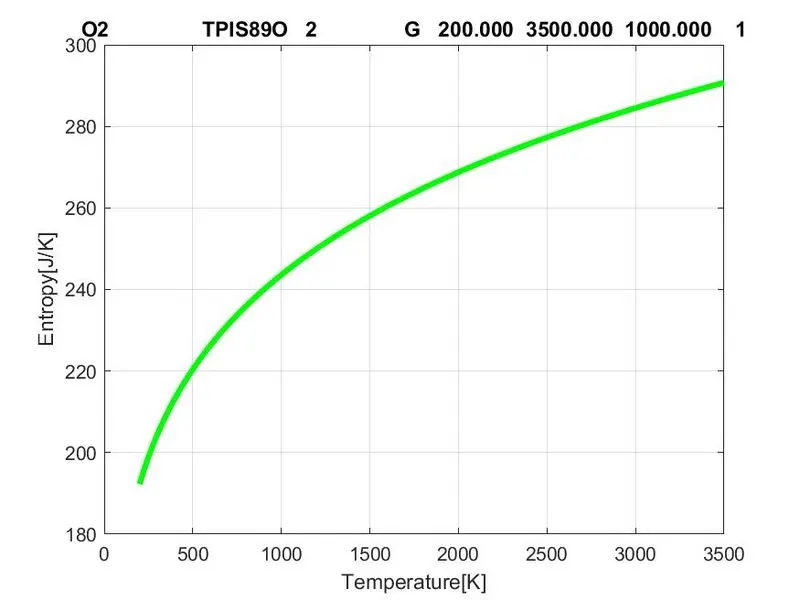
Plots for N2:
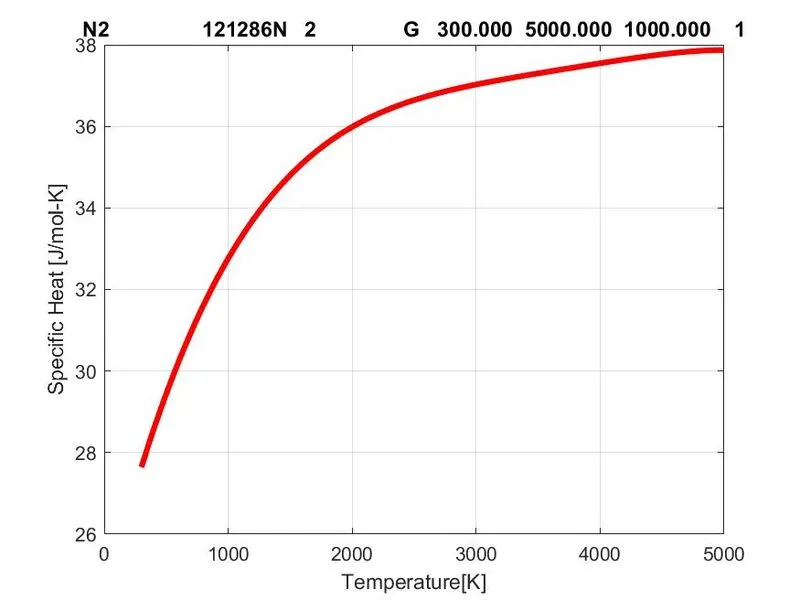
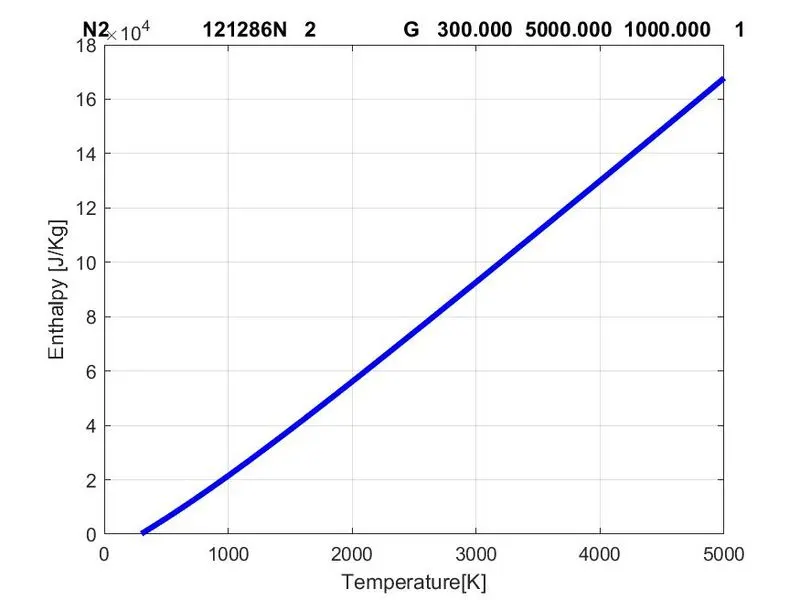
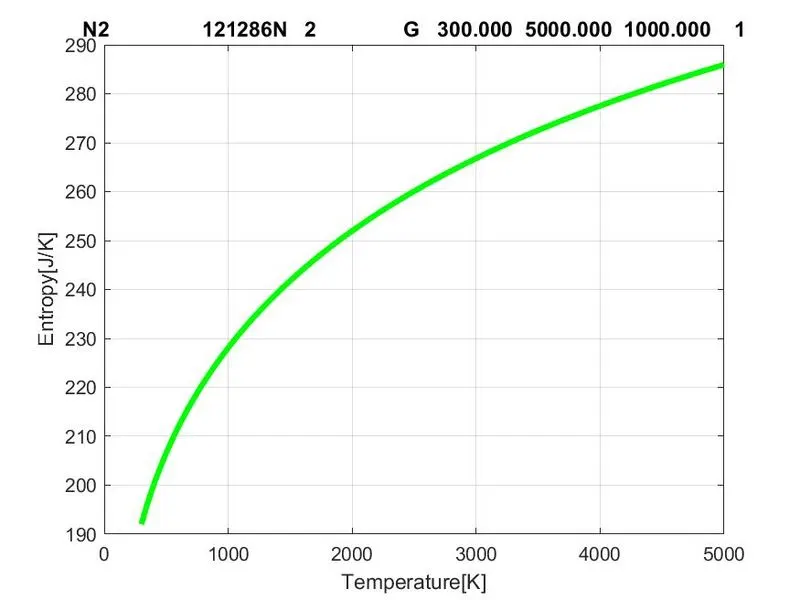
Plots for CO2:
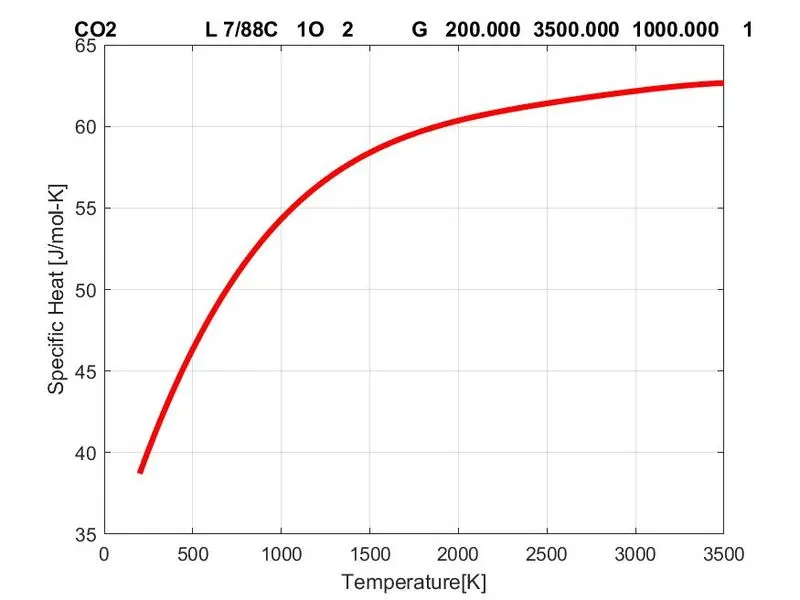
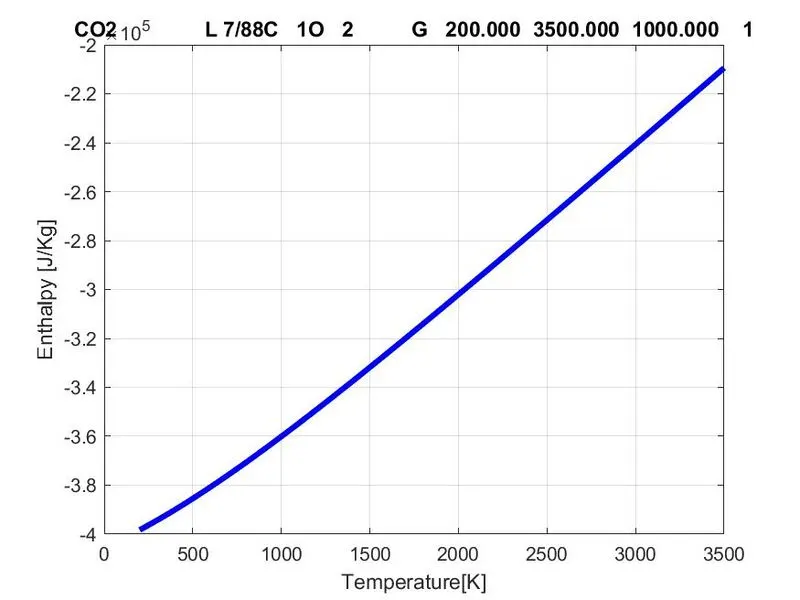
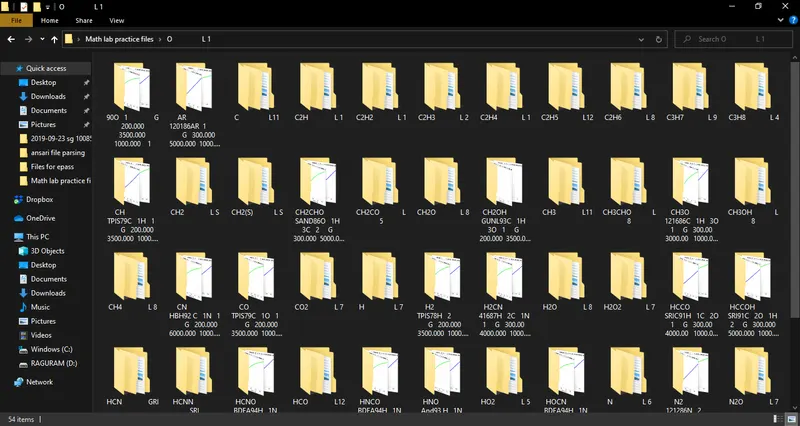
The below screenshot shows the folder of each species having plot of temprature vs heat,enthalphy and entropy saved in their respective names.
Conclusion:
Thus the file parsing of the NASA Thermodynamic data was done.Also the plot of temperature V/S Specific heat,enthalpy and entropy was obtained and plot saved in respective elements names and calculatede the molecular weights.
Errors obtained:
The MATLAB is case sensitive and therefore due to typing errors it showed many errors then it was rectified with further observations and references, the file saved were all the plots are saved accordingly but 2 folders are created (some are in single folders but some elements plot are created in folder in folders.
REFERENCE:
https://www.mathworks.com/matlabcentral/answers/497882-parsing-text-files-for-beginners
http://nptel.ac.in/courses/103106074/
https://en.wikipedia.org/wiki/Parsing