Project 1 - Parsing NASA thermodynamic data
Aim:
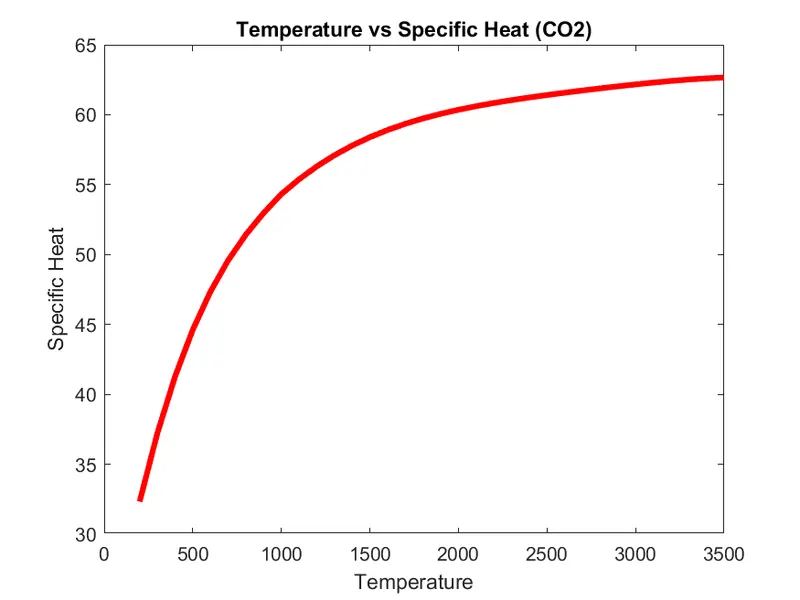
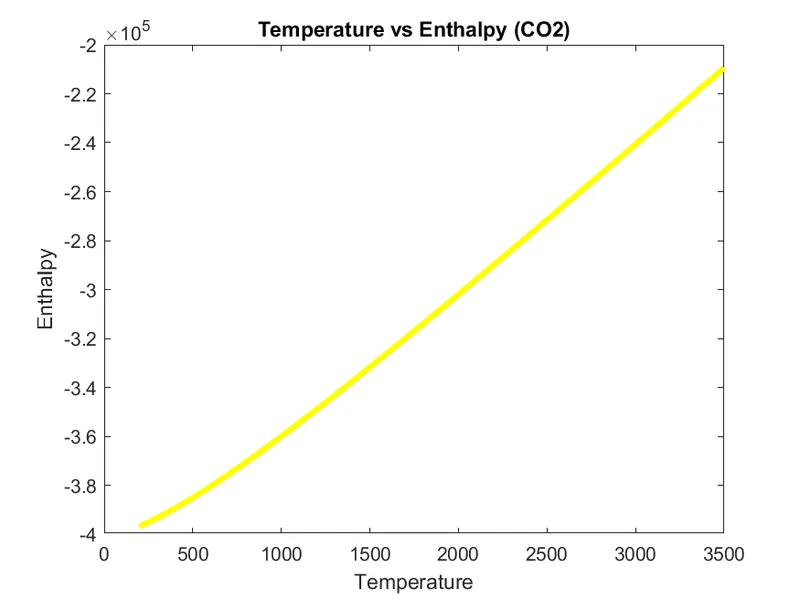
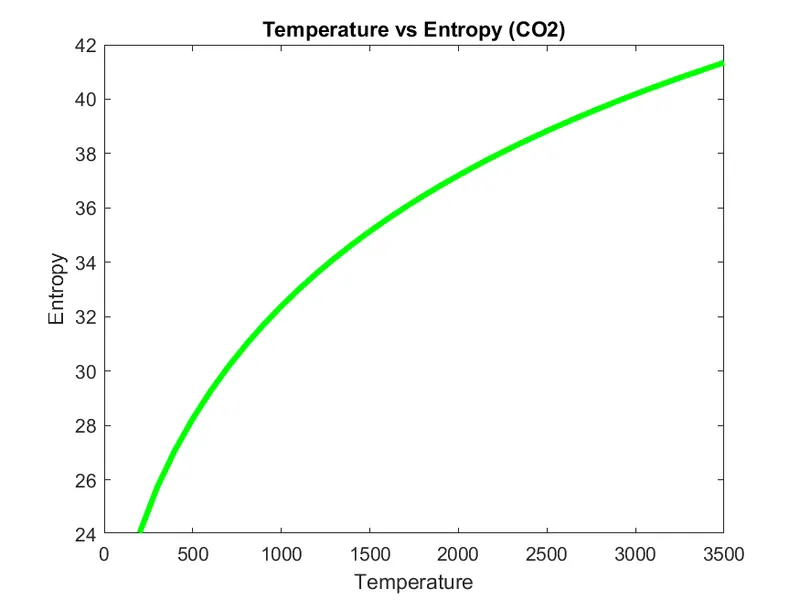
- To do the file parsing for the NASA thermodynamic data file, and to plot the Specific heat, Enthalpy, and Entropy of the given species.
Project Objectives:
- To read and extract data present in ‘THERMO.dat’ data file using File Parsing.
- To extract the 14 coefficients of the given 53 element species.
- To calculate Specific Heat, Enthalpy and Entropy using the extracted coefficients.
- To find the molecular weight of each species.
- To plot the Specific heat, Enthalpy and Entropy relations against range of local temperatures.
- To generate and save the plots for each species in appropriate directory.
Background:
File Parsing:
Parsing in computer languages refers to syntactic analysis of the input code into its components parts in order to facilitate the writing of compilers and interpreters. It can be used to describe split or separation.
Parsing a file means reading in a data stream of some sort and building in memory model of the semantic content of that data. This aims at facilitating performing some kind of transformation on the data.
Parsing means to make something understandable (by analyzing its parts). For programming this means to convert information represented in one form into another form that's easier to work with. This is done by partially analyzing the data, understanding its underlying structure (by making some assumptions based on what you're expecting to see), and then explicitly representing that structure in the code.
Introduction to Thermodynamic Coefficients:
NASA came up with polynomials that can be used to evaluate thermodynamic properties such as Cp, H and S. They have also documented the coefficients that are required to evaluate these polynomials for 1000+ species.
Governing equations:
Equations for finding Specific Heat (Cp), Enthalpy (H) and Entropy (S) are:

R = Universal gas constant = 8.314 J/M.K
T = Local temperature
In the set of NASA’S thermodynamic polynomials, there are total 14 coefficients for each species. The first 7 coefficients are high temperature coefficients and the next 7 coefficients are low-temperature coefficients.
Code:
clc
close all
clear all

%Getting global temperature range
f1 = fopen('THERMO.dat', 'r');  %Opens file to read ans assigns file handle
fgetl(f1);                      %Reads file line by line
global_temp_ranges = fgetl(f1);
global_temp_ranges = str2num(global_temp_ranges); %Converts format from string to number
global_low_temp = global_temp_ranges(1)
global_mid_temp = global_temp_ranges(2)
global_high_temp = global_temp_ranges(3)

%ignoring next 3 header lines
for i = 1:3
    fgetl(f1);
end


for i = 1:53

line1 = fgetl(f1);
a = strsplit(line1, ' ');  %Splits the line according to delimiter and stores each element in a cell
Species = a{1};            %Stores elements in 1st cell in variable 'Species'
local_low_temp = a{end-3}; %stores elements of 4th last cell
local_low_temp = str2num(local_low_temp);
local_med_temp = a{end-1};
local_med_temp = str2num(local_med_temp);
local_high_temp = a{end-2};
local_high_temp = str2num(local_high_temp);
%creating folder in directory
mkdir(Species)     %makes directory/folder with name 'Species'
cd(Species)        %sets current directory

%getting species data
%Getting coefficients
%a = hight temperature coefficients
%b = low temperature coefficients

%coefficients from line 2
line2 = fgetl(f1);
c = strfind(line2, 'E');  %Finds positions of 'E' in the line
a1 = line2(1:c(1)+3);
a1 = str2num(a1);
a2 = line2(c(1)+4:c(2)+3);
a2 = str2num(a2);
a3 = line2(c(2)+4:c(3)+3);
a3 = str2num(a3);
a4 = line2(c(3)+4:c(4)+3);
a4 = str2num(a4);
a5 = line2(c(4)+4:c(5)+3);
a5 = str2num(a5);

%coefficients from line 3
line3 = fgetl(f1);
c1 = strfind(line3, 'E');
a6 = line3(1:c1(1)+3);
a6 = str2num(a6);
a7 = line3(c1(1)+4:c1(2)+3);
a7 = str2num(a7);
b1 = line3(c1(2)+4:c1(3)+3);
b1 = str2num(b1);
b2 = line3(c1(3)+4:c1(4)+3);
b2 = str2num(b2);
b3 = line3(c1(4)+4:c1(5)+3);
b3 = str2num(b3);

%Coefficients from line 4
line4 = fgetl(f1);
c = strfind(line4, 'E');
b4 = line4(1:c(1)+3);
b4 = str2num(b4);
b5 = line4(c(1)+4:c(2)+3);
b5 = str2num(b5);
b6 = line4(c(2)+4:c(3)+3);
b6 = str2num(b6);
b7 = line4(c(3)+4:c(4)+3);
b7 = str2num(b7);

%calculating speific heat(Cp), enthalpy(H) and entropy(S)
R = 8.314;   %Universal gas constant
temp = linspace(local_low_temp,local_high_temp,34);  %store 34 temperature values in 'temp'
for t = 1:length(temp)
    if (temp(t) <= local_med_temp) %compares each value of 'temp'
        Cp(t) = (b1 + b2*temp(t) + b3*temp(t)^2 + b4*temp(t)^3 + b5*temp(t)^4)*R;
        H(t) = (b1 + b2*temp(t)/2 + b3*temp(t)^2/3 + b4*temp(t)^3/4 + b5*temp(t)^4/5 + b6/temp(t))*R*temp(t);
        S(t) = (b1*log(temp(t)) + b2*temp(t) + b3*temp(t)^2/2 + b4*temp(t)^3/3 + b5*temp(t)^4/4 + b7);
    else
       Cp(t) = (a1 + a2*temp(t) + a3*temp(t)^2 + a4*temp(t)^3 + a5*temp(t)^4)*R;
        H(t) = (a1 + a2*temp(t)/2 + a3*temp(t)^2/3 + a4*temp(t)^3/4 + a5*temp(t)^4/5 + a6/temp(t))*R*temp(t);
        S(t) = (a1*log(temp(t)) + a2*temp(t) + a3*temp(t)^2/2 + a4*temp(t)^3/3 + a5*temp(t)^4/4 + a7);
    end
end

%plotting Cp, H and S against temperature
figure(1)
plot(temp, Cp, 'linewidth', 3, 'color', 'r')
xlabel('Temperature')
ylabel('Specific Heat')
title(sprintf('Temperature vs Specific Heat (%s)', Species))

figure(2)
plot(temp, H, 'linewidth', 3, 'color', 'y')
xlabel('Temperature')
ylabel('Enthalpy')
title(sprintf('Temperature vs Enthalpy (%s)', Species))

figure(3)
plot(temp, S, 'linewidth', 3, 'color', 'g')
xlabel('Temperature')
ylabel('Entropy')
title(sprintf('Temperature vs Entropy (%s)',Species))

%% saving of species results
saveas(1,'Cpvs Temp.png')
saveas(2,'Enthalpy vs Temp.png')
saveas(3,'Entropy vs Temp.png')
cd ..

%%
%calculating molecular weight
atm_name = ['H' , 'C' , 'O' , 'N' , 'Ar'];

atm_weight = [1.008 12.011 16 14.007 39.948];

W=0;

for i=1:length(Species);
   for j=1:length(atm_name);
      if strcmp(Species(i),atm_name(j));
          W = W + atm_weight(j);
position = j;
      end

    end

n = str2num(Species(i));

if n>1;

W = W +atm_weight(position)*(n-1);

end

end
fprintf('Molecular Weight of %s : %f'  ,Species ,W);

end
Code Explanation:
The file and the code in which the file is used should be in the same folder. The 'THERMO.dat' file was opened using the ‘fopen’ command and to read the file, 'r' is used for reading the data in the file. This file will be stored in variable’f1’, which will act as a pointer to the file. ‘fgetl’ command is used to read the file line by line. We again use ‘fgetl’ command to read the second line and store it in variable ‘global_temp_ranges’. Then we use ‘str2num’ command which converts the format of extracted line from string to number. Each individual global temperatures are stored in respective variables. Next 3 lines are header lines which we don’t need. So, we use a ‘for loop’ to run ‘fgetl’ command for 3 times and hide its output. Now from next line onwards, each set of 4 lines contains data of individual species.
A ‘for loop’ is started for 53 species. ‘fgetl’ command is used to get 1st line of set which contains name and local temperatures. String split command is used to split the line using delimiter into individual data and store it in ‘cell’ format. Species name is stored by calling 1st cell. Accordingly, local temperatures are called, stored and converted to number format using ‘str2num’.
Then we create a folder/ make directory of species name using command ‘mkdir’ and set this as current directory using ‘cd’ command.
Coefficients starts from 2nd line of a set. Use ‘fgetl’ command to get the lines. Then we use ‘strfind’ command to find the location of every ’E’ in the line. Using this location, we are able to extract individual coefficients and then convert them from string to number format.
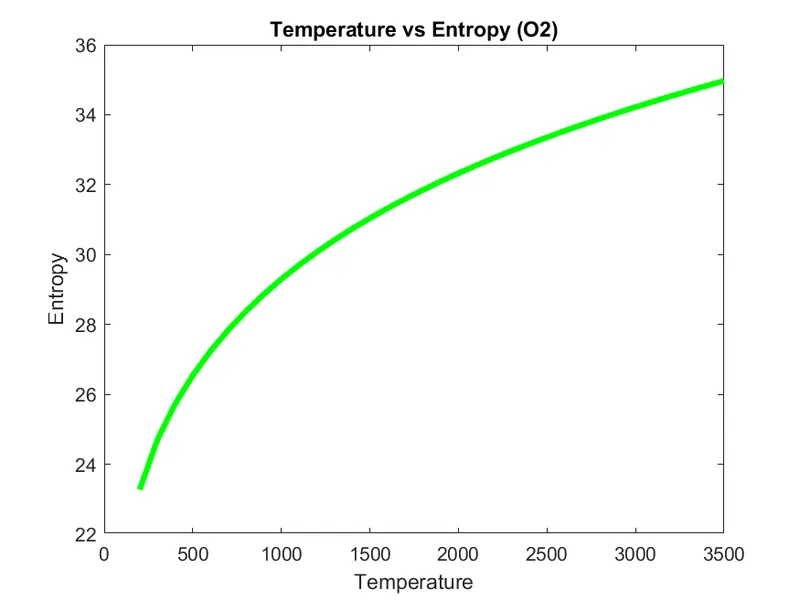
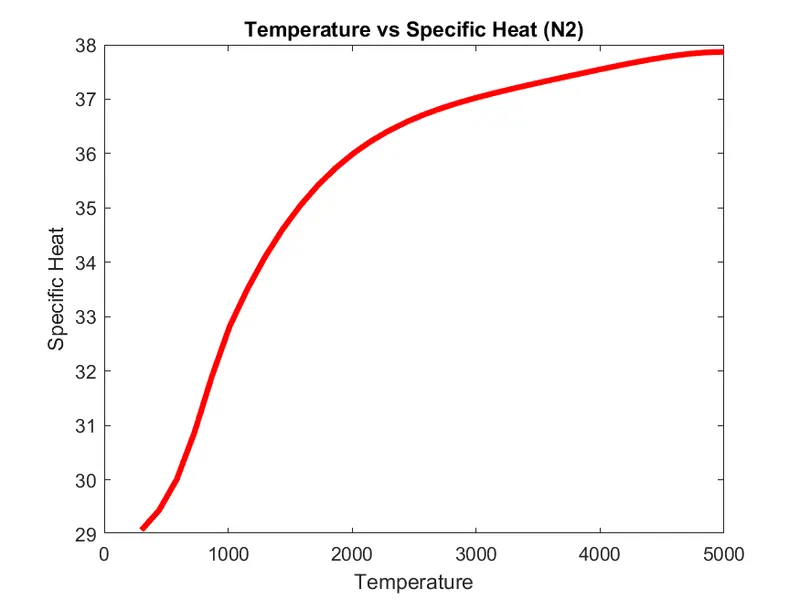
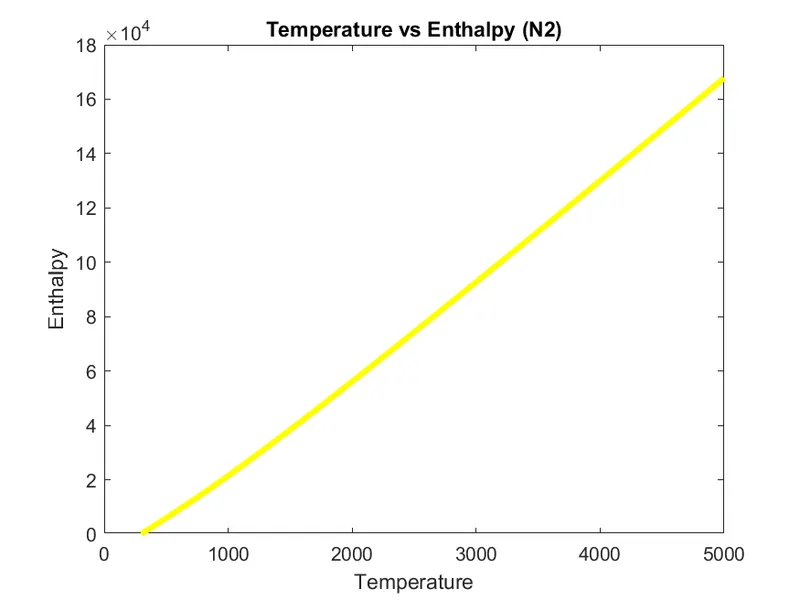
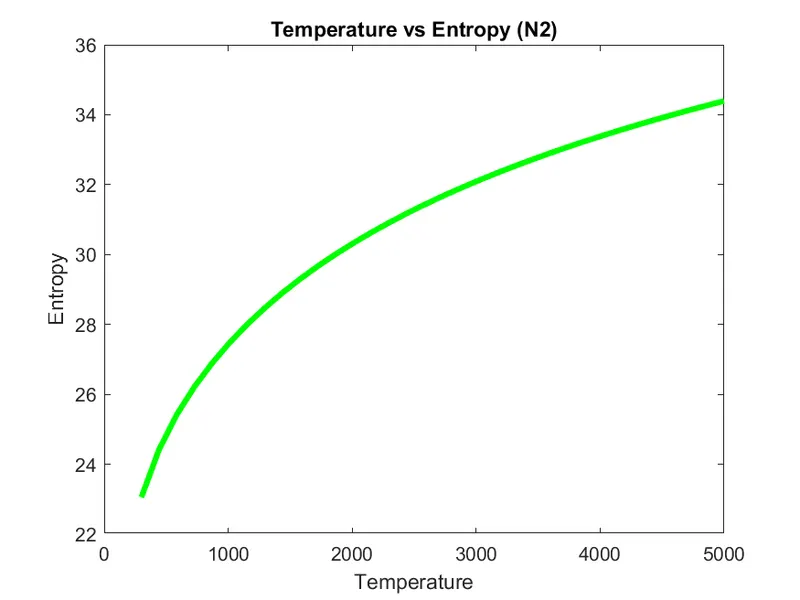
Now, we use ‘for loop’ to find values of Cp, H and S for each temperature from temperature range from low to high local temperatures. In order to using different coefficients for low and high temperatures, we use ‘if-else loop’. Using these values, 3 graphs are plotted for Cp, H and S against temperature. Each plot is saved using ‘saveas’ command giving respective name. Then acces of current directory is revoked using ‘cd . .’
To calculate molecular weight, we first store all primary elements names as a array in variable ‘atm_name’ and store the values of their atomic weights in respective order in variable ‘atm_weight’. Initial value of molecular weight is kept 0. Now for each primary element of a specimen, each primary element from ‘atm_name ‘array is compared using ‘strcmp’ command. If both occur same then, molecular weight is calculated as initial molecular weight plus atomic weight of matched specimen. If a specimen contains more than 1 primary element, atomic weight is further added (‘n-1’ number of times) to the previous value. In this way, atomic weight of each primary element in a specimen is added to get Molecular weight of the specimen. This value is printed in proper format using ‘sprintf’ command.
Screenshots:
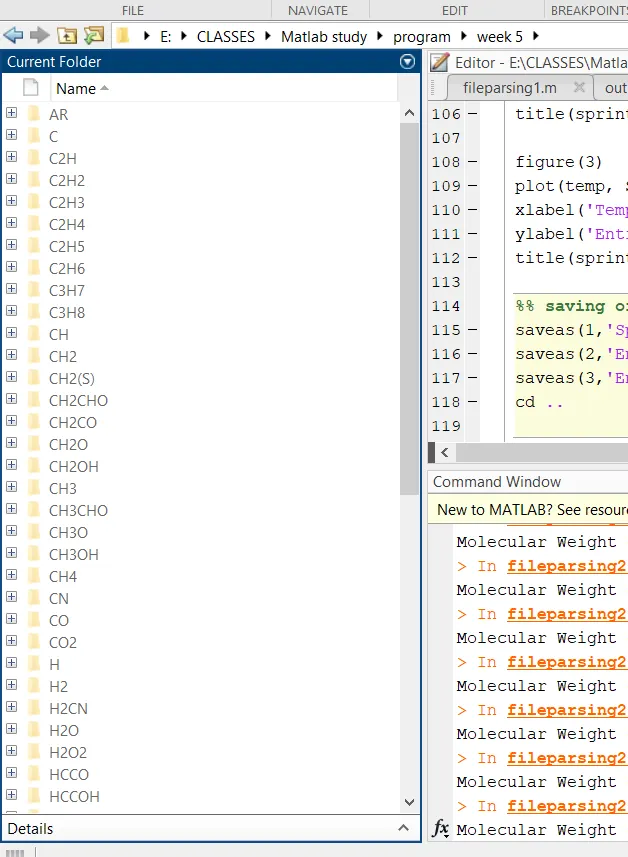
53 folders of all species are created.
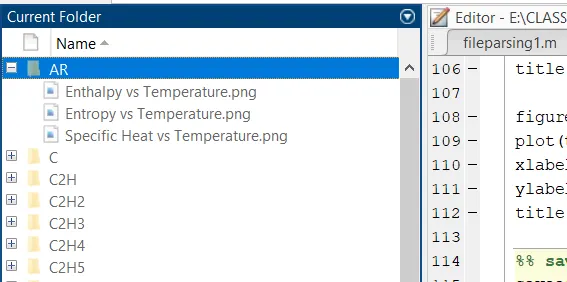
Each folder contains 3 plots.
Plots:
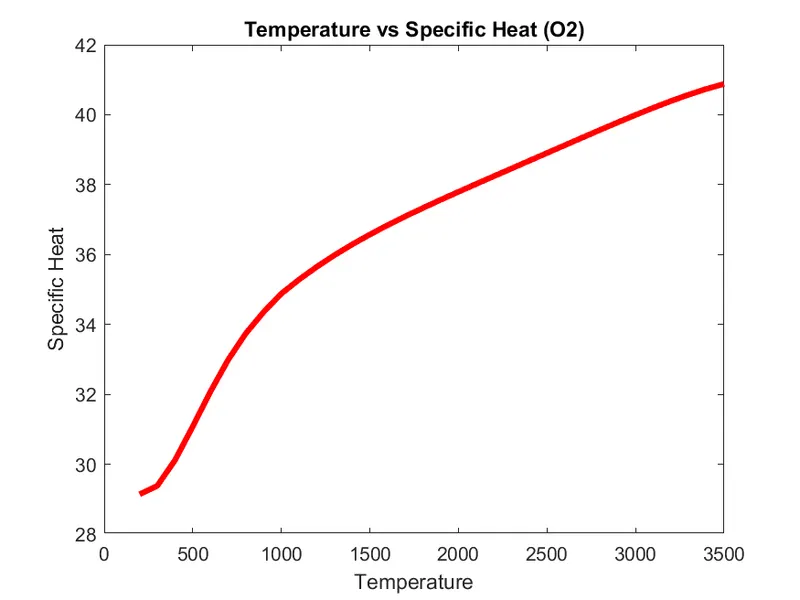
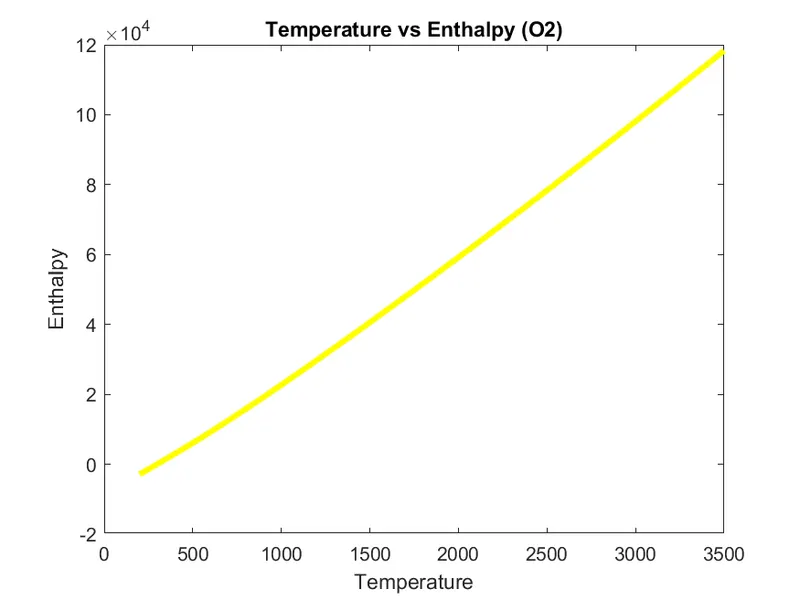
1) O2
2) N2
3) CO2
Conclusion:
- Proper file parsing of ‘THERMO.dat’ file is done using above code.
- Code can extract coefficients form file and use them to calculate Specific heat, Enthalpy and Entropy for each specimen.
- Code can calculate molecular weight of each specimen.
- Code can plot graphs of 3 properties for each specimen and store in the respective folder having species name.