Project 1 - Parsing NASA thermodynamic data
1) Main code for parsing the NASA data file, plotting graph:
%% To write a MATLAB code for parsing the NASA thermodynamic data file
% and to extract 14 coefficients of the equation for deriving thermodynamic
% properties like specific heat, entropy, and enthalpy.
%% Also to find the molecular mass of each species and to plot graphs of all thermodynamic properties with respect to temperature

%starting the program with clearing screen, and other temp files

clear all
close all
clc

%% After saving the data file in the directory, The required values are extracted

% By opening the document we can get the total lines in the document
num_lines = 218;

% The document file is opened with command fopen
File = fopen('thermo.dat')

% some variables are used to run the for loop
a = 1;
s = 1;

% The for loop is executed repeatedly for the total lines in the document

for i = 1: num_lines

    m = 1;

    % With the help of fgetl command we can get the values in the line and assign them to the variable
    % This command can be used to skip a line
    file_line = fgetl(File)

    % The starting letter of the line is compared with the if statement
    % If it starts with '!' mark then it is skipped and the loop is
    % performed once again to check the next line.
    if file_line(1) == '!'

    % The starting letter of the line is compared with if or elseif statement
    % If it starts with any of the given letter then the line is converted into char and
    % the with help of findstr commad ' ' is searched and the letters
    % before space is saved in a variable and again searches for '.' Dot,
    % any number before it is stored in a variable for obtaing species name
    % and their local temperature range
    elseif (file_line(1) =='C')||(file_line(1) =='H')||(file_line(1) =='A')

        file_line = char(file_line);
        spot_space = findstr(file_line,' ');
        text_req{a}= file_line(1:spot_space(1)-1);
        spot_dot = findstr(file_line,'.')

            for d = 1:length(spot_dot)

                data_1 = file_line(spot_dot(d)-4:spot_dot(d)+3);
                local_temp(s,m) = str2double(data_1);
                m = m+1;
            end

        s = s+1;
        a = a+1;

    % The starting letter of the line is compared with the if or elseif statement
    % If it starts with any of the given letters then the line is converted into char and
    % the with help of find command ' ' is searched and the letters
    % before space is saved in a variable and again searches for '.' Dot,
    % any number before it is stored in a variable for obtaining species name
    % and their local temperature range

    elseif (file_line(1) =='O')||(file_line(1) =='N')


        file_line = char(file_line);
        spot_space = findstr(file_line,' ');
        text_req{a}= file_line(1:spot_space(1)-1);
        spot_dot = findstr(file_line,'.')

            for d = 1:length(spot_dot)

                data_1 = file_line(spot_dot(d)-4:spot_dot(d)+3);
                local_temp(s,m) = str2double(data_1);
                m = m+1;
            end

        s = s+1;
        a = a+1;

    elseif (file_line(1) =='E')||(file_line(1) == 'T')

    % Other lines without any special character or alphabets are saved in a variable
    % To extract the coefficient values of each species.
    else
        t_line{i}= file_line

    end
end

%% The global temperature values are obtained from line two of the document

% The line two is split where the space are present,

temp_range = strsplit(t_line{2},' ')

% Each value are stored in different variables

low_temp = str2double(temp_range{2})
mid_temp = str2double(temp_range{3})
high_temp = str2double(temp_range{4})

%% Now 14 coefficients of each species are extracted and saved in a variable

% Variables for controling the for loop
a=7;
b=1;
c=1;

% For loop is used to extract the coefficient values in each line, stored
% in the variable t_line

for l = 1:length(text_req)

    for j = 1:3

        % The line is converted to charachter and saved in a variable
        temp = char(t_line(a))

        % The letter 'E' is searched in the line and their positions are
        % saved in a variable
        str = findstr(temp,'E')

        % By knowing the positions of the letter E in the line
        % 11 characters before the letter 'E' and 3 characters after it is stored in a variable
        % This is done by the for loop below
        for k = 1:length(str)

            temp_coeff = temp(str(k)-11:str(k)+3);

            temp_coeff = str2num(temp_coeff);

            coeff(c,b) = temp_coeff
            b = b+1;
        end

        a = a+1;
    end
    a = a+1;
    c = c+1;
    b = 1;
end

%% After obtaining all the data from the document, we move to calculate the required thermodynamic values

% Variables for controlling the for loop
a = 1;
b = 1;

% The document is closed with fclose command
fclose(File);

% New document is created and opened with write access to store the
% the molecular mass of each species

file_open = fopen('Molecular_weight.txt','w');
fprintf(file_open,'\nMolecular weight of species\n\n');

for i = 1:length(text_req)

    % With the saved local temperature of each species we can get the
    % required temperature range
    T = linspace(local_temp(i,1),local_temp(i,2),50);

    % This function is used calculate the Specific heat, Enthaphy, Entrophy
    % values of all the species, with 14 coefficients and temperature values as inputs
    [Cp,H,S] = thermodynamic_fun(coeff(a,b),coeff(a,b+1),coeff(a,b+2),coeff(a,b+3),coeff(a,b+4),coeff(a,b+5),coeff(a,b+6),coeff(a,b+7),coeff(a,b+8),coeff(a,b+9),coeff(a,b+10),coeff(a,b+11),coeff(a,b+12),coeff(a,b+13),T,local_temp(i,3));

    a = a+1;

    % The species names are converted to string and saved in a variable
    text_req_1 = char(text_req(i))

    % The molecular wieght is calculated by calling the molec_wt function
    % with species name as input
    molecular_weight = molec_wt(text_req_1);

    % The value form the molecular weight function is saved in the text
    % document with fprintf command
    fprintf(file_open,'Molecular weight of %s is %f g/mol\n\n',text_req_1,molecular_weight);

    % This if statement is used to create a folder only if not existed in the
    % required species name if already existed then this part is skipped
    if ~exist('E:\STUDIES\Octave_projects\NASA\SPECIES', 'dir')

        % Folder does not exist so create it.
         mkdir('E:\STUDIES\Octave_projects\NASA\SPECIES',text_req_1)
    end

    % After creating the folder it is opend wth cd command
    path =(['E:\STUDIES\Octave_projects\NASA\SPECIES\',text_req_1]);
    cd(path)

    % This figure is saved in the opened folder of given species
    % Graph for Specific heat vs Temperature is plotted and molecular
    % weight values of the species are displayed in the title block

    figure(1)

    plot(T,Cp,'color','b','linewidth',2)
    xlabel('Temperature (K)')
    ylabel('Specific Heat (J/K Kg)')
    grid on
    title({'Specific Heat vs Temperature',['Species name = ',text_req_1,' & Molecular Weight = ',num2str(molecular_weight)]});
    saveas(figure(1),'Cp VS Temp.png')

    % This figure is saved in the opened folder of given species
    % Graph for Enthalpy vs Temperature is plotted and molecular
    % weight values of the species are displayed in the title block

    figure(2)

    plot(T,H,'color','r','linewidth',2)
    xlabel('Temperature (K)')
    ylabel('Enthalpy (J/K)')
    grid on
    title({'Enthalpy vs Temperature',['Species name = ',text_req_1,' & Molecular Weight = ',num2str(molecular_weight)]});
    saveas(figure(2),'Enthalpy VS Temp.png')

    % This figure is saved in the opened folder of given species
    % Graph for Entropy vs Temperature is plotted and molecular
    % weight values of the species are displayed in the title block
    figure(3)

    plot(T,S,'color','g','linewidth',2)
    xlabel('Temperature (K)')
    ylabel('Entropy (J/K)')
    grid on
    title({'Entropy vs Temperature',['Species name = ',text_req_1,' & Molecular Weight = ',num2str(molecular_weight)]});
    saveas(figure(3),'Entropy VS Temp.png')

    % Now the folder containing our code is opened
    prev_folder = cd('E:\STUDIES\Octave_projects\NASA')

end

% Finally the word document containing the molecular weight data is saved
% and closed
fclose(file_open);
2) Function for calculating the Specific heat, Enthalpy, and Entropy:
function [Cp1,H1,S1] = thermodynamic_fun(a1,a2,a3,a4,a5,a6,a7,a8,a9,a10,a11,a12,a13,a14,t,range)

    % R stands for Universal gas constant
    R = 8.314;

    for j = 1:length(t)

    % If the t(j) is mentioned as t, the graph will be totally different
    % Where range is the temperature at middle below which the else
    % statement will be executed
    if t(j) > range

        % Equation for finding the Specific heat of the species
        Cp1 = (a1 + (a2.*t) + (a3.*(t.^2)) + (a4.*(t.^3)) + (a5.*(t.^4)))*R;

        % Equation for finding the Enthalpy of the species
        H1 = (a1 + (a2.*t)/2 +(a3.*(t.^2))/3 +(a4.*(t.^3))/4 +(a5.*(t.^4))/5+ (a6./t))*R.*t;

        % Equation for finding the Entropy of the species
        S1 = (a1.*log(t) + a2.*t + (a3.*(t.^2))/2 + (a4.*(t.^3))/3 + (a5.*(t.^4))/4+ a7)*R;

    else

        % Equation for finding the Specific heat of the species
        Cp1 = (a8 + (a9.*t) + (a10.*(t.^2)) + (a11.*(t.^3)) + (a12.*(t.^4)))*R;

        % Equation for finding the Enthalpy of the species
        H1 = (a8 + (a9.*t)/2 +(a10.*(t.^2))/3 +(a11.*(t.^3))/4 +(a12.*(t.^4))/5+ (a13./t))*R.*t;

        % Equation for finding the Entropy of the species
        S1 = (a8.*log(t) + a9.*t + (a10.*(t.^2))/2 + (a11.*(t.^3))/3 + (a12.*(t.^4))/4+ a14)*R;

    end

    end

end
3) Function for calculation molecular mass of the given species:
function mole = molec_wt(species_name)

% Assigning the values for variables to compare them with species name
elements = ['H','C','O','N','A','S'];

% Atomic weight of each element is saved in order
atomic_weight = [1.0079 12.0107 15.999 14.0067 39.948 32.065]

% Variable to obtain the molecular mass
mole = 0;

% For loop for obtaining the molecular mass
for e = 1:length(species_name)

    for f = 1:length(elements)

        % The string is compared species name, if both character matches
        % then required atomic mass is added to the variable mole
        if strcmp(species_name(e),elements(f))

            mole = mole + atomic_weight(f);

            %The position value is stored in a variable
            %If any number comes in the species name the if statement will
            %fail and with the help of this position number we can add the
            %atomic number of the particular element as per the number
            pos = f;
        end
    end

    % Now the species name is converted to number format
    n =str2double(species_name(e));

    % In case to ignore any other special character other than the number we use this line
    if n>1

        %with the help of the number in that position, we can add the
        %atomic number of the particular element as much as the number
        mole = mole + atomic_weight(pos)*(n-1);
    end
end
Errors faced while code execution:
1) In the function for calculating the thermodynamic values, If t(j) is mentioned as t in the if statement, the graph will be totally different.
There was no major error other than this error.
Advantage of this code:
In this program, each value of Cp, species name are stored in a variable. So with this advantage, we can even check those values with the text document.
Result:
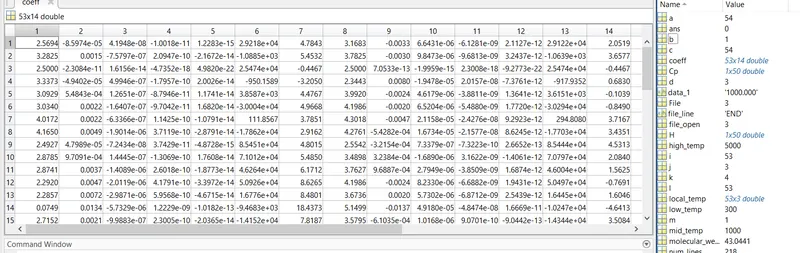
Successfully the NASA data file is parsed and the required graph of the Specific heat, Enthalpy, and entropy values are plotted.
The molecular mass of all 53 elements is saved in a separate text document.