Project 1 - Parsing NASA thermodynamic data
AIM
Parsing the NASA Thermodynamic Data.
OBJECTIVE
- A function that extracts the 14 coefficients and calculates the enthalpy,entropy and specific heats for all the species in the data file.
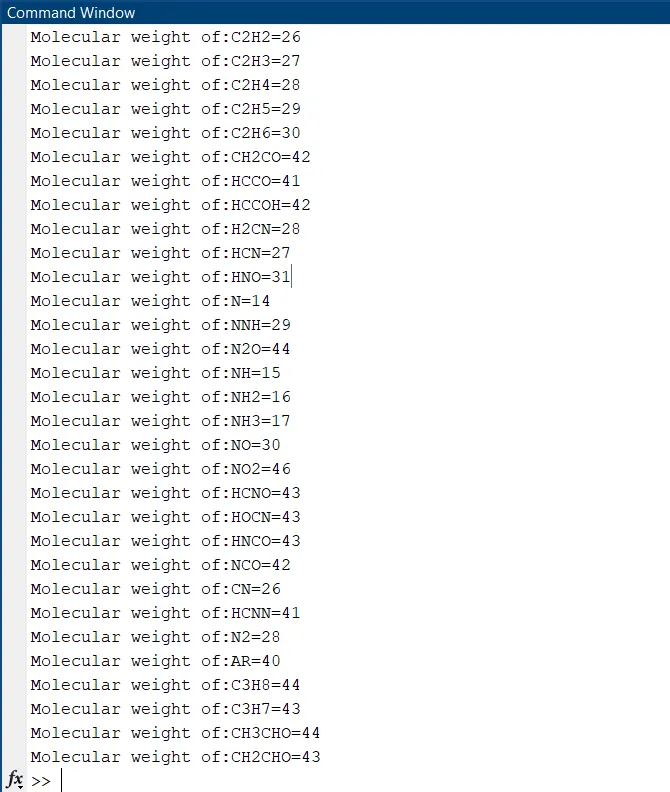
- Calculate the Molecular weight of each species and display it in the command window.
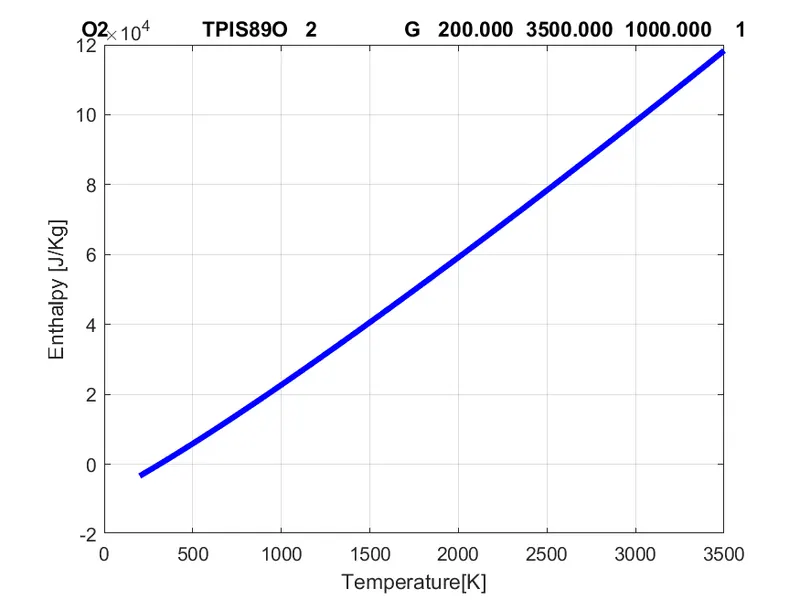
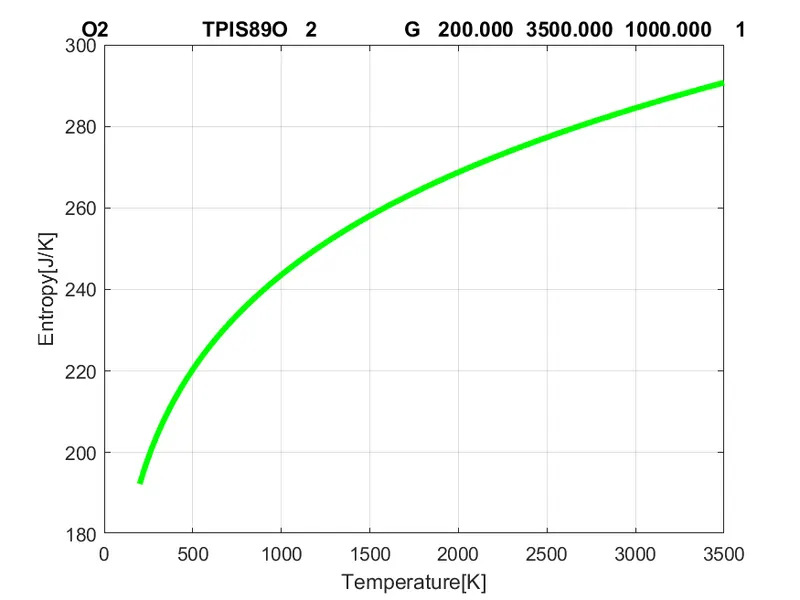
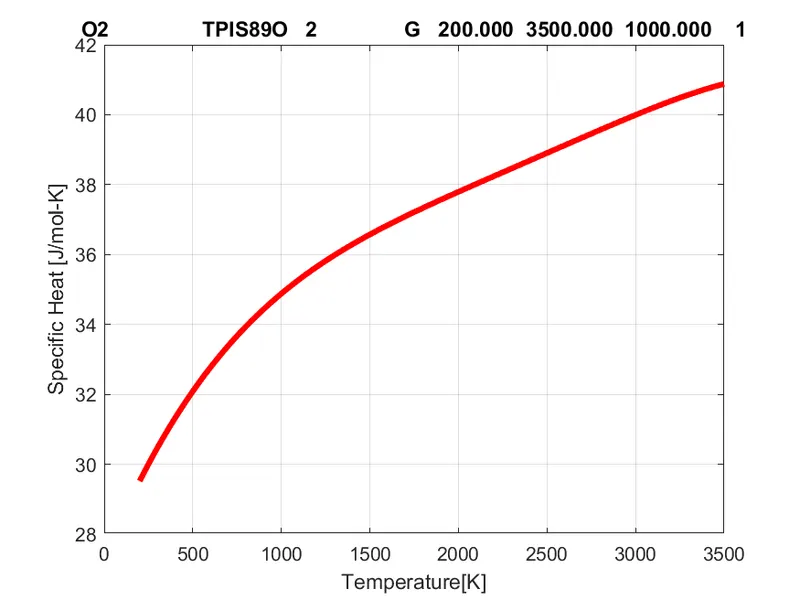
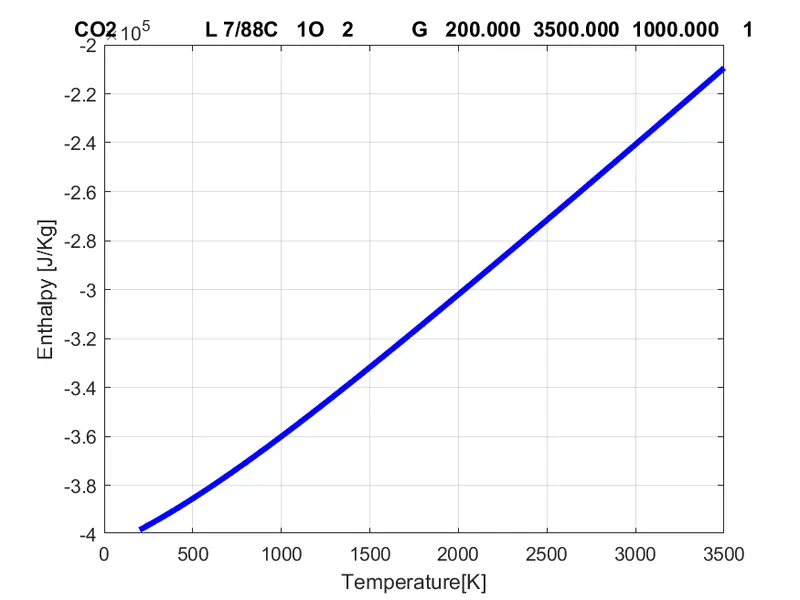
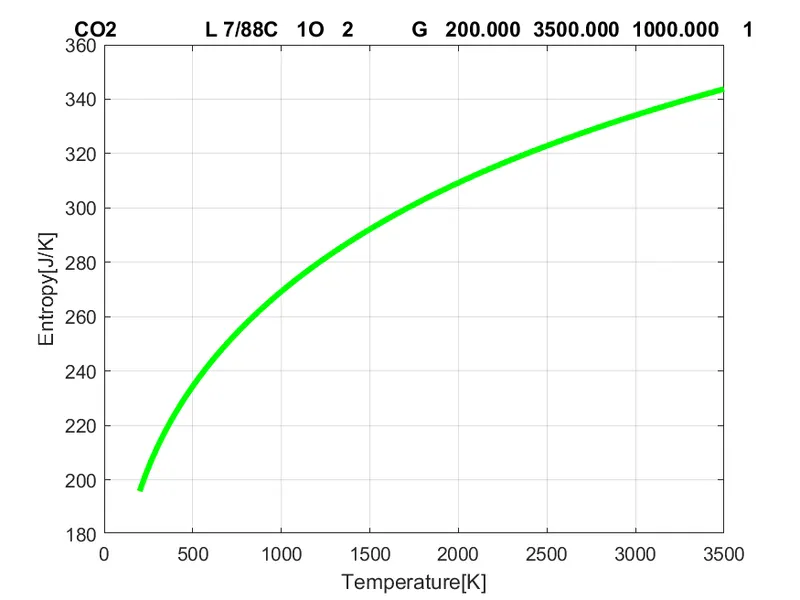
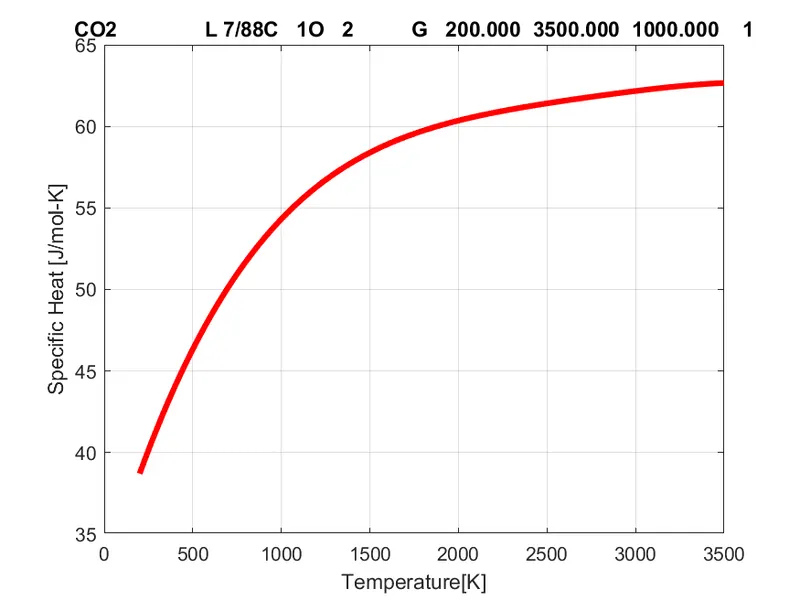
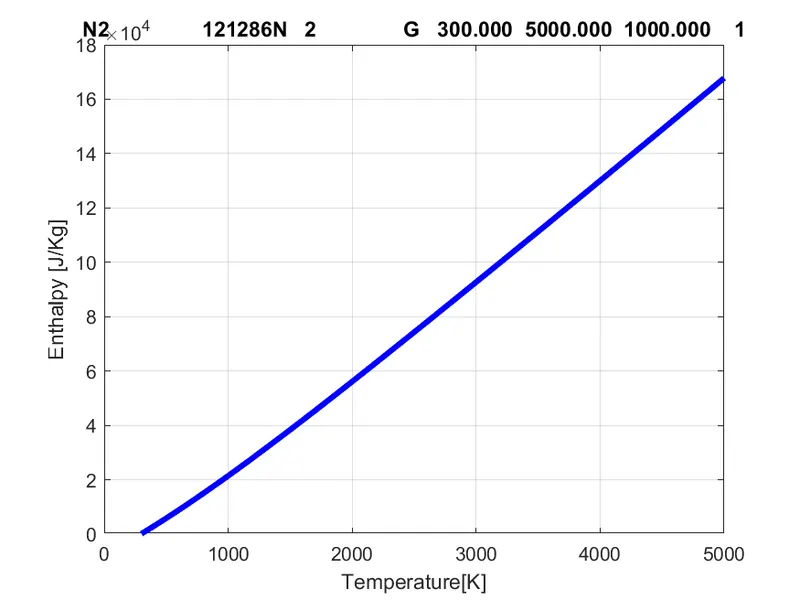
- Plot the Cp, Enthalpy and Entropy for the local temperature range (low temperature : high temperature) specific for each species.
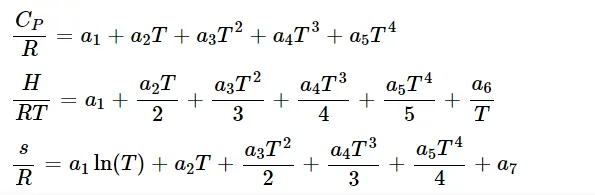
FORMULAS USED
INTRODUCTION
*Effect of temperature on specific heat
Specific heat is a measure of the ability of the substance to absorb heat.
The heat goes first into increasing the kinetic energies of the molecules.
Molecules can also store energy in vibrations and rotations. These energies are quantized.
For example, the O-H bonds in water can stretch and bend, and the whole molecule can rotate about its x,y, and z axes.
At low temperatures, collisions do not provide enough energy to get out of the ground states for rotation or vibration.
The average energy increases only from translation.
As the substance heats up, the average kinetic energy of the molecules increases.
The collisions impart enough energy to allow rotation to occur.
Rotation then contributes to the internal energy and raises the specific heat.
The vibrational energy states are farther apart then the rotation energy states.
Vibration does not jump out of the ground state until high temperatures (~1000k)
It then contributes to specific heat.
*Effect of temperature on Enthalpy
When a process occurs at constant pressure, the heat evolved (either released or absorbed) is equal to the change in enthalpy. Enthalpy (H">H) is the sum of the internal energy (U">U) and the product of pressure and volume (PV">PV) given by the equation(1)H=U+PV">
(1)H=U+PV">H=U+PV....(1)
When a process occurs at constant pressure, the heat evolved (either released or absorbed) is equal to the change in enthalpy. Enthalpy is a state function which depends entirely on the state functions T">T, P">P and U">U. Enthalpy is usually expressed as the change in enthalpy (ΔH">ΔH) for a process between initial and final states:
If temperature and pressure remain constant through the process and the work is limited to pressure-volume work, then the enthalpy change is given by the equation:
Also at constant pressure the heat flow (q">q) for the process is equal to the change in enthalpy defined by the equation:
When the temperature increases, the amount of molecular interactions also increases. When the number of interactions increase, then the internal energy of the system rises. According to the first equation given, if the internal energy (U">U) increases then the ΔH">ΔH increases as temperature rises. We can use the equation for heat capacity and Equation 2 to derive this relationship.
C=q/ΔT....(5)
Under constant pressure, substitute Equation:
Cp=(ΔH/ΔT)P....(6)
where the subscript P">P indicates the derivative is done under constant pressure.
*Effect of temperature on Entropy
Entropy is a measure of the Random activity in a system.The Entropy of a system depends on your observations at one moment.
When we say random, we mean energy that can't be used for any work,
The formula (delta)S = (delta)Q /(delta)T. "S" is the entropy value, "Q" is the measure of heat, and "T" is the temperature of the system measured in Kelvin degrees.
Several factors affect the amount of entropy in a system. If you increase temperature, you increase entropy.
(1) More energy put into a system excites the molecules and the amount of random activity.
(2) As a gas expands in a system, entropy increases. This one is also easy to visualize. If an atom has more space to bounce around, it will bounce more. Gases and plasmas have large amounts of entropy when compared to liquids and solids.
(3) When a solid becomes a liquid, its entropy increases.
(4) When a liquid becomes a gas, its entropy increases. We just talked about this idea. If you give atoms more room to move around, they will move. You can also think about it in terms of energy put into a system. If you add energy to a solid, it can become a liquid. Liquids have more energy and entropy than solids.
(5) Any chemical reaction that increases the number of gas molecules also increases entropy. A chemical reaction that increases the number of gas molecules would be a reaction that pours energy into a system. More energy gives you greater entropy and randomness of the atoms.
MATLAB PROGRAMME
clear all
close all
clc

f1=fopen('THERMO.dat','r');
file_name = fgetl(f1);
tline_1 = fgetl(f1);
A=strsplit(tline_1,' ');

%Geting the value of global temperature
global_low_temp = str2double(A{2});
global_mid_temp = str2double(A{3});
global_high_temp = str2double(A{4});

%Getting comments from thermo file
for i = 1:3
    comments = fgetl(f1);
end

for j = 1:53

    %getting species name
    tline_2 = fgetl(f1);
    s = strsplit(tline_2,'');
    species_name = s{1};
    A=strfind(tline_2,'G');
    temp_values=tline_2(A+4:length(tline_2));
    B=strsplit(temp_values,' ');

    %Getting the value of the local temp of different species
    local_low_temp = str2double(B{1});
    local_high_temp = str2double(B{2});
    local_mid_temp = str2double(B{3});

    %Extracting coefficient from first line
    line_1 = fgetl(f1);
    l1 = findstr(line_1,'E');
    a1 = str2double(line_1(1:(l1(1)+3)));
    a2 = str2double(line_1((l1(1)+4:l1(2)+3)));
    a3 = str2double(line_1((l1(2)+4:l1(3)+3)));
    a4 = str2double(line_1((l1(3)+4:l1(4)+3)));
    a5 = str2double(line_1((l1(4)+4:l1(5)+3)));

    %Extracting coefficient from second line
    line_2 = fgetl(f1);
    l2 = findstr(line_2,'E');
    a6 = str2double(line_2(1:(l2(1)+3)));
    a7 = str2double(line_2((l2(1)+4:l2(2)+3)));
    a8 = str2double(line_2((l2(2)+4:l2(3)+3)));
    a9 = str2double(line_2((l2(3)+4:l2(4)+3)));
    a10 = str2double(line_2((l2(4)+4:l2(5)+3)));

    %Extracting coefficient from third line
    line_3 = fgetl(f1);
    l3 = findstr(line_3,'E');
    a11 = str2double(line_3(1:(l3(1)+3)));
    a12 = str2double(line_3((l3(1)+4:l3(2)+3)));
    a13 = str2double(line_3((l3(2)+4:l3(3)+3)));
    a14 = str2double(line_3((l3(3)+4:l3(4)+3)));

    %Creating folder for the species
    Spe_dir=pwd;
    mkdir(species_name);
    cd(species_name);

    T = linspace(local_low_temp,local_high_temp,100);
    mt = local_mid_temp;

    %Calling the thermodynamic equations function "coefficient"
    [Cp, H, S] = file_parsing_func_1(a1,a2,a3,a4,a5,a6,a7,a8,a9,a10,a11,a12,a13,a14,T,mt);

    %Plotting the curve
    %Curve between Temperature and Specific Heat
    figure(1)
    plot(T,Cp,'linewidth',3,'color','r');
    title(species_name);
    xlabel('Temperature[K]');
    ylabel('Specific Heat [J/mol-K]');
    grid on

    %Curve between Temperature and Enthalpy
    figure(2)
    plot(T,H,'linewidth',3,'color','b');
    title(species_name);
    xlabel('Temperature[K]');
    ylabel('Enthalpy [J/Kg]');
    grid on

    %Curve between Temperature and Entropy
    figure(3)
    plot(T,S,'linewidth',3,'color','g');
    title(species_name);
    xlabel('Temperature[K]');
    ylabel('Entropy[J/K]');
    grid on

    %Saving the plot in jpg format
    saveas(figure(1),'Specific Heat.png');
    saveas(figure(2),'Enthalpy.png');
    saveas(figure(3),'Entropy.png');
    cd(Spe_dir);

    %Calculating the molecular mass
    elements=['H','C','O','N','A'];
    atomic_weight=[1 12 16 14 40];
    weight = 0;
    for l=1:length(species_name)
        for m=1:length(atomic_weight)
            if strcmp(species_name(l),elements(m))
                weight = weight + atomic_weight(m);
                position = m;
            end
        end

        n=str2double(species_name(l));
        if n>1
            weight=weight+atomic_weight(position)*(n-1);

        end
    end

    %Printing the molecular weight of different species in command window
    fprintf('molecular_weight of %s:- ',species_name)
    fprintf('%d amu n',weight)

end

fclose(f1);
%Function program to calculate Specific Heat, Enthalpy and Entropy
function [Cp, H, S] = file_parsing_func_1(a1,a2,a3,a4,a5,a6,a7,a8,a9,a10,a11,a12,a13,a14,T,mt)
R = 8.314;
for k = 1:length(T)
if T(k)>mt
%Specific Heat
Cp = (a1 + a2.*T + a3.*T.^2 +a4.*T.^3 + a5.*T.^4).*R;
%Enthalpy
H = (a1 + a2.*T./2 + a3.*T.^2./3 + a4.*T.^3./4 + a5.*T.^4./5 + a6./T).*R.*T;
%Entropy
S = (a1.*log(T) + a2.*T + a3.*T.^2./2 + a4.*T.^3./3 + a5.*T.^4./4 + a7).*R;
else
%Specific Heat
Cp = (a8 + a9.*T + a10.*T.^2 + a11.*T.^3 + a12.*T.^4).*R;
%Entahlpy
H = (a8 + a9.*T./2 + a10.*T.^2./3 + a11.*T.^3./4 + a12.*T.^4./5 + a13./T).*R.*T;
%Entropy
S = (a8.*log(T) + a9.*T + a10.*T.^2./2 + a11.*T.^3./3 + a12.*T.^4./4 + a14).*R;
end
end
endAs the file ‘THERMO.dat’ contains 5 lines of comments in which the 2nd line is the global temperatures.
Firstly opening the file through ‘fopen’ command and than reading the 1st header info and saving the global temperatures(in form of numbers) as well as the comments (in a cell array).
The temperatures are splitted using the command ‘strsplit’. And then converting it into a number using command ‘str2num’ and storing each value into a particular variable.
(Note: while converting the cell array to number array curly braces{} are used as cell is a special type of array which can hold both number as well as string, therefore {} are used to get the access inside the content of the cell array)
- Storing the remaining data into a cell array and dividing them accordance with the need.
- Extracting the coefficients from every line generated.
clear all
close all
clc

f1=fopen('THERMO.dat','r');
file_name = fgetl(f1);
tline_1 = fgetl(f1);
A=strsplit(tline_1,' ');

%Geting the value of global temperature
global_low_temp = str2double(A{2});
global_mid_temp = str2double(A{3});
global_high_temp = str2double(A{4});

%Getting comments from thermo file
for i = 1:3
    comments = fgetl(f1);
end

for j = 1:53

    %getting species name
    tline_2 = fgetl(f1);
    s = strsplit(tline_2,'');
    species_name = s{1};
    A=strfind(tline_2,'G');
    temp_values=tline_2(A+4:length(tline_2));
    B=strsplit(temp_values,' ');

    %Getting the value of the local temp of different species
    local_low_temp = str2double(B{1});
    local_high_temp = str2double(B{2});
    local_mid_temp = str2double(B{3});

    %Extracting coefficient from first line
    line_1 = fgetl(f1);
    l1 = findstr(line_1,'E');
    a1 = str2double(line_1(1:(l1(1)+3)));
    a2 = str2double(line_1((l1(1)+4:l1(2)+3)));
    a3 = str2double(line_1((l1(2)+4:l1(3)+3)));
    a4 = str2double(line_1((l1(3)+4:l1(4)+3)));
    a5 = str2double(line_1((l1(4)+4:l1(5)+3)));

    %Extracting coefficient from second line
    line_2 = fgetl(f1);
    l2 = findstr(line_2,'E');
    a6 = str2double(line_2(1:(l2(1)+3)));
    a7 = str2double(line_2((l2(1)+4:l2(2)+3)));
    a8 = str2double(line_2((l2(2)+4:l2(3)+3)));
    a9 = str2double(line_2((l2(3)+4:l2(4)+3)));
    a10 = str2double(line_2((l2(4)+4:l2(5)+3)));

    %Extracting coefficient from third line
    line_3 = fgetl(f1);
    l3 = findstr(line_3,'E');
    a11 = str2double(line_3(1:(l3(1)+3)));
    a12 = str2double(line_3((l3(1)+4:l3(2)+3)));
    a13 = str2double(line_3((l3(2)+4:l3(3)+3)));
    a14 = str2double(line_3((l3(3)+4:l3(4)+3)));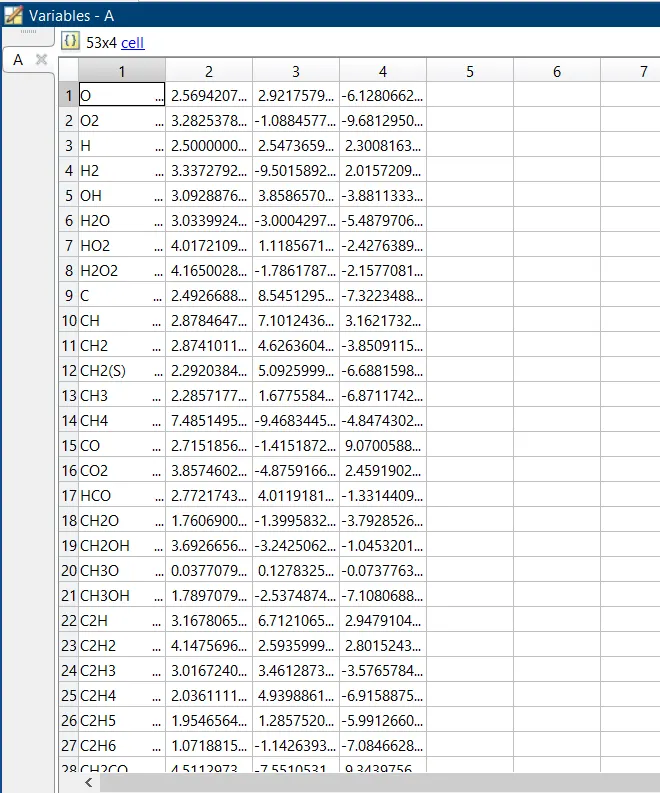
Form the above figure it is seen that each row represents the information of every different species.
Now saving the coefficients and species in a different array’s and utilizing these values to evaluate the name of the species, local temperatures as well as the coefficients values.
(Note: for convenience, the cell array is converted into a char array using the command ‘char’.)
In this 1st splitting the species array in such a way to extract the local temperatures and then splitting it to get the name of the species and lastly separating each line of every species into three different variables.
With the use of the local_tmp variable extracting the temperatures.
Firstly, converting the cell array into the character array.
As every line has character ‘E’ in it. Using it as a flag to access the right and left hand side of the string.
(Note: ‘strfind’ command is used to find the character inside a string and it can only find the value one row at a time, value of a is also same for each and every line therefore utilizing the value of a of line 1 only for every other line)
Therefore, once the position of ‘E’ is been searched using it to split the string and converting them into numbers using str2dobule (for more precision) and at each iteration the coefficients of one species is been calculated.
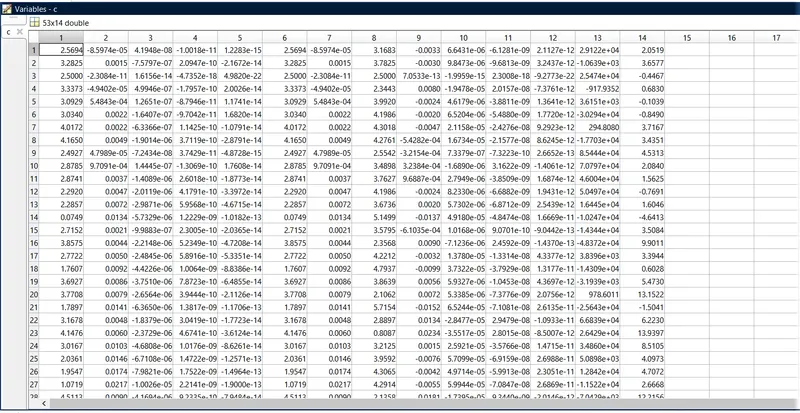
At last aligning the coefficients in a way such that every row represents all 14 coefficients of each species as shown below.
- Calculating the values of Cp, H and S and plotting graph and saving it into a folder named by species.
%Function program to calculate Specific Heat, Enthalpy and Entropy
function [Cp, H, S] = file_parsing_func(a1,a2,a3,a4,a5,a6,a7,a8,a9,a10,a11,a12,a13,a14,T,mt)
R = 8.314;
for k = 1:length(T)
    if T(k)>mt

        %Specific Heat
        Cp = (a1 + a2.*T + a3.*T.^2 +a4.*T.^3 + a5.*T.^4).*R;
        %Enthalpy
        H = (a1 + a2.*T./2 + a3.*T.^2./3 + a4.*T.^3./4 + a5.*T.^4./5 + a6./T).*R.*T;
        %Entropy
        S = (a1.*log(T) + a2.*T + a3.*T.^2./2 + a4.*T.^3./3 + a5.*T.^4./4 + a7).*R;

    else

        %Specific Heat
        Cp = (a8 + a9.*T + a10.*T.^2 + a11.*T.^3 + a12.*T.^4).*R;
        %Entahlpy
        H = (a8 + a9.*T./2 + a10.*T.^2./3 + a11.*T.^3./4 + a12.*T.^4./5 + a13./T).*R.*T;
        %Entropy
        S = (a8.*log(T) + a9.*T + a10.*T.^2./2 + a11.*T.^3./3 + a12.*T.^4./4 + a14).*R;
    end
end
end
    %Creating folder for the species
    Spe_dir=pwd;
    mkdir(species_name);
    cd(species_name);

    T = linspace(local_low_temp,local_high_temp,100);
    mt = local_mid_temp;

    %Calling the thermodynamic equations function "coefficient"
    [Cp, H, S] = file_parsing_func_1(a1,a2,a3,a4,a5,a6,a7,a8,a9,a10,a11,a12,a13,a14,T,mt);

    %Plotting the curve
    %Curve between Temperature and Specific Heat
    figure(1)
    plot(T,Cp,'linewidth',3,'color','r');
    title(species_name);
    xlabel('Temperature[K]');
    ylabel('Specific Heat [J/mol-K]');
    grid on

    %Curve between Temperature and Enthalpy
    figure(2)
    plot(T,H,'linewidth',3,'color','b');
    title(species_name);
    xlabel('Temperature[K]');
    ylabel('Enthalpy [J/Kg]');
    grid on

    %Curve between Temperature and Entropy
    figure(3)
    plot(T,S,'linewidth',3,'color','g');
    title(species_name);
    xlabel('Temperature[K]');
    ylabel('Entropy[J/K]');
    grid on

    %Saving the plot in jpg format
    saveas(figure(1),'Specific Heat.png');
    saveas(figure(2),'Enthalpy.png');
    saveas(figure(3),'Entropy.png');
    cd(Spe_dir);
As using the formulas for Cp, H and S evaluating its values for the local range of temperatures with the given conditions (1st seven coefficients for higher temp and last 7 coefficients for lower temp).
And then using the basic plot command, the main aim was to save the three plots of each species with the folder named by that species.
With the use of sprint command and the Species array assigning the name of folder and then for making the folder using the command ‘mkdir’ and ‘fullfile’ command is used to direct the picture into the folder created as well as to give name to the picture.
At last using the command ‘saveas’ to save the figure generated into .png form. Same procedure is being applied to all other three graphs.
The result generated is shown below:


- Calculating the value of molecular weight
 %Calculating the molecular mass
    elements=['H','C','O','N','A'];
    atomic_weight=[1 12 16 14 40];
    weight = 0
    for l=1:length(species_name)
        for m=1:length(atomic_weight)
            if strcmp(species_name(l),elements(m))
                weight = weight + atomic_weight(m);
                position = m;
            end
        end

        n=str2double(species_name(l));
        if n>1
            weight=weight+atomic_weight(position)*(n-1);

        end
    end
To explain the concept used over here, let Us take an example first.
Suppose we need to calculate the molecular weight of ‘CH4’
We know the atomic weight of ‘C’ and ‘H’.
We will use those values to calculate the molecular weight.
- Getting the no. of characters inside that string and then comparing each character with all the basic elements and if it is found than assigning the value of atomic weight to it.
- It means each character will be searched according to no. of elements in there.
- Now is the case if the character is a no. itself than we have to add that character atm weight value the no. of times the no. which has been there inside the string.
- In our case as it is CH4, the above statement implies that molecular Weight of CH4=C+H+H+H+H
- Now the length of string was 3 means it will give us the value of CH2 and 2 values will get remained, over here what we need to do is to whatever the value is inside the string we need to subtract it by 2 and multiply it with the previous character value and add it to the original weight.
- As the no. should not iterate the times of elements present, we use ‘break’ to end the inner loop once the value is being calculated.
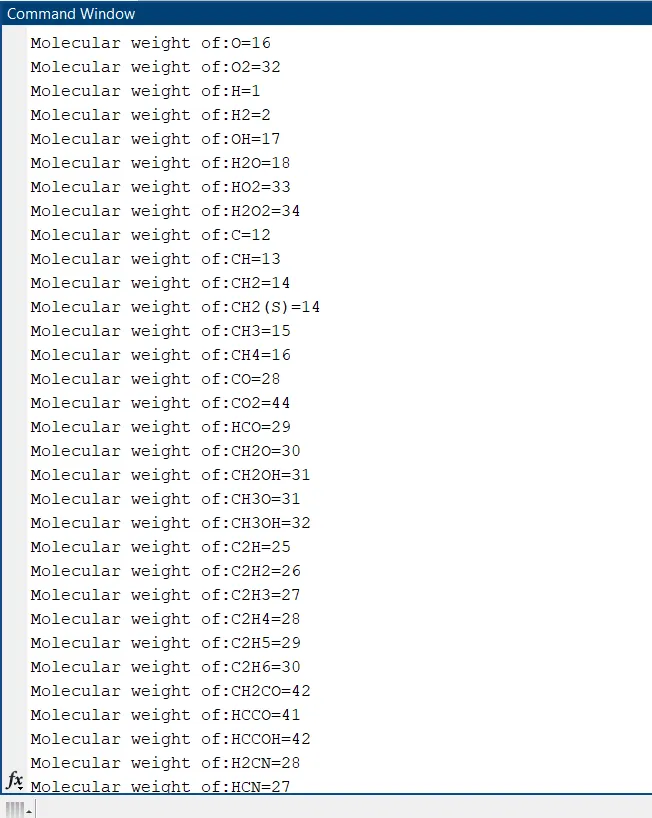
- This is how values of each and every species will be calculated and results are shown below.
PLOTS
1) O2
2) CO2
3) N2
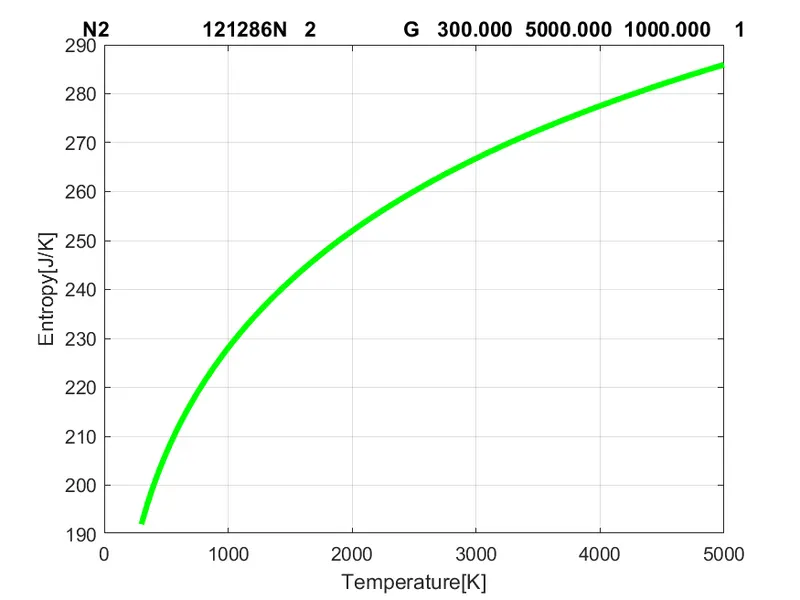
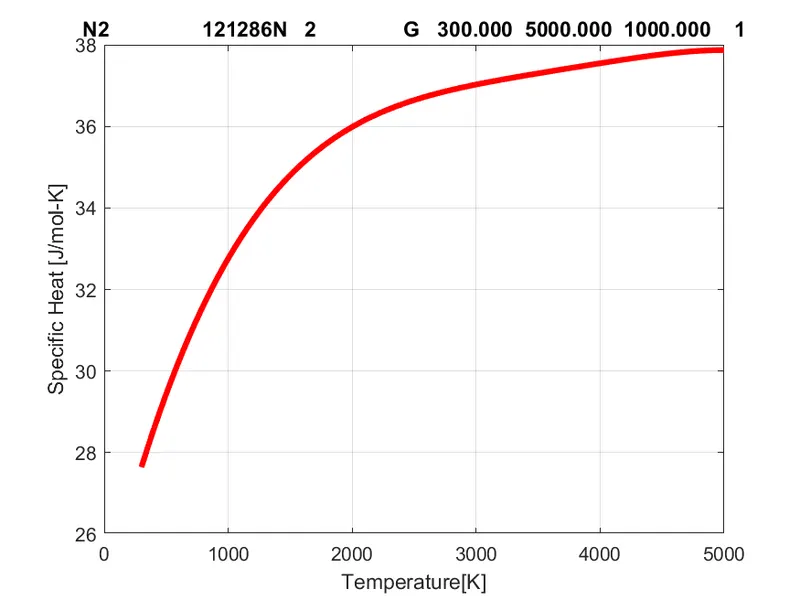
CONCLUSION
The graphs of specific heat , entropy and enthalpy has been plotted with the use of ‘THERMO.dat’ file and molecular weight has also being calculated.