Project 1 - Parsing NASA thermodynamic data
AIM:
Write a code in Matlab to parse the NASA thermodynamic data file and then calculate thermodynamic properties of various gas species.
OBJECTIVE: Is to
* Write a function that extracts the 14 co-efficients and calculates the enthalpy, entropy and specific heats for all the species in the data file.
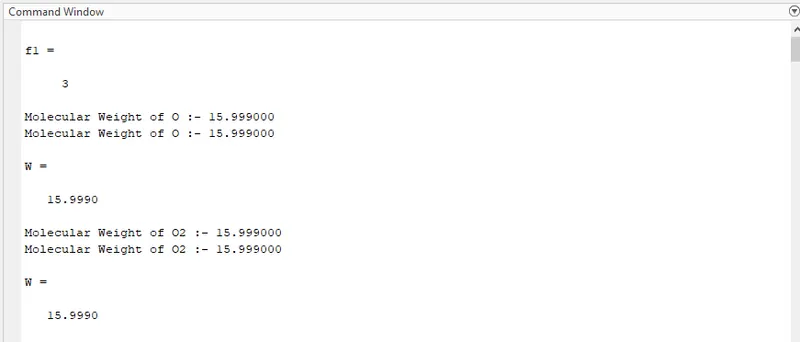
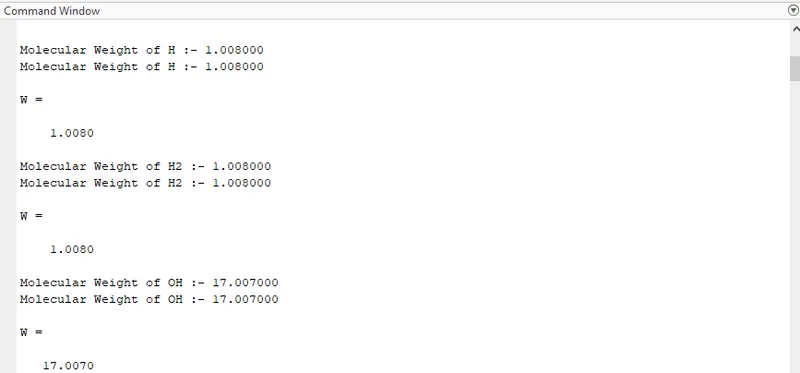
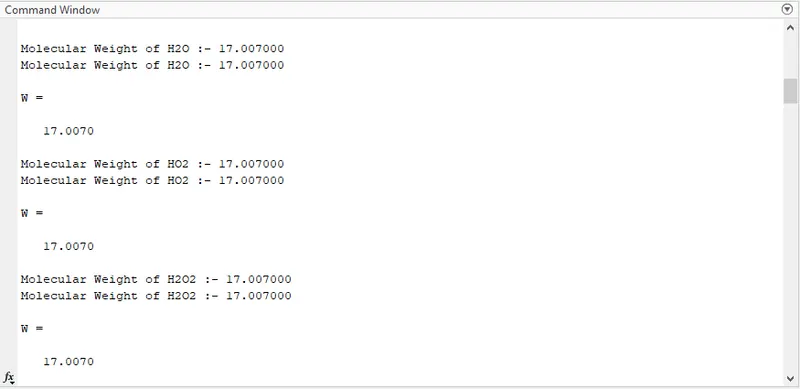
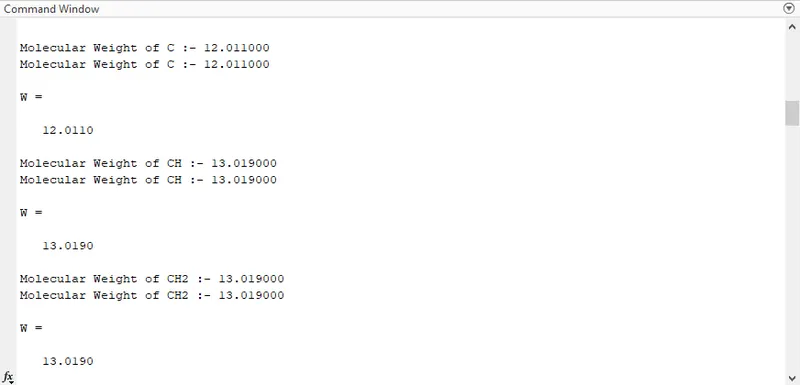
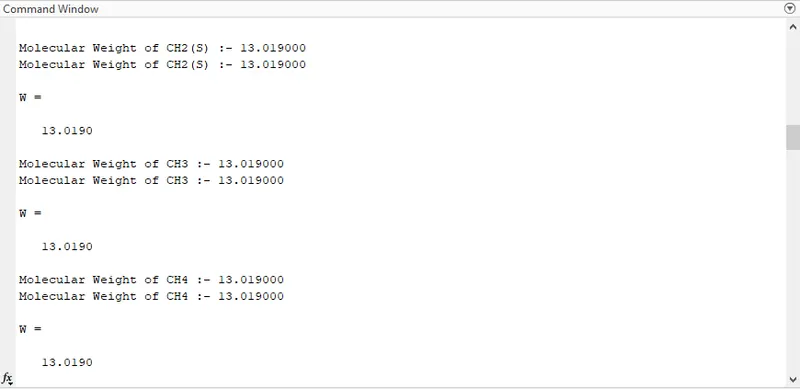
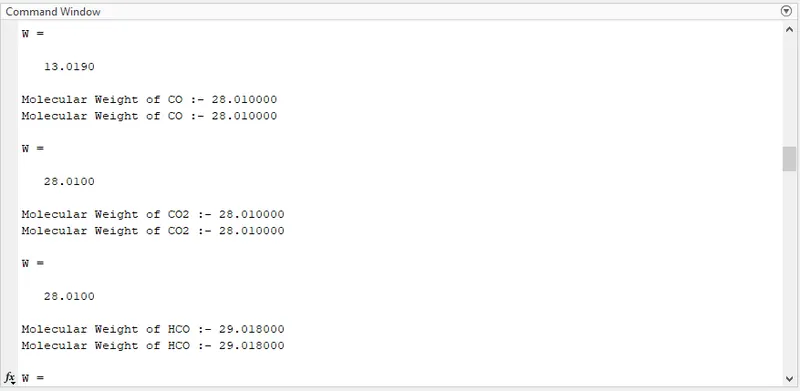
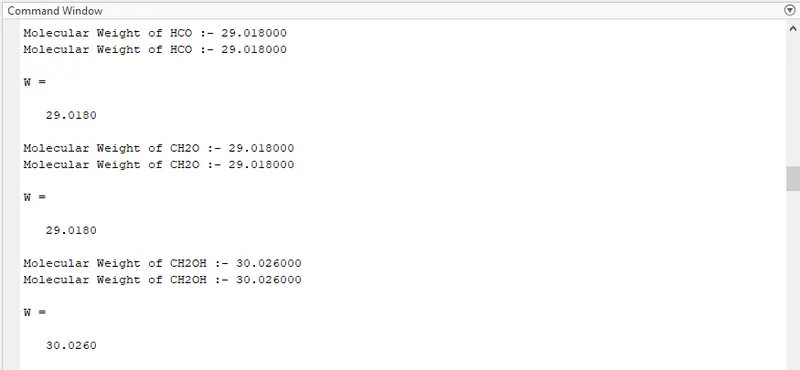
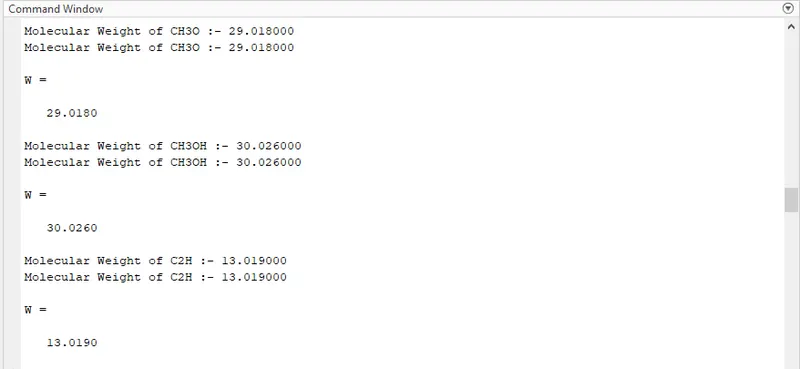
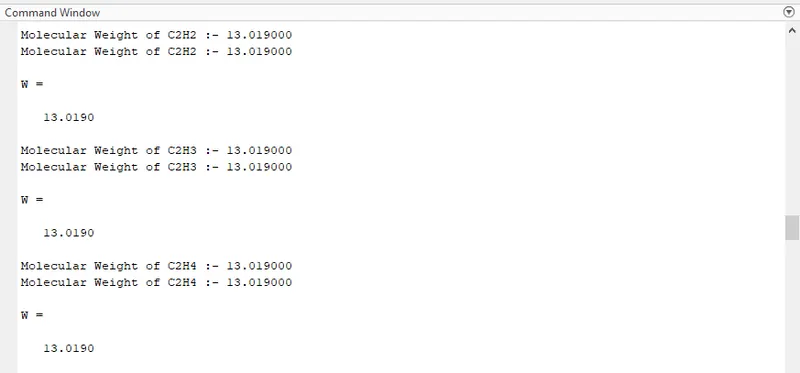
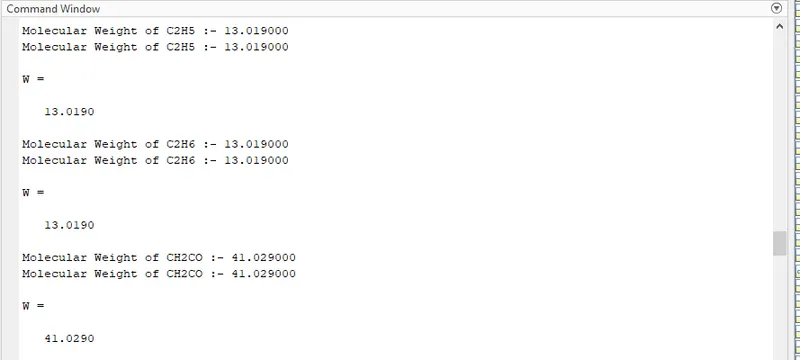
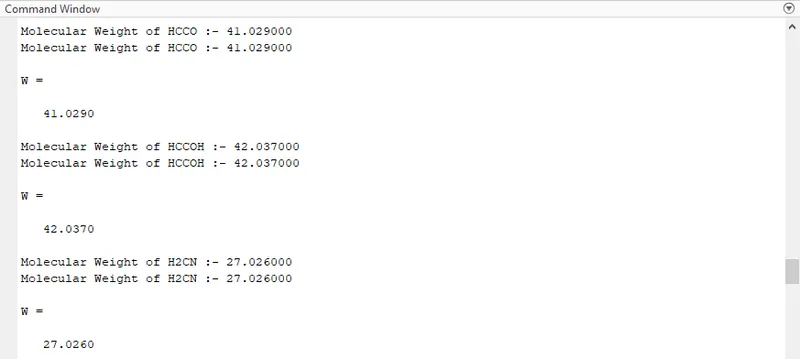
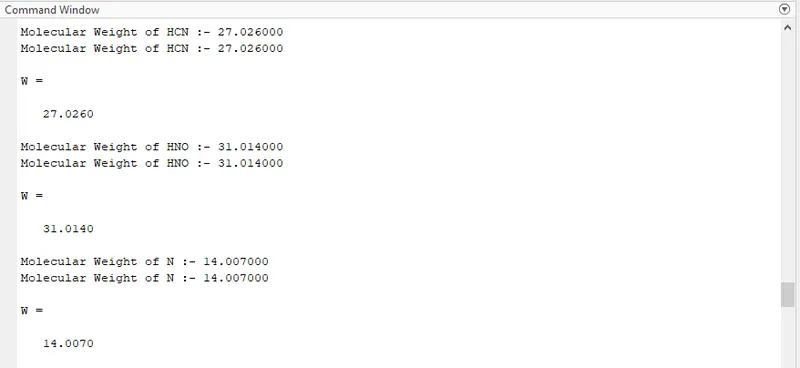
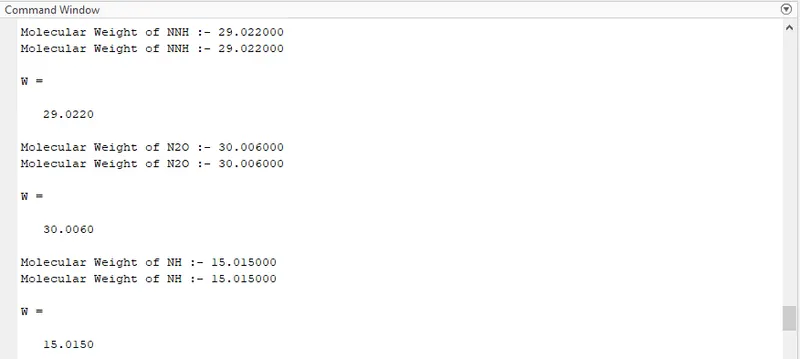
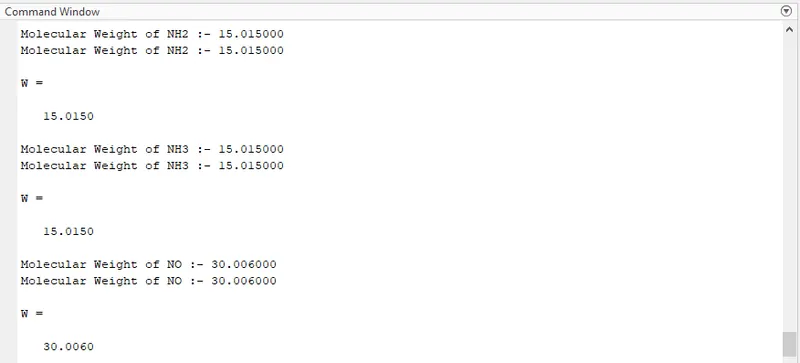
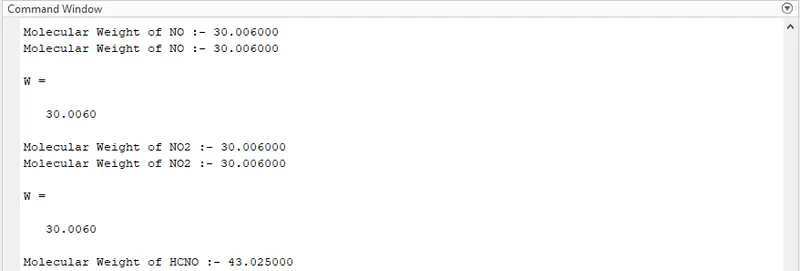
Calculate the molecular weight of each species and display it in the command window.
* Plot the Cp, Enthalpy and Entropy for the local temperature range (low temperature : high temperature) specific for each species.
* Save the plots as images with appropriate names and dump them in separate folders for each species with suitable name. All these should be generated automatically.
* The main program that you will submit will just take the "THERMO.dat" file as an input and generate Cp, H and S plots.
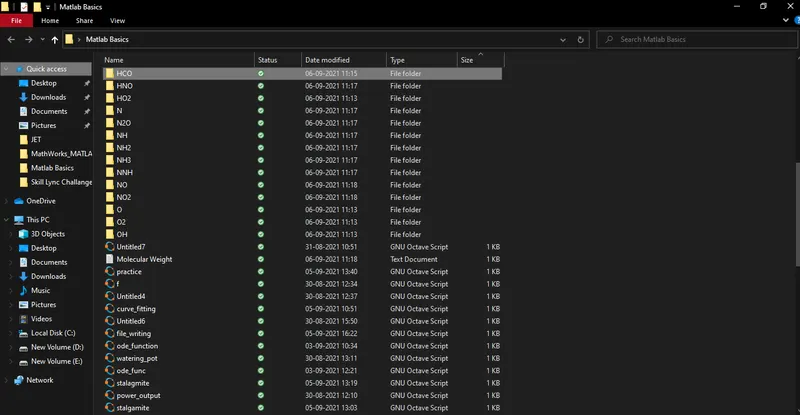
* Provide the screenshot of the window where all the folders are saved.
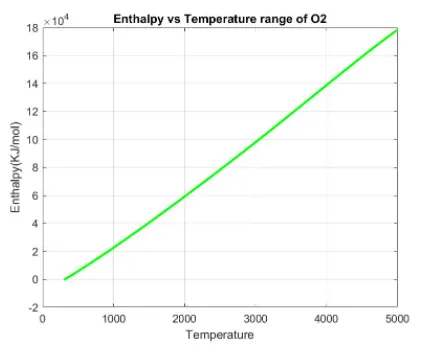
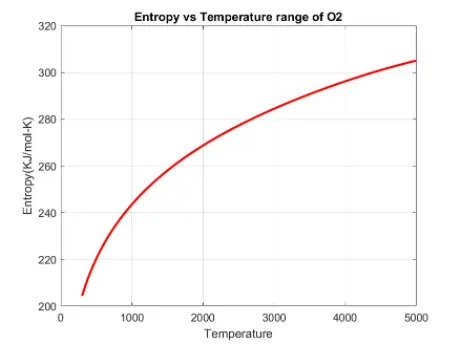
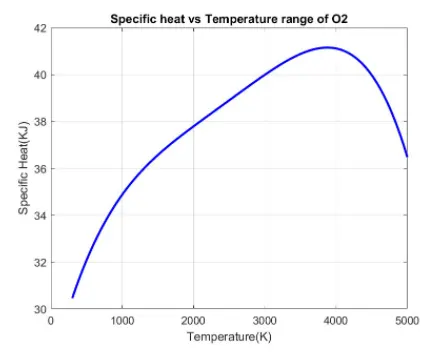
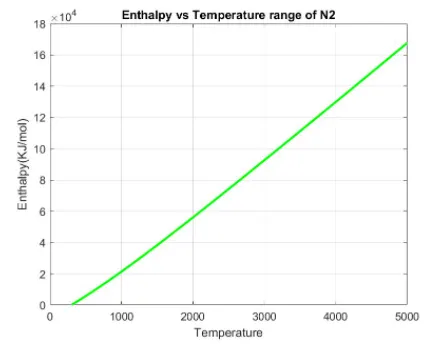
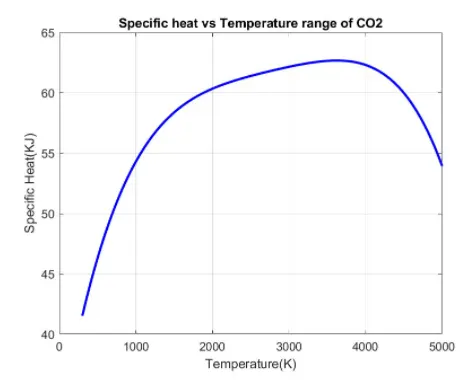
Plots for o2, N2 and Co2 species.
FILE PARSING
Parsing in computer languages refers to syntactic analysis of the input code into its components parts in order to facilitate the writing of compilers and interpreters. It can be used to describe split or separation.
Parsing a file means reading in a data stream of some sort and building an in memory model of the semantic content of that data. This aims at facilitating perfoming some kind of transformation on the data.
NASA Thermodynamic File
THERMO.dat file is a data file containing 14 coefficients for 53 different elements given by NASA. These coefficients are utilized to calculate the specific heat, enthalpy & entropy for a particular element. Each element has its own range of local temperature. Below screenshot of the THERMO.dat file is displayed.
The NASA Polynomials have the form as shown below :

where ,
R is the universal gas constant,
T is the temeprature,
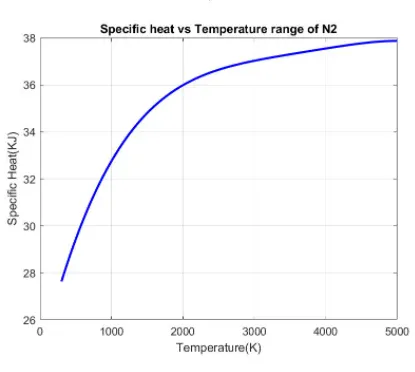
Cp = Specific heat (KJ),
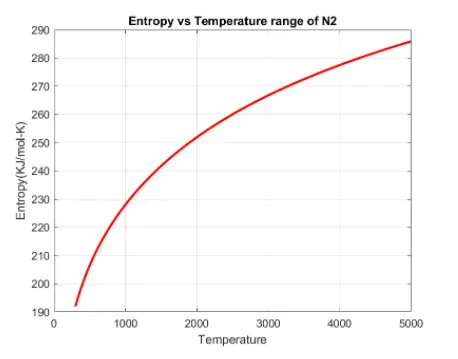
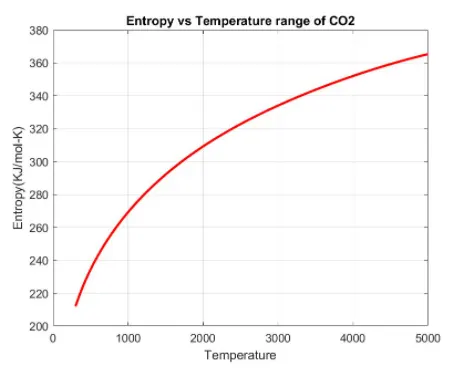
S = Entropy(KJ/mol-K),
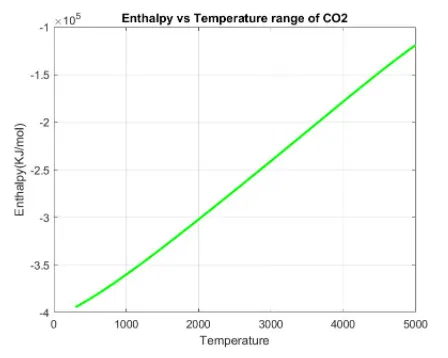
H = Enthalpy(KJ/mol),
a(i) = Coefficients where, i = 1 to 14
1. Specific Heat
The quantity of heat required to raise the temperature of one gram of a substance by one Celsius degree is called specific heat. The units of specific heat are usually calories or joules per gram per Celsius degree.
Cp = R*(a1 + (a2*T) + (a3*(T).^2) + (a4*(T).^3) + (a5*(T).^4))
Function for specific heat:
function Cp = Specific_heat(a1,a2,a3,a4,a5,a8,a9,a10,a11,a12,T,R,tempmid)

    % calculating specific heat
    % calculating specific heat for higher and lower temperature repectively.

    if (T <= tempmid)
        Cp = R*(a8 + (a9*T) + (a10*(T).^2) + (a11*(T).^3) + (a12*(T).^4));
    else
        Cp = R*(a1 + (a2*T) + (a3*(T).^2) + (a4*(T).^3) + (a5*(T).^4));
    end
end
2. ENTROPY
Entropy is a scientific concept, as well as a measurable physical property that is most commonly associated with a state of disorder, randomness, or uncertainty.
S = R*(a1.log(T) + (a2*T) + ((a3(T).^2)/2) + ((a4*(T).^3)/3) + ((a5*(T).^4)/4) + a7)
Function for Entropy:
function S = Entropy(a1,a2,a3,a4,a5,a7,a8,a9,a10,a11,a12,a14,T,R,tempmid)

    % calculating entropy
    % calculating entropy for higher and lower temperature repectively.

    if (T <= tempmid)
        S = R*(a8.log(T) + (a9*T) + ((a10(T).^2)/2) + ((a11*(T).^3)/3) + ((a12*(T).^4)/4) + a14);
    else
        S = R*(a1.log(T) + (a2*T) + ((a3(T).^2)/2) + ((a4*(T).^3)/3) + ((a5*(T).^4)/4) + a7);

    end
end
3. ENTHALPY
Enthalpy is a property of a thermodynamic system, and is defined as the sum of the system's internal energy and the product of its pressure and volume.
H = R*T.(a1 + ((a2*T)/2) + ((a3(T).^2)/3) + ((a4*(T).^3)/4) + ((a5*(T).^4)/5) + ((a6./T)))
Function for Enthalpy
function H = Enthalpy(a1,a2,a3,a4,a5,a6,a8,a9,a10,a11,a12,a13,T,R,tempmid)

    % calculating enthalpy
    % calculating enthalpy for higher and lower temperature repectively.

    if (T <= tempmid)
        H = R*T.(a8 + ((a9*T)/2) + ((a10(T).^2)/3) + ((a11*(T).^3)/4) + ((a12*(T).^4)/5)
        + ((a13./T)));
    else
        H = R*T.(a1 + ((a2*T)/2) + ((a3(T).^2)/3) + ((a4*(T).^3)/4) + ((a5*(T).^4)/5) +
        ((a6./T)));
    end
end
Function to find Molecular Weight of the different species:
function W = Molecular_weight(species)

    % Defining Atomic name of the species
    atomic_name = ['H','C','O','N','Ar'];

    % Defining Atomic masses of main species
    atomic_weight = [1.008 12.011 15.999 14.007 39.948];

    W=0;  % Molecular weight starting range

    for i=1:length(species)   % Loop runs to the length of the species
        for j=1:length(atomic_name)  % Loop runs to the length of the atomic names
            if strcmp(species(i), atomic_name(j))  %function to compare 2 strings
                W = W + atomic_weight(j);
                position = j;
            end
        end
        n = str2num(species);   % Now we will find if there is more element in the species then incrementing atomic weight of the species

        if n>1
            W = W + atomic_weight(position)*(n-1);
        end
    end

    fprintf('Molecular Weight of %s :- ',species);
    fprintf('%f',W);
    disp(' ')
end
MAIN CODE:
clear all
close all
clc

%Input
R=8.314; % Gas Constant

% Reading data file
% open file and reading THERMO.dat file
f1 = fopen('THERMO.dat','r')
get = fgetl(f1);

% Now Reading Temperature from this file
temp = fgetl(f1);

%spliting
s = strsplit(temp);

% converting strings cells into numbers
templow = str2num(s{2});
tempmid = str2num(s{3});
temphigh = str2num(s{4});

% Temperature Range
T = linspace(templow,temphigh,1000);

%Skipping comment lines
for i=1:3
    get=fgetl(f1);
end

% Reading the Species
for j=1:53
    tline=fgetl(f1);

   A=strsplit(tline,' ');  % spliting into cell array
    species =  (A{1});         % To read the name of the species

     % Converting string to number
    lowtemp = str2num(A{end-3});
    midtemp = str2num(A{end-2});
    hightemp = str2num(A{end-1});


    tline1 = fgetl(f1);   % getting next line
    a = strfind(tline1,'E');  % Finding the string E

    % Finding First 7 higher and second 7 lower coefficients
    %Finding Higher coefficients
    a1 = tline1(1:a(1)+3);
    a1 = str2num(a1);
    a2 = tline1(a(1)+4:a(2)+3);
    a2 = str2num(a2);
    a3 = tline1(a(2)+4:a(3)+3);
    a3 = str2num(a3);
    a4 = tline1(a(3)+4:a(4)+3);
    a4 = str2num(a4);
    a5 = tline1(a(4)+4:a(5)+3);
    a5 = str2num(a5);

    tline2 = fgetl(f1);
    b = strfind(tline2,'E');
    a6 = tline2(1:b(1)+3);
    a6 = str2num(a6);
    a7 = tline2(b(1)+4:b(2)+3);
    a7 = str2num(a7);

    % Finding Lower coefficients
    a8 = tline2(b(2)+4:b(3)+3);
    a8 = str2num(a8);
    a9 = tline2(b(3)+4:b(4)+3);
    a9 = str2num(a9);
    a10 = tline2(b(4)+4:b(5)+3);
    a10 = str2num(a10);

    tline3 = fgetl(f1);
    c = strfind(tline3,'E');
    a11 = tline3(1:c(1)+3);
    a11 = str2num(a11);
    a12 = tline3(c(1)+4:c(2)+3);
    a12 = str2num(a12);
    a13 = tline3(c(2)+4:c(3)+3);
    a13 = str2num(a13);
    a14 = tline3(c(3)+4:c(4)+3);
    a14 = str2num(a14);

    % calculate specific heat
    Cp = Specific_heat(a1,a2,a3,a4,a5,a8,a9,a10,a11,a12,T,R,tempmid);

    % calculate Entropy
    S = Entropy(a1,a2,a3,a4,a5,a7,a8,a9,a10,a11,a12,a14,T,R,tempmid);

    % claculate Enthalpy
    H = Enthalpy(a1,a2,a3,a4,a5,a6,a8,a9,a10,a11,a12,a13,T,R,tempmid);

    % Calculate Molecular weight of the Species
    W = Molecular_weight(species);

    % writing molecular weight file
    MW_file = fopen('Molecular Weight.txt','w');
    fprintf(MW_file,'Molecular weight of %s is %d ',species,W);
    fclose(MW_file);   % Closing the file

    %Plotting Cp, H and S with Temperature
    % Saving in a folder
    cd('C:\Users\bsrra\OneDrive\Desktop\Matlab Basics') % changing directory
    mkdir(species);  %creating directory
    cd(species);


    % Plot 1 Cp vs T
    figure(1)
    plot(T,Cp,'linewidth',2,'color','b');
    xlabel('Temperature(K)');
    ylabel('Specific Heat(KJ)');
    title(sprintf('Specific heat vs Temperature range of %s',species));
    grid on
    saveas(figure(1),'Specific Heat.jpg');

    % Plot 2 S vs T
    figure(2)
    plot(T,S,'linewidth',2,'color','r');
    xlabel('Temperature');
    ylabel('Entropy(KJ/mol-K)');
    title(sprintf('Entropy vs Temperature range of %s',species));
    grid on
    saveas(figure(2),'Entropy.jpg');

    % Plot 3 Cp vs T
    figure(3)
    plot(T,H,'linewidth',2,'color','g');
    xlabel('Temperature');
    ylabel('Enthalpy(KJ/mol)');
    title(sprintf('Enthalpy vs Temperature range of %s',species));
    grid on
    saveas(figure(3),'Enthalpy.jpg');

    cd('C:\Users\bsrra\OneDrive\Desktop\Matlab Basics')  %Changing directory to Original matlab path

    % Molecular weight
    W =  Molecular_weight(species)

end
RESULTS:
Plots of O2
Plots of N2
Plots of CO2
Screenshot of directory where different species are saved

Screenshots of Command Window
References
https://en.wikipedia.org/wiki/Parsing
https://www.mathworks.com/matlabcentral/answers/317006-create-new-folders-by-mkdir
https://www.mathworks.com/matlabcentral/answers/17580-how-to-define-a-path-in-saveas-command
https://www.mathworks.com/matlabcentral/answers/106320-make-a-loop-to-calculate-molecular-weight