Project 1 - Parsing NASA thermodynamic data
MATLAB CODE FOR FILE PARSING:
clear all
close all
clc

f1 = fopen('THERMO.dat','r'); %reads the THERMO data file
output_data = zeros(218,5); %creates an array of 218x5

%%  seperating numerical data, local temperatures and molecule names from the data file
localtemp = zeros(218,3);
for i=1:218
    data = fgetl(f1); %returns current line

    %% numerical data
    TF = isstrprop(data,'digit'); %checks which part of the string is a digit and which is not and returns with value 1 for digits and zero for non digits
    lenTF = length(TF); %calculates length of TF
    a = 0;

    if lenTF == 80 %if condition where it will execute only if the length of TF is 80
        a = TF(11); %assigns the value at 11th position in TF to a
    end

    if a==1 %if condition where it will execute only if the value of a is equal to 1
        e = strfind(data,'E'); %searches for string 'E' in the current string data in 'data', matlab suggested to use strfind instead of findstr
        lene = length(e); %calculates the length of 'e'

        if lene==5 %if condition where it will execute only if length of e = 5

            j=1;
            d = data(1:e(1)+3);
            d = string(d);
            output_data(i,j) = str2double(d);

            j=j+1;
            d = data(e(1)+4:e(2)+3);
            d = string(d);
            output_data(i,j) = str2double(d);

            j=j+1;
            d = data(e(2)+4:e(3)+3);
            d = string(d);
            output_data(i,j) = str2double(d);

            j=j+1;
            d = data(e(3)+4:e(4)+3);
            d = string(d);
            output_data(i,j) = str2double(d);

            j=j+1;
            d = data(e(4)+4:e(5)+3);
            d = string(d);
            output_data(i,j) = str2double(d);

        else  % else condition will execute when length of e is not equal to 5
            j=1;
            d = data(1:e(1)+3);
            d = string(d);
            output_data(i,j) = str2double(d);

            j=j+1;
            d = data(e(1)+4:e(2)+3);
            d = string(d);
            output_data(i,j) = str2double(d);

            j=j+1;
            d = data(e(2)+4:e(3)+3);
            d = string(d);
            output_data(i,j) = str2double(d);

            j=j+1;
            d = data(e(3)+4:e(4)+3);
            d = string(d);
            output_data(i,j) = str2double(d);

        end

    end

    %% segregating local temperatures

    TF = isstrprop(data,'alpha'); %checks which part of the string is an alphabet or letter and which is not and returns with value 1 for alphabets and zero for non alphabets
    lenTF = length(TF); %calculates length of TF
    a = 0;

    if lenTF == 80 %if condition where it will execute only if the length of TF is 80
        a = TF(1); %assigns the value at 1st position in TF to a
    end

    if a==1
     b = strsplit(data,' '); %splits strings with the space markings into individual strings without the same marking in it
     b = b(~cellfun('isempty',b)); %to remove empty cells that hinders program
     lenb = length(b);
     b = string(b);

     c = b(lenb-3);
     localtemp(i,1) = str2double(c);
     c = b(lenb-2);
     localtemp(i,2) = str2double(c);
     c = b(lenb-1);
     localtemp(i,3) = str2double(c);
    end

    %% segregating molecular formulas
    TF = isstrprop(data,'alpha'); %checks which part of the string is an alphabet or letter and which is not and returns with value 1 for alphabets and zero for non alphabets
    lenTF = length(TF); %calculates length of TF
    a = 0;

    if lenTF == 80 %if condition where it will execute only if the length of TF is 80
        a = TF(1); %assigns the value at 1st position in TF to a
    end

    if a==1
     b = strsplit(data,' '); %splits strings with the space markings into individual strings without the same marking in it
     b = b(~cellfun('isempty',b)); %to remove empty cells that hinders program

     mol(i) = b(1);
    end

end

mol = mol(~cellfun('isempty',mol));
mol = string(mol);

%% segregating numerical data and local temperatures for respective compounds

serialop = reshape(output_data.',1,[]);%rearrange in order in one row
v = nonzeros(localtemp'); %remove all zeros
ltemp = reshape(v,3,[])' ;%reshape the matrix
lenltemp = length(ltemp);
k = 31;
x = 1;

allval = zeros(218,14);
a = 1;
l = 1;

elements = ['H','C','O','N','A','S'];
atmwt = [1.0079 12.0107 15.999 14.0067 39.948 32.065];
molmass=0;
m = 1;
r = 1;
for a = 1:53

    %% saving numerical data
    allval(x,:) = serialop(1,(k:k+13));
    x = x+1;
    k = k+20;

    %% saving local temp
    allval(x,(1:3)) = ltemp(l,(1:3));
    x = x+2;
    l = l+1;

    %% calculating molecular mass
    h = mol(a);
    h = char(h);
    lenmol = length(h);
    for r = 1:lenmol
       y = h(r);
       y = string(y);
    for m=1:6
        t=strcmpi(y,elements(m));
        if t==1
            u=atmwt(m);
            molmass = molmass+u;
            p=m;
        end
    end

  r=1;
  n=str2double(y);
           if n>1
                molmass = molmass + atmwt(p)*(n-1);
           end
  end
   mass(a)=molmass;
   sprintf('molecular weight of %s : %f', h,molmass)
   molmass = 0;
end

%% generating respective plots and saving them in individual folders
x=1;
i=1;

    currentpath = pwd;
    newdir = fullfile(currentpath);
    % Specify some particular, specific folder:
    plots = fullfile(newdir,filesep,'plots');
    mkdir (plots);
cp = zeros(1,1000);
H = zeros(1,1000);
S = zeros(1,1000);
for i=1:53
    %opening a figure window in maximised state
    %figure1 = figure('WindowState','maximized');
        %% low temp
    temprangelow = linspace(allval(x+1,1),allval(x+1,3),1000);
    lowtempval = allval(x,(8:14));
    name = mol(i);
    a1 = lowtempval(1);
    a2 = lowtempval(2);
    a3 = lowtempval(3);
    a4 = lowtempval(4);
    a5 = lowtempval(5);
    a6 = lowtempval(6);
    a7 = lowtempval(7);

    R = 8.31446261815324; %J*K-1*mol-1

    o = 1;
    for o =1:1000
        T = temprangelow(o);
        cp(o) = (a1 + a2*T +a3*(T^2)+ a4*(T^3)+a5*(T^4))*R;
        H(o)= (a1 + a2*T/2 + a3*(T^2)/3 + a4*(T^3)/4 + a5*(T^4)/5 + a6/T)*R*T;
        S(o) = (a1*log(T) + a2*T + a3*(T^2)/2 + a4*(T^3)/3 + a5*(T^4)/4 + a7)*R;
    end

    fname = sprintf('%s',name);
    mkdir(plots,fname)
    localdir = fullfile(newdir, 'plots',fname);
    cd (localdir)

    plot(temprangelow,cp)
    title(name,'cp vs low temp range')
    saveas (gca,sprintf('low temperature plot of cp vs temp_%s.jpg',fname))

    plot(temprangelow,H)
    title(name,'H vs low temp range')
    saveas (gca,sprintf('low temperature plot of H vs temp_%s.jpg',fname))

    plot(temprangelow,S)
    title(name,'S vs low temp range')
    saveas (gca,sprintf('low temperature plot of S vs temp_%s.jpg',fname))

    %figure(k); % Activate the figure again.
    %saveas (gca,sprintf('low temperature plot of_%s.jpg',fname))
    %% high temp
    temprangehigh = linspace(allval(x+1,3),allval(x+1,2),1000);
    hightempval = allval(x,(1:7));
    a1 = hightempval(1);
    a2 = hightempval(2);
    a3 = hightempval(3);
    a4 = hightempval(4);
    a5 = hightempval(5);
    a6 = hightempval(6);
    a7 = hightempval(7);

    R = 8.31446261815324; %J*K-1*mol-1

    o = 1;
    for o =1:1000
        T = temprangehigh(o);
        cp(o) = (a1 + a2*T +a3*(T^2)+ a4*(T^3)+a5*(T^4))*R;
        H(o)= (a1 + a2*T/2 + a3*(T^2)/3 + a4*(T^3)/4 + a5*(T^4)/5 + a6/T)*R*T;
        S(o) = (a1*log(T) + a2*T + a3*(T^2)/2 + a4*(T^3)/3 + a5*(T^4)/4 + a7)*R;
    end

    plot(temprangehigh,cp)
    title(name,'cp vs high temp range')
    saveas (gca,sprintf('high temperature plot of cp vs temp_%s.jpg',fname))

    plot(temprangehigh,H)
    title(name,'H vs high temp range')
    saveas (gca,sprintf('high temperature plot of H vs temp_%s.jpg',fname))

    plot(temprangehigh,S)
    title(name,'S vs high temp range')
    saveas (gca,sprintf('high temperature plot of S vs temp_%s.jpg',fname))

    %saveas (gca,sprintf('high temperature plot of_%s.jpg',fname))
    x=x+3;
end

cd (currentpath)
OUTPUT:
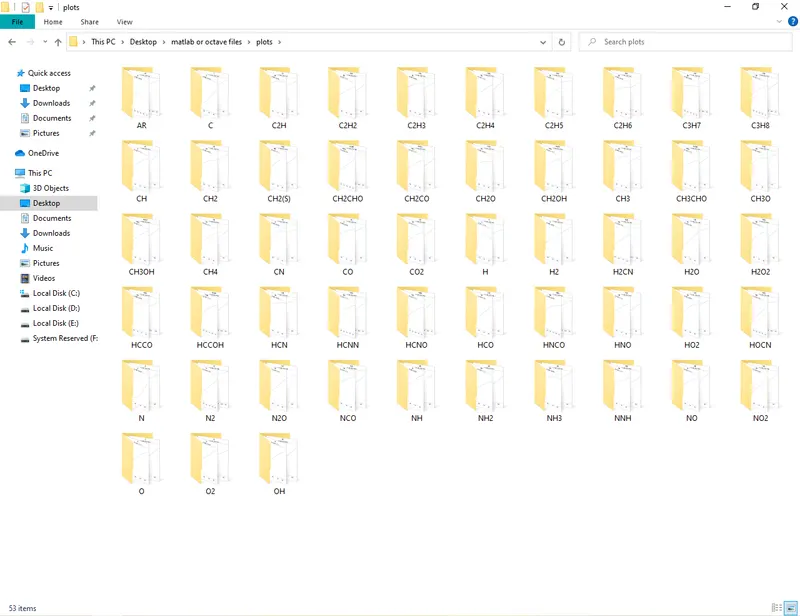
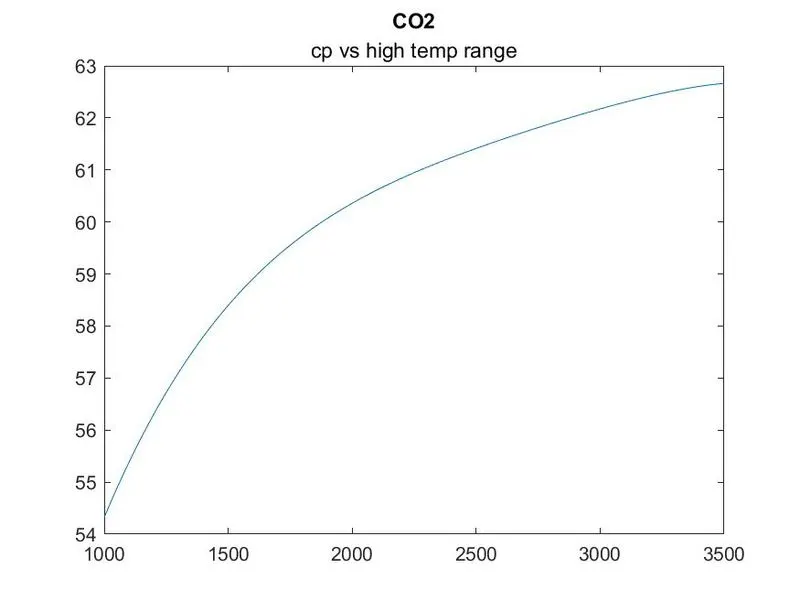
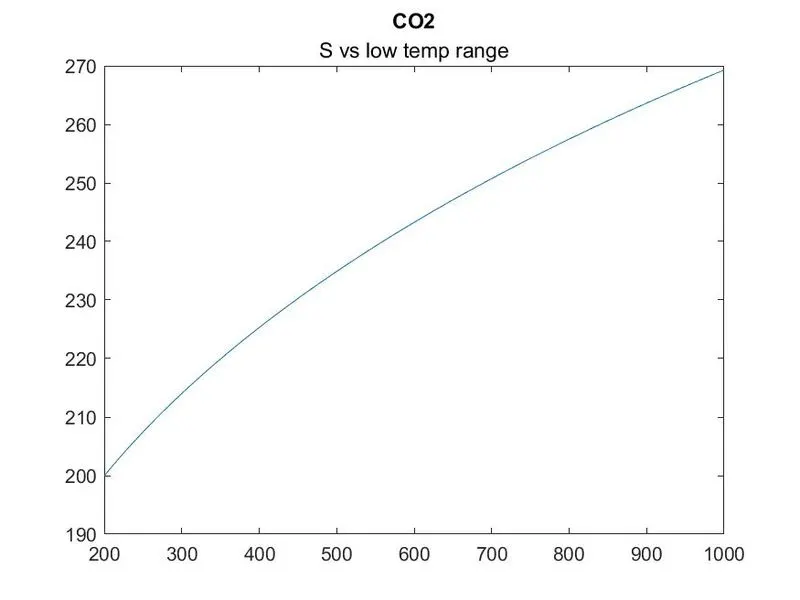
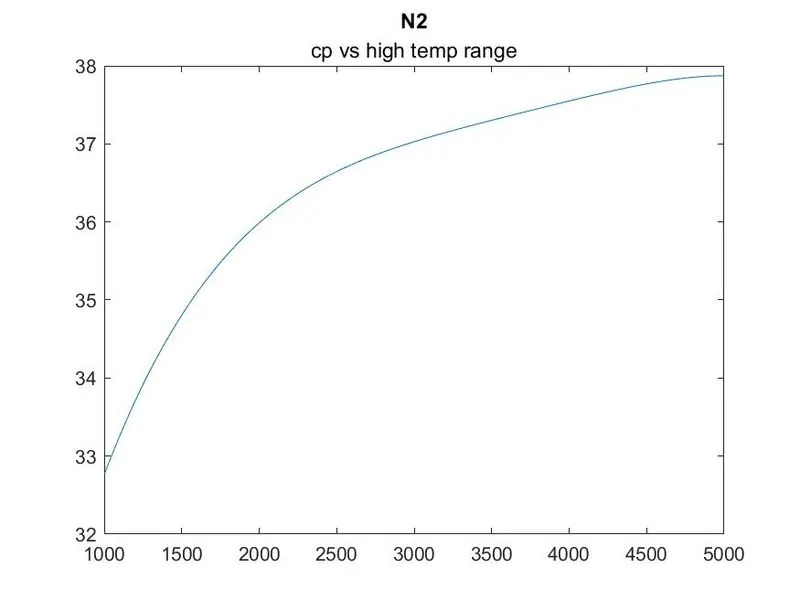
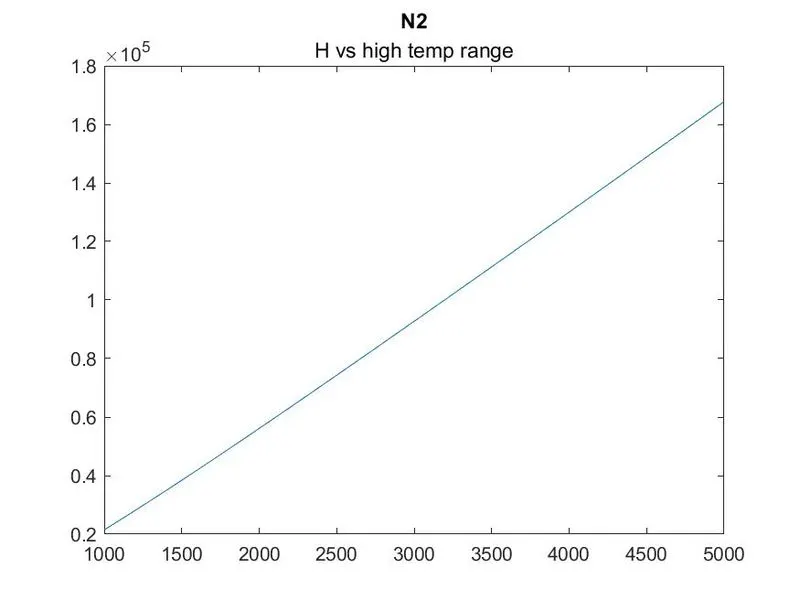
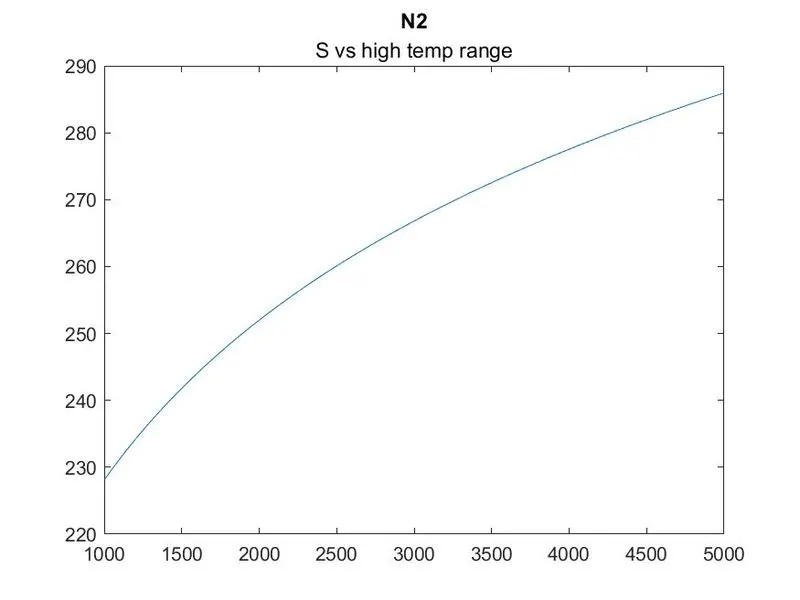
Output folder consisting of all species folders:
O2:
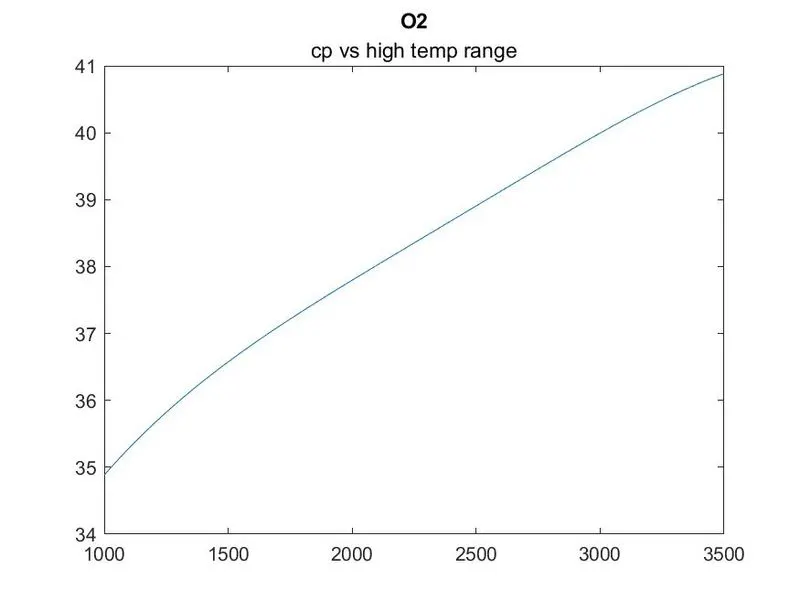
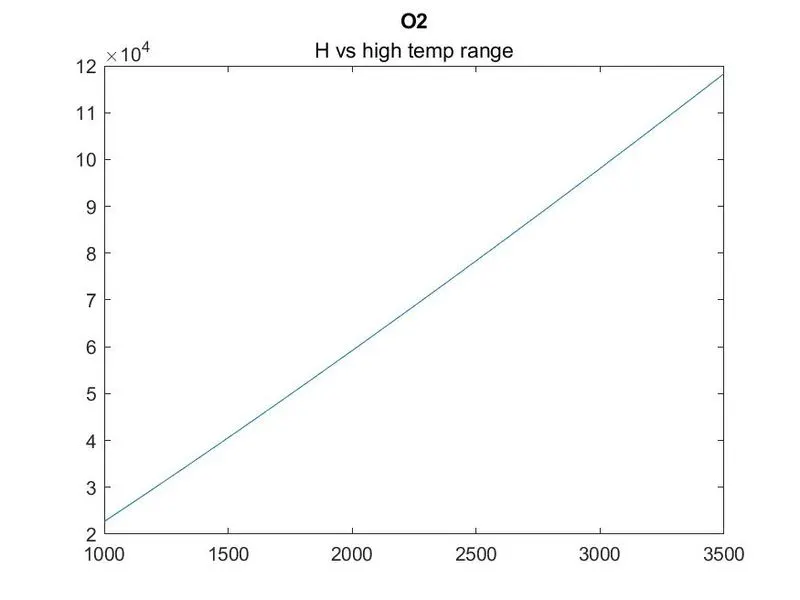
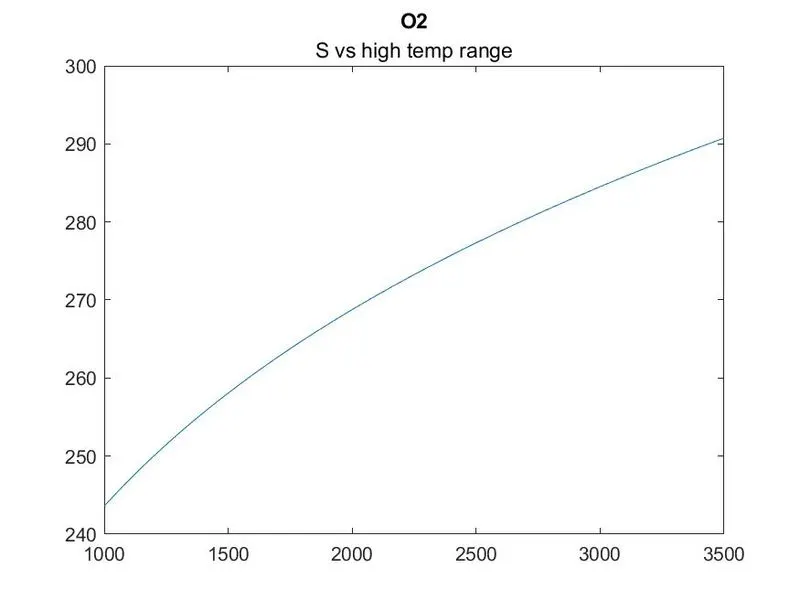
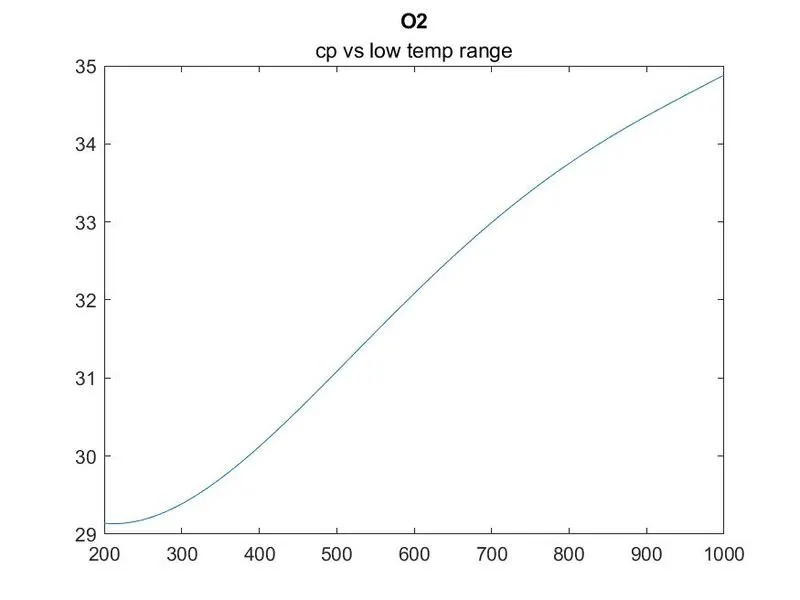
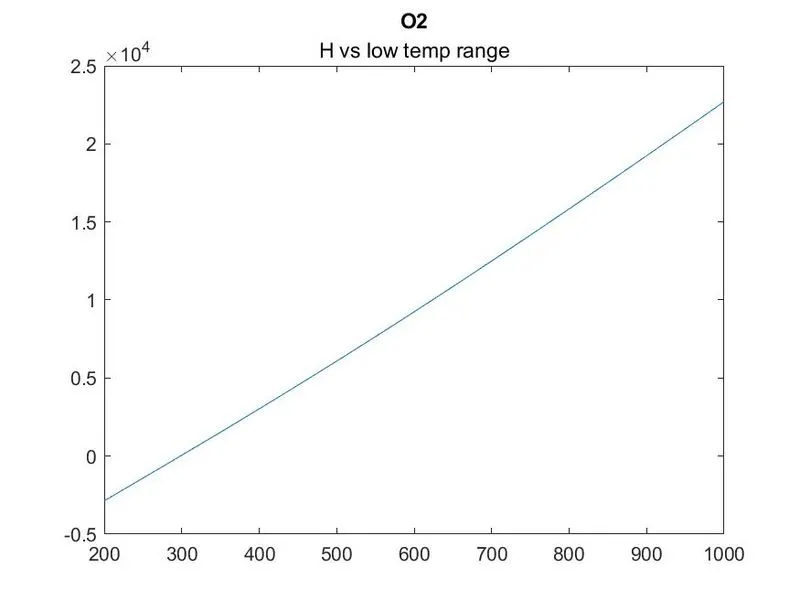
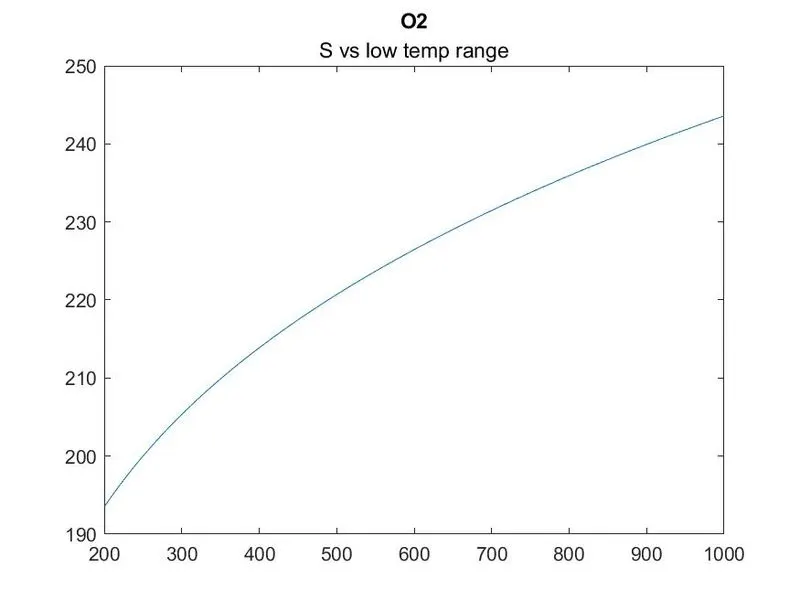
CO2:
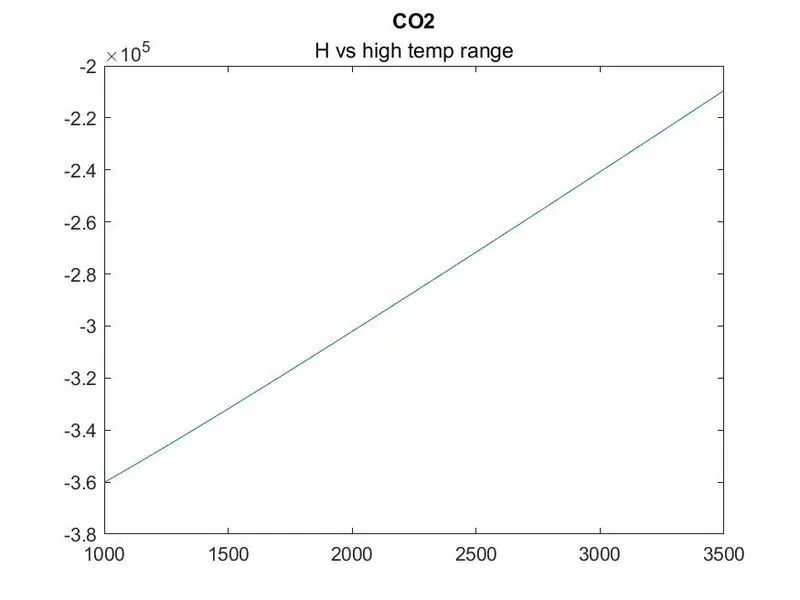
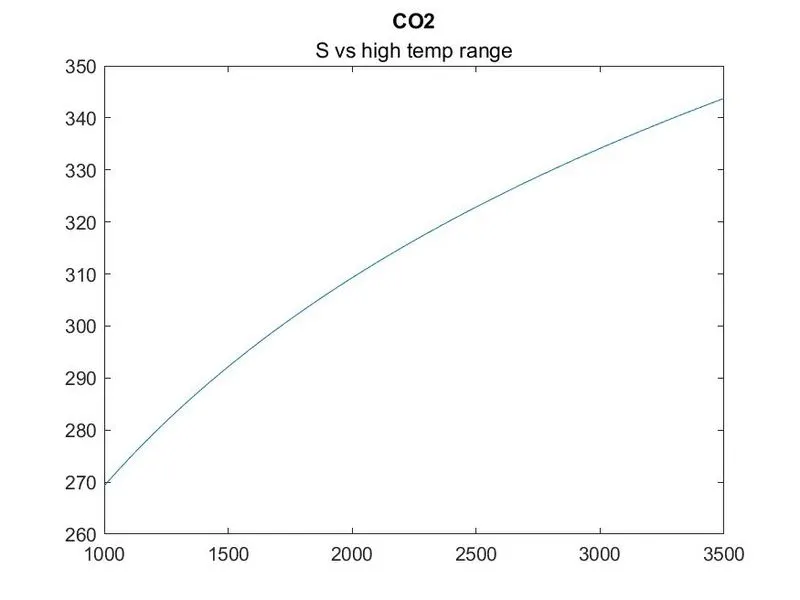
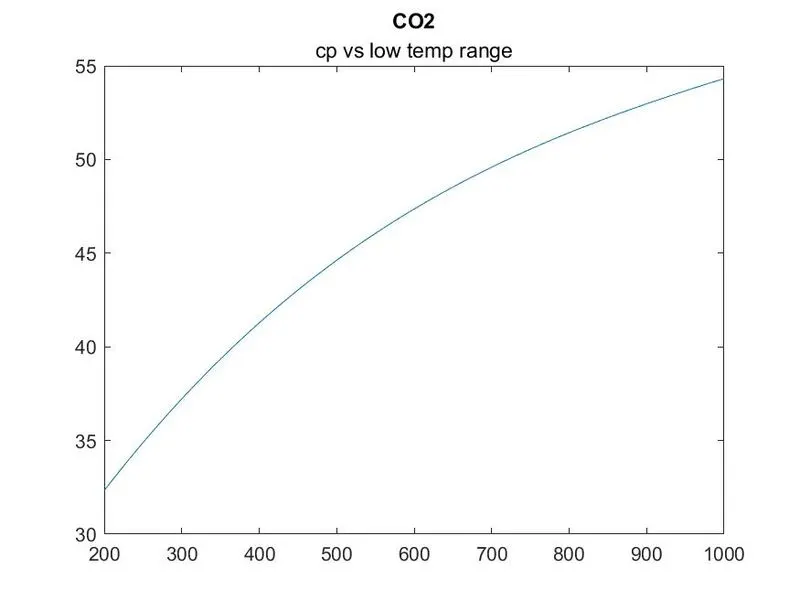
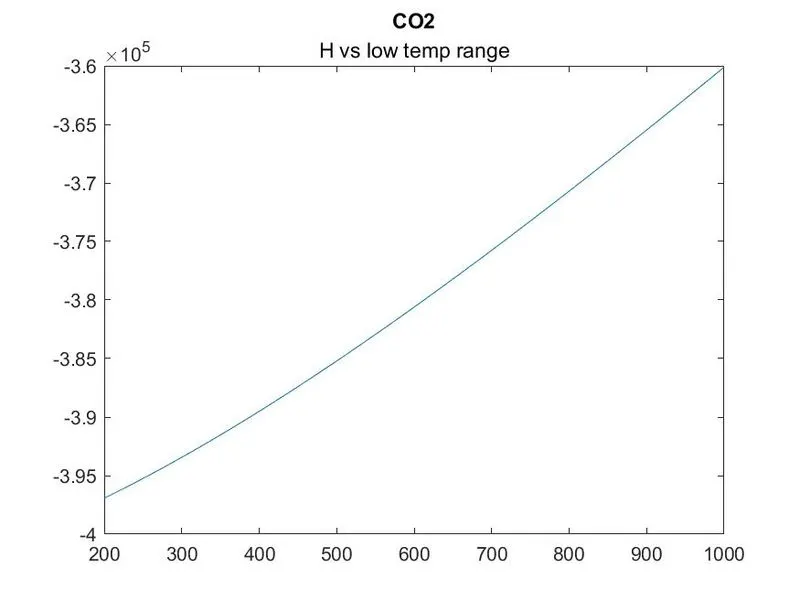
N2:
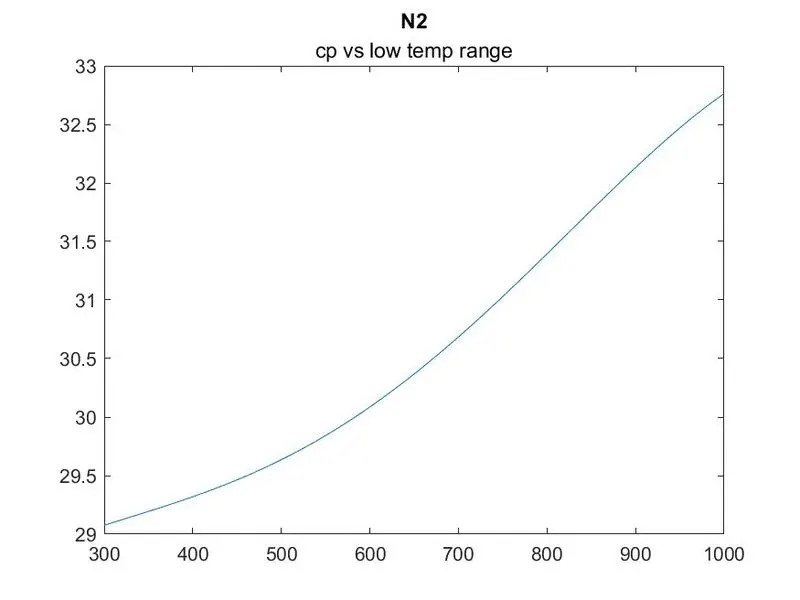
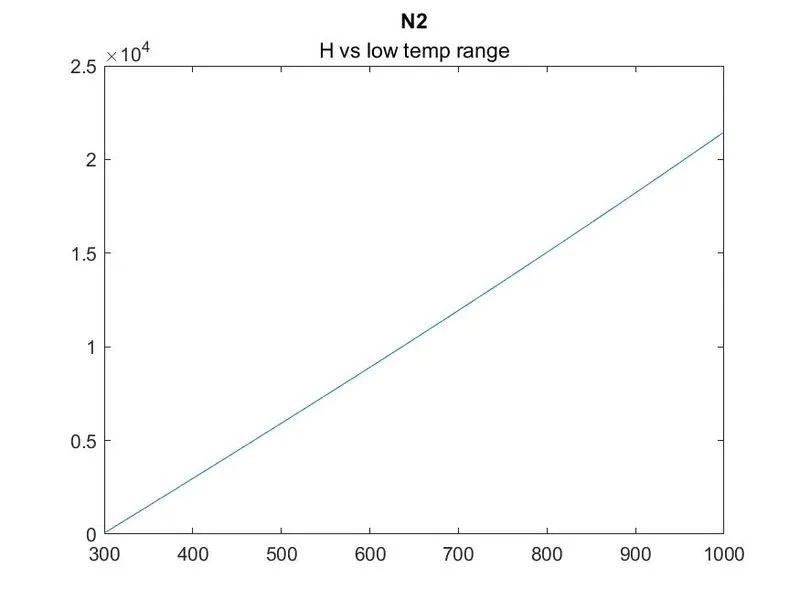
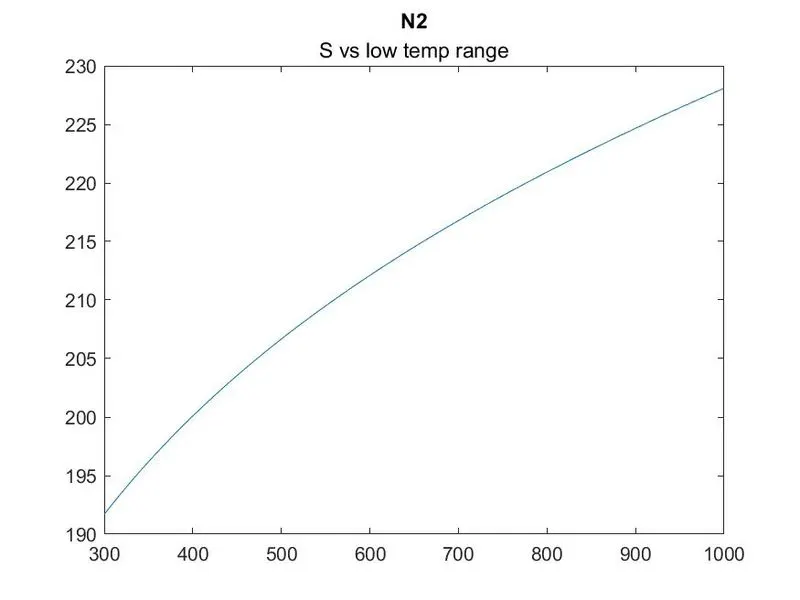
CODE EXPLANATION:
The matlab code initially accesses the file that is to be read using the fopen command. After this any data retrieved will be from the file ‘Thermo.dat’. To retrieve data from the file, the ‘fgetl’ command is used, which retrieves each line individually and retrieves a new line every time the code is run. This way a for loop is used to call individual lines in the first main for-loop. Every time a line is called the line passes through two tests or filters which extract information. Each of the filter has a similar code layout which is:
TF = isstrprop(data,'digit'); %checks which part of the string is a digit and which is not and returns with value 1 for digits and zero for non digits
lenTF = length(TF); %calculates length of TF
a = 0;
if lenTF == 80 %if condition where it will execute only if the length of TF is 80
a = TF(11); %assigns the value at 11th position in TF to a
end
if a==1 %if condition where it will execute only if the value of a is equal to 1
e = strfind(data,'E'); %searches for string 'E' in the current string data in 'data', matlab suggested to use strfind instead of findstr
lene = length(e); %calculates the length of 'e'
end
The above shown code initially checks the retrieved line for numbers and letters using the ‘isstrprop’ command. The fgetl command retrieves the lines in the form of a string, the ‘isstrprop’ is able to analyse each of the character within the line retrieved. If in case the ‘fgetl’ command retrieved the line in the form of a character array, then it would have to be converted into a string first using the ‘x = string(x)’ command which converts the array ‘x’ from character array to string array.
The ‘isstrprop’ checks every element of a string array for whatever condition is applied. If it is asked to check whether an element is a digit or not, it will check and return logical values of 0 and 1. 0 for not being a digit and 1 for being a digit. It basically returns 1 whenever the element matches the required condition. This logical array is then evaluated in terms of length and logical responses of the command for certain positions within the array that it just checked.
For instance, if seen in the main code above, the first instance where this snippet is used the line is scanned for numerical values, the coefficient values of each species.
The 1st evaluation is regarding the length of the logical array. The length of the logical operator should be specifically 80 elements. If observed closely in the Thermo.dat file, the lines where the coefficients are mentioned, each line has exactly 80 elements.
The 2nd evaluation is that the 11th position of the logical array should be a ‘1’ and not a ‘0’. If the ‘if...’ condition is fulfilled and the value at that position is a ‘1’, then the ‘strfind’ command is executed.
The ‘strfind’ command works similar to ‘isstrprop’ but the application and output is different. The ‘strfind’ (also known as ‘findstr’ command, matlab suggests to use ‘strfind’ instead of ‘findstr’) scans the string array for the element specified, which can be a digit, an alphabet(letters) or spaces and returns its position every time it encounters one. Thus it returns an array which has the positions of the element that was searched within the string.
The positions of the specified character, in the above snippet the letter ‘E’, is stored in the double type array named ‘e’. This data is then used in the following snippet:
if lene==5 %if condition where it will execute only if length of e = 5
j=1;
d = data(1:e(1)+3);
d = string(d);
output_data(i,j) = str2double(d);
end
In this snippet the ‘j’th value of e or ‘j’th position element in array ‘e’ is called in the above code line which then retrieves the respective element from the data array (which is the current line) from the ‘e’th position. This way all the numerical values can be obtained by selecting elements before and after the ‘E’.
These segregated numerical values are stored in an array named ‘output_data’ after the values are converted into double using the ‘str2double’ command(matlab suggests the ‘str2double’ over ‘str2num’ for faster code execution).
Similar to the numerical values extracted, the local temperature values are extracted as well. The following code snippet is used for the same:
TF = isstrprop(data,'alpha'); %checks which part of the string is an alphabet or letter and which is not and returns with value 1 for alphabets and zero for non alphabets
lenTF = length(TF); %calculates length of TF
a = 0;
if lenTF == 80 %if condition where it will execute only if the length of TF is 80
a = TF(1); %assigns the value at 1st position in TF to a
end
if a==1
b = strsplit(data,' '); %splits strings with the space markings into individual strings without the same marking in it
b = b(~cellfun('isempty',b)); %to remove empty cells that hinders program
lenb = length(b);
b = string(b);
c = b(lenb-3);
localtemp(i,1) = str2double(c);
c = b(lenb-2);
localtemp(i,2) = str2double(c);
c = b(lenb-1);
localtemp(i,3) = str2double(c);
end
As visible above, the only change between the previous and current code is condition for comparison is changed in the position of check in the logical array and the comparison condition for ‘isstrprop’ command which is changed from digit to alphabet. This code snippet stores all the local temperatures in an array named ‘localtemp’. But this isn’t the final array because it contains a lot of zeros for spaces that did not have the temperature values. This issue will be solved later in the code.
After segregating the local temperatures, same method is used for extracting the molecular formulas from the thermo.dat file and are stored in ‘mol’ which is a string array.
Now as mentioned before that the local temperature data array is still not processed completely as it contains zeros for each element that did not pass the filter. Thus to remove that the following code snippet is used:
v = nonzeros(localtemp'); %remove all zeros
ltemp = reshape(v,3,[])' ;%reshape the matrix
The non zero command removes all the zero values in between and then it is rearranged or shaped using reshape command. This way the array maintains the 3 column matrix with 53 rows, each row having values of temperature for each species in the order printed in the thermo.dat file.
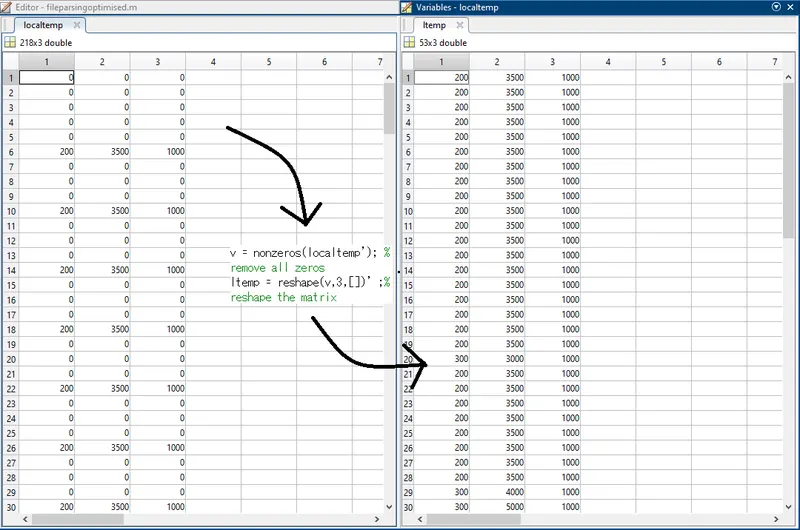
This process eases out the call action for retrieving local temperatures when required.
allval = zeros(218,14);
a = 1;
l = 1;
elements = ['H','C','O','N','A','S'];
atmwt = [1.0079 12.0107 15.999 14.0067 39.948 32.065];
molmass=0;
All the numerical data is then shifted to an array named ’allval’. This array is constructed for ease of programming and use as only a single array will be called, optimising the process gets a lot easier. Other than numerical values, the molecular formulas are stored in an array named ‘mol’ in the string format. This array will be used for calculating the molecular mass using the string comparison command ‘strcmpi’ which is case insensitive.
The comparison string for the strcmpi command is the elements array. The letters in the array will be compared with each element in the molecular formula. And for each element, its atomic weight is mentioned in the next array named ‘atmwt’ which will then be accessed for retrieving the weight of the elements respectively.
%% saving numerical data
allval(x,:) = serialop(1,(k:k+13));
x = x+1;
k = k+20;
%% saving local temp
allval(x,(1:3)) = ltemp(l,(1:3));
x = x+2;
l = l+1;
The above code snippet saves the relevant numerical data and local temperatures into one single array named ‘allval’ which makes the process for retrieving the information easier.
%% calculating molecular mass
h = mol(a);
h = char(h);
lenmol = length(h);
for r = 1:lenmol
y = h(r);
y = string(y);
for m=1:6
t=strcmpi(y,elements(m));
if t==1
u=atmwt(m);
molmass = molmass+u;
p=m;
end
end
r=1;
n=str2double(y);
if n>1
molmass = molmass + atmwt(p)*(n-1);
end
end
mass(a)=molmass;
sprintf('molecular weight of %s : %f', h,molmass)
molmass = 0;
The above code snippet calculates the molecular weight of each species as discussed above and stores them in an array named mass. The loop ends with sprintf command which prints out the values of molecular mass for each element while displaying its name.
The above two code snippets are involved in one common for loop that runs for 53 times as number of elements are 53. Although the challenge was limited to a single file, in future if a different variant if thermo.dat file is given with more species included, then the length of the mol file can be used to make it adaptable.
Initially the length of ‘h’ is used to decide the number of times the loop must run where h is given the value of mol’s ‘a’th value for each ‘a’th loop. After determining the value of length of h, the nested for loop runs that many times. Now note that the type of the value of ‘h’ is converted to character from string which enables or allows the program to take each letter from the name or formula of molecule and calculate its value.
Every time the nested for loop runs, the value of y changes from first letter of the molecule to till the last letter and then a new name is replaced in the value of ‘h’. Each time ‘y’ gets a new value, ‘y’ or its value is compared to the list of characters in ‘elements’ array. The strcmpi returns a logical value and that value is compared in the ‘if..’ condition. Whenever it returns a one, the if condition will run. Then the value of ‘m’ is stored in the variable ‘p’ which is position essentially to retrieve the numerical multiplier of the element indicating its quantity. This way molecules having more than one atom of an element bonded to it can be considered for calculating the accurate molecular weight. This is done by the if condition that is at the end of the snippet. First the string is converted into number using the str2double command which will convert the string into number, where the letters will turn into empty spaces and numbers (which are currently a string) will convert into number or double type data. This will be compared to ‘1’ in the if command condition and will be checked if it is greater than ‘1’ and will execute only if it is, which will usually be the value of the number of atoms the individual element has in the compound.
After the process, the value is all added and stored in the molmass array.
After calculating and printing the values of respective molecular masses comes the part where the values of respective specific heat, entropy and Cp values are required to be calculated and plotted while saving them in individual folders.
currentpath = pwd;
newdir = fullfile(currentpath);
% Specify some particular, specific folder:
plots = fullfile(newdir,filesep,'plots');
mkdir (plots);
cp = zeros(1,1000);
H = zeros(1,1000);
S = zeros(1,1000);
for i=1:53
%opening a figure window in maximised state
%figure1 = figure('WindowState','maximized');
%% low temp
temprangelow = linspace(allval(x+1,1),allval(x+1,3),1000);
lowtempval = allval(x,(8:14));
name = mol(i);
a1 = lowtempval(1);
a2 = lowtempval(2);
a3 = lowtempval(3);
a4 = lowtempval(4);
a5 = lowtempval(5);
a6 = lowtempval(6);
a7 = lowtempval(7);
R = 8.31446261815324; %J*K-1*mol-1
o = 1;
for o =1:1000
T = temprangelow(o);
cp(o) = (a1 + a2*T +a3*(T^2)+ a4*(T^3)+a5*(T^4))*R;
H(o)= (a1 + a2*T/2 + a3*(T^2)/3 + a4*(T^3)/4 + a5*(T^4)/5 + a6/T)*R*T;
S(o) = (a1*log(T) + a2*T + a3*(T^2)/2 + a4*(T^3)/3 + a5*(T^4)/4 + a7)*R;
end
fname = sprintf('%s',name);
mkdir(plots,fname)
localdir = fullfile(newdir, 'plots',fname);
cd (localdir)
plot(temprangelow,cp)
title(name,'cp vs low temp range')
saveas (gca,sprintf('low temperature plot of cp vs temp_%s.jpg',fname))
plot(temprangelow,H)
title(name,'H vs low temp range')
saveas (gca,sprintf('low temperature plot of H vs temp_%s.jpg',fname))
plot(temprangelow,S)
title(name,'S vs low temp range')
saveas (gca,sprintf('low temperature plot of S vs temp_%s.jpg',fname))
%figure(k); % Activate the figure again.
%saveas (gca,sprintf('low temperature plot of_%s.jpg',fname))
%% high temp
temprangehigh = linspace(allval(x+1,3),allval(x+1,2),1000);
hightempval = allval(x,(1:7));
a1 = hightempval(1);
a2 = hightempval(2);
a3 = hightempval(3);
a4 = hightempval(4);
a5 = hightempval(5);
a6 = hightempval(6);
a7 = hightempval(7);
R = 8.31446261815324; %J*K-1*mol-1
o = 1;
for o =1:1000
T = temprangehigh(o);
cp(o) = (a1 + a2*T +a3*(T^2)+ a4*(T^3)+a5*(T^4))*R;
H(o)= (a1 + a2*T/2 + a3*(T^2)/3 + a4*(T^3)/4 + a5*(T^4)/5 + a6/T)*R*T;
S(o) = (a1*log(T) + a2*T + a3*(T^2)/2 + a4*(T^3)/3 + a5*(T^4)/4 + a7)*R;
end
plot(temprangehigh,cp)
title(name,'cp vs high temp range')
saveas (gca,sprintf('high temperature plot of cp vs temp_%s.jpg',fname))
plot(temprangehigh,H)
title(name,'H vs high temp range')
saveas (gca,sprintf('high temperature plot of H vs temp_%s.jpg',fname))
plot(temprangehigh,S)
title(name,'S vs high temp range')
saveas (gca,sprintf('high temperature plot of S vs temp_%s.jpg',fname))
%saveas (gca,sprintf('high temperature plot of_%s.jpg',fname))
x=x+3;
end
The remainder of the code is presented in the snippet above. This snippet first retrieves the current directory of the file and saves it in the currentpath array as a string and creates a new folder named plots using the ‘mkdir’ and ‘fullfile’ commands where the plots will be stored.
As the for loop starts, the 7 coefficients for low temperature range is assigned to 7 variables (i.e. a1 to a7) and the values of cp, s, and h are calculated for 1000 temperature steps between the lowest and mid temperatures provided in the file. The same is done for high temperature coefficients.
These values of cp, h, and s are plotted against the temperature values for both low and high temperature coefficients respectively. Every time a graph is created (initially for low and later for high coefficients) it is saved into its respective directory that is coded after each of their plot generation command. In this loop the program first creates the directory and the generates the plots and saves them into that directory, while the fname variable gives each folder/file the name of the species stored in the mol array.
References:
1] https://www.mathworks.com/matlabcentral/answers/27042-how-to-remove-empty-cell-array-contents
2] https://www.mathworks.com/help/matlab/ref/string.html
3] https://www.mathworks.com/help/matlab/matlab_prog/fundamental-matlab-classes.html
4] https://www.mathworks.com/matlabcentral/answers/262786-how-to-convert-a-character-into-string
5] https://www.mathworks.com/help/matlab/ref/isstrprop.html
6] https://www.mathworks.com/help/matlab/ref/if.html
7] https://www.mathworks.com/matlabcentral/answers/330859-how-to-remove-zeros-from-an-array
8] https://www.mathworks.com/help/releases/R2021a/matlab/ref/fgetl.html?s_tid=doc_srchtitle
9] https://in.mathworks.com/help/matlab/ref/times.html
10] https://in.mathworks.com/matlabcentral/answers/298215-how-to-get-ascii-value-of-characters-stored-in-an-array
11] https://in.mathworks.com/matlabcentral/answers/343350-how-to-save-multiple-plots-in-one-folder
12] https://in.mathworks.com/help/matlab/ref/pwd.html
13] https://in.mathworks.com/matlabcentral/answers/314480-can-matlab-create-subfolders-within-subfolders-programmatically
14] https://in.mathworks.com/matlabcentral/answers/73306-save-figures-to-one-folder