Parsing NASA thermodynamic data
Objective: Parsing a Thermodynamic data file to calculate Molecular weight of the individual elements present in the data file and its thermal properties w.r.t temperature.
Description about the data file: NASA came up with polynomials that can be used to evaluate thermodynamic properties such as Cp, H and S. They have also documented the coefficients that are required to evaluate these polynomials for 1000+ species.
In this project we have broken down the problem into meaningful bits so that we can work on individually.
Here, thermodynamic data file consists of 53 gas species with its coefficients corresponding for a range of temperature values
Each gas species consists of 14 coefficients out of which first 7 coefficients are high-temperature coefficients and the second 7 coefficients are low-temperature coefficients.
There are two temperature ranges in the data file, local temperature ranges which is unique for each individual species and the global temperature range which is common for all the species in the data file.
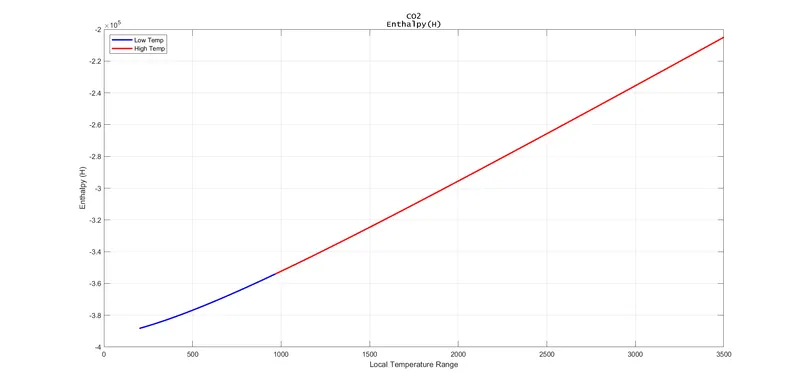
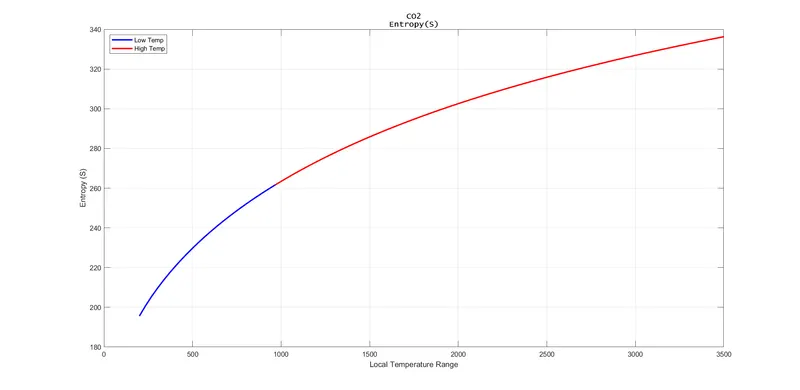
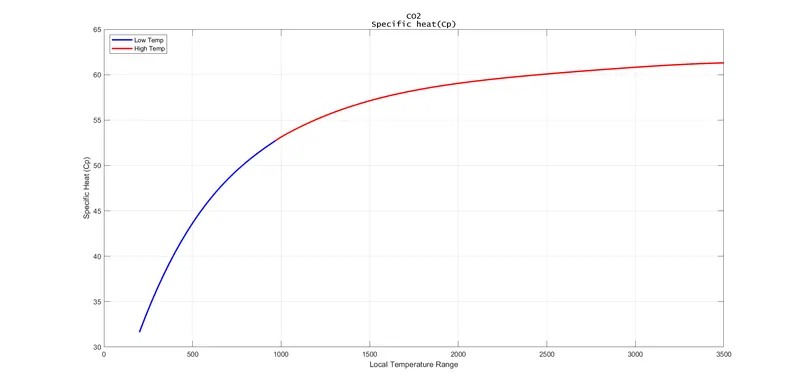
Using these coefficients with in the temperature range we can find some thermal properties like Specific heat (Cp), Enthalpy (H) and Entropy (S). These Thermal properties are helpful to know how it reacts when it is subjected to certain conditions.
Formulae to calculate the above said properties using the obtained coefficients of gas species are
`C_p/R = a_1 + a_2*T+a_3*T^2 + a_4*T^3 + a_5*T^4`
`H/R = a_1 + a_2*T/2+a_3*T^2/3 + a_4*T^3/4 + a_5*T^4/5+a_6/T`
`S/R = a_1*lnT + a_2*T+a_3*T^2/2 + a_4*T^3/3 + a_5*T^4/4+a_7`
Description about File parsing in Matlab:
Let’s start with the data file. The thermodynamic data file we are using is in .dat format. In short, a DAT file is a computer file which stores data to be used by a computer application. The information contained inside a DAT file is usually either plain text or binary, although in rare cases we might encounter them as the actual data of a video file for programs like VCDGear or CyberLink Power Director.
Many programs create, open, and reference DAT files. They designed only for use by the application and not to be opened manually by the user.
The process of "parsing" can be described as reading every line in the file and storing in the memory in the form of strings in order to facilitate performing some kind of transformation on the data.
some operations used in this project are reading species names, temperature values and species coefficients by converting string format to number format etc.
Procedure:
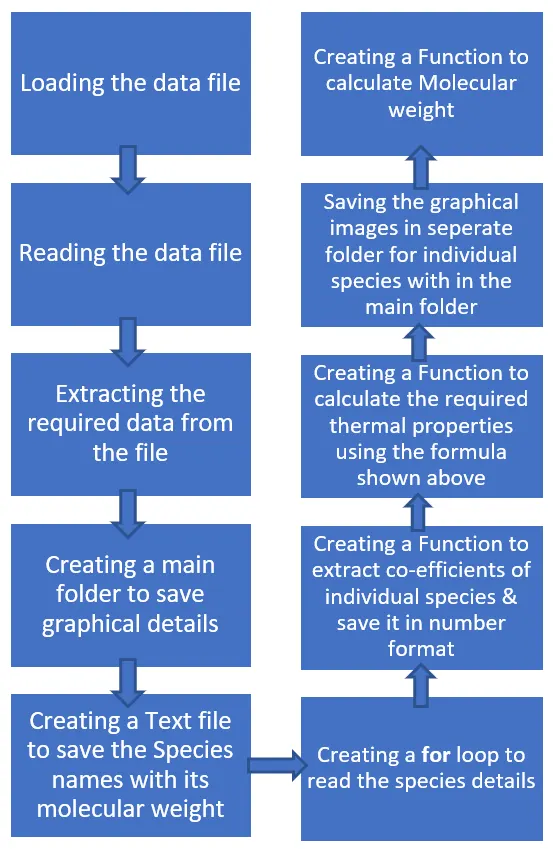
Matlab code with explaination:
1. Main Code
close all
clear all
clc

%To open data file
nasa = fopen('THERMO.dat','r');

%Skipping first line as the global temperatures is in 2nd line
for i=1:2
a=fgetl(nasa);
end

%Extracting global temperatures from the file
a=strsplit(a,' ');      %splitting the string at spaces
global_min_temp=str2num(a{2});
global_mid_temp=str2num(a{3});
global_max_temp= str2num(a{4});

%Creating a folder in the directory of this mat file
main_dir = pwd;           %to get current directory saved in main_dir
mkdir('Graphical Data');  %to creat new directory
cd('Graphical Data');     %to get into that new directory
cd(main_dir);             %to get in the directory of main_dir

%Creating a text file to note the species names
f=fopen('elements.txt','w');
fprintf(f,'List of elementsn');

for species_no = [1:53]
%Finding coefficients
[HTC,LTC,t1,t2,t3,element] = coeff(species_no);
%HTC = High Temperature Coefficients
%LTC = Low Temperature Coefficients
%t1 = local_min_temp
%t2 = local_mid_temp
%t3 = local_max_temp

%Creating a Local Temperature Range
LTR = linspace(t1,t3,100);

%Finding Specific Heat, Entropy, Enthalpy
[Cp,S,H]=thermalproperties(HTC,LTC,LTR,t2,t3,element,main_dir);

%Finding molecular weight
[w] = molecular_weight(char(element));

%Printing Molecular weight in the text file
fprintf(f,'Molecular weight of %s is %dn',char(element),w);
%Displaying the molecular weight in the command window
disp(sprintf('Molecular weight of %s is %d',char(element),w))
end
fclose(f);  %closing the text file
First of all, we need to extract the global temperature range from the data file which is in second line. In order to get that we need to skip the first line which is done using for loop. After entering into the second line the three temperature values are separated by spaces so we have used strsplit cmd.
As everything extracted from the data file is in string format, we need to convert the values from string to number format using str2num and then assigned to individual variables.
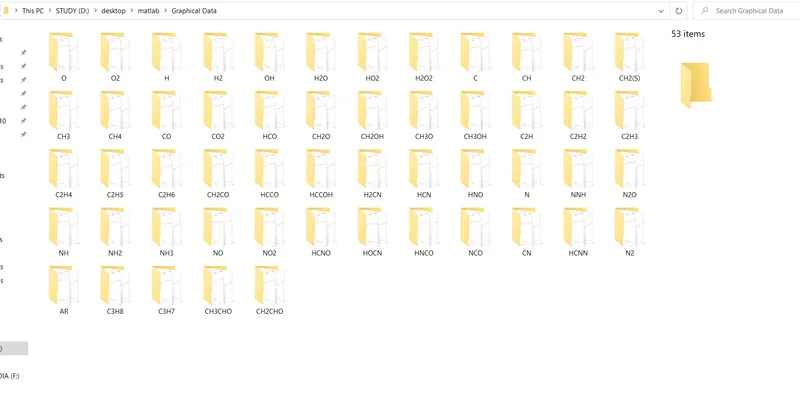
To save the plots of all species in different folders with suitable names to it automatically, we need to create a folder in the current directory. Current directory can be obtained using pwd cmd and storing that directory to a variable helps us to access that directory quickly. In that current directory we need to create a folder to store all the sub-folders using mkdir cmd. To get into that folder the cmd cd is used.
Now, we can use functions to find thermal properties and molecular weight
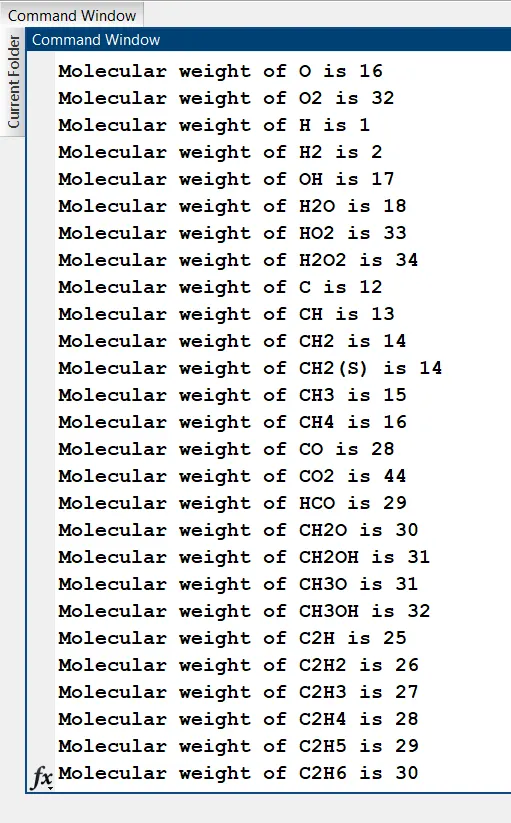
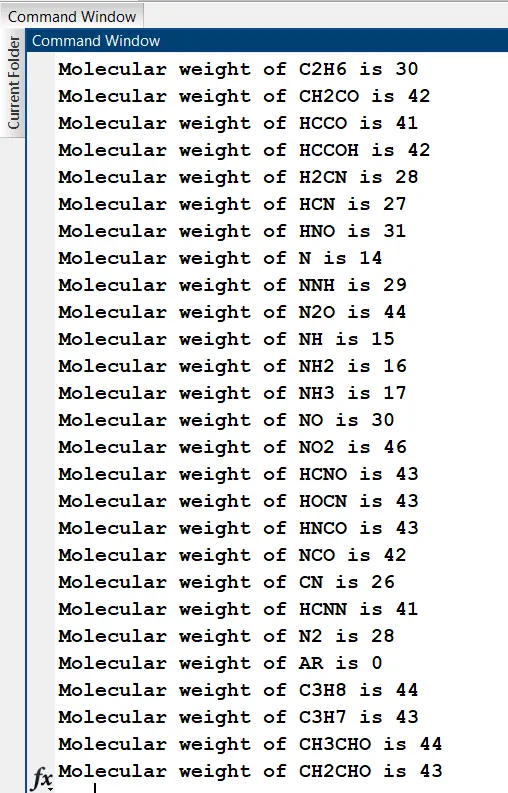
Disp cmd in line no. 50 is used to display the molecular weight in the command window
2. Coefficients Function
function [HTC,LTC,local_min_temp,local_mid_temp,local_max_temp,element]=coeff(species_no)

nasa = fopen('THERMO.dat','r');     %opening the data file
line_no = (species_no*4)+1;         %as each species is taking 4 line in the data file

%Skipping the lines above the reqiured species line
for i=1:line_no
    b=fgetl(nasa);
end

%Extracting data from individual line using K as reference for line
k = line_no+1:line_no+4;

for i=line_no+1:line_no+4;
b=fgetl(nasa);     %entering into the required line
    if i == k(1)   % to extract data from first line out of 4
        b = strsplit(b,' ');  %to split the string at spaces
        element = b(1);     %getting element name
        %to get local temperatures of the species
        local_min_temp=str2num(b{end-3}); local_mid_temp=str2num(b{end-1}); local_max_temp=str2num(b{end-2});
    end

    if i == k(2)    % to extract data from second line out of 4
       c= findstr(b,'E');    %to split the string at location of E
       %to get coefficients in this line
       c1 = b(1:c(1)+3);
       c2 = b(c(1)+4:c(2)+3);
       c3 = b(c(2)+4:c(3)+3);
       c4 = b(c(3)+4:c(4)+3);
       c5 = b(c(4)+4:c(5)+3);

       %converting string to number
       a1 = str2num(c1);
       a2 = str2num(c2);
       a3 = str2num(c3);
       a4 = str2num(c4);
       a5 = str2num(c5);
     end
     if i == k(3)     % to extract data from third line out of 4
       c=findstr(b,'E');    %to split the string at location of E
       %to get coefficients in this line
       c6 = b(1:c(1)+3);
       c7 = b(c(1)+4:c(2)+3);
       c8 = b(c(2)+4:c(3)+3);
       c9 = b(c(3)+4:c(4)+3);
       c10 = b(c(4)+4:c(5)+3);

      %converting string to number
       a6 = str2num(c6);
       a7 = str2num(c7);
       a8 = str2num(c8);
       a9 = str2num(c9);
       a10 = str2num(c10);
     end
     if i == k(4)       % to extract data from fourth line out of 4
       c=findstr(b,'E');      %to split the string at location of E
       %to get coefficients in this line
       c11 = b(1:c(1)+3);
       c12 = b(c(1)+4:c(2)+3);
       c13 = b(c(2)+4:c(3)+3);
       c14 = b(c(3)+4:c(4)+3);

       %converting string to number
       a11 = str2num(c11);
       a12 = str2num(c12);
       a13 = str2num(c13);
       a14 = str2num(c14);
     end
end
HTC = [a1,a2,a3,a4,a5,a6,a7];        %High temperature coefficients
LTC = [a8,a9,a10,a11,a12,a13,a14];   %Low temperature coefficients
end
Here, I used a formula line_no = (species_no*4)+1 as each species details are in 4 lines and a variable k is used to get details from individual line.
3. Thermal properties Function
function [Cp,S,H]=thermalproperties(HTC,LTC,LTR,local_mid_temp,local_high_temp,element,main_dir)

R = 8.134 ;    %Universal gas constant
counter = 0;   %To get the temperature difference between low and high
for i = 1:length(LTR)
if LTR(i) >= local_mid_temp
    %To calculate enthaply for high temperature range
    H(i) = R*LTR(i)*(HTC(1)+ HTC(2)*LTR(i)^1/2+ HTC(3)*LTR(i)^2/3+ HTC(4)*LTR(i)^3/4+ HTC(5)*LTR(i)^4/5+HTC(6)/LTR(i));
    %To calculate entropy for high temperature range
    S(i) = R*(HTC(1)*log(LTR(i))+ HTC(2)*LTR(i)^1+ HTC(3)*LTR(i)^2/2+ HTC(4)*LTR(i)^3/3+ HTC(5)*LTR(i)^4/4+HTC(7));
    %To calculate Specific heat for high temperature range
    Cp(i) = R*(HTC(1)+ HTC(2)*LTR(i)^1+ HTC(3)*LTR(i)^2+ HTC(4)*LTR(i)^3+ HTC(5)*LTR(i)^4);
else
    %To calculate enthaply for low temperature range
    H(i) = R*LTR(i)*(LTC(1)+ LTC(2)*LTR(i)^1/2+ LTC(3)*LTR(i)^2/3+ LTC(4)*LTR(i)^3/4+ LTC(5)*LTR(i)^4/5+LTC(6)/LTR(i));
    %To calculate entropy for low temperature range
    S(i) = R*(LTC(1)*log(LTR(i))+ LTC(2)*LTR(i)^1+ LTC(3)*LTR(i)^2/2+ LTC(4)*LTR(i)^3/3+ LTC(5)*LTR(i)^4/4+LTC(7));
    %To calculate Specific Heat for low temperature range
    Cp(i) = R*(LTC(1)+ LTC(2)*LTR(i)^1+ LTC(3)*LTR(i)^2+ LTC(4)*LTR(i)^3+ LTC(5)*LTR(i)^4);
    counter = counter + 1;
end
end

cd('Graphical Data');  %entering into graphical data folder from the current folder
mkdir([element{1}]);   %creating a folder name with species name
cd([element{1}])       %entering into the species folder inorder to save the plots of that species

element{2,1} = ('Specific heat(Cp)');   %Inorder to get the plot title in two lines

fh = figure(1);
fh.WindowState = 'maximized';      %to save the image in maximised view
%splitting the plot to get difference between low and high temperature
%ranges
plot(LTR(1:counter),Cp(1:counter),'b-','linewidth',2);
hold on
plot(LTR(counter:end),Cp(counter:end),'r-','linewidth',2);
hold off
grid on
ylabel('Specific Heat (Cp)');
xlabel('Local Temperature Range');
legend('Low Temp','High Temp','location','NW')
title([element],'FontName','Lucida Console');
saveas(figure(1),'Specific Heat','png');    %saving the plot in png format

element{2,1} = ('Entropy(S)');

fh = figure(2);
fh.WindowState = 'maximized';
plot(LTR(1:counter),S(1:counter),'b-','linewidth',2)
hold on
plot(LTR(counter:end),S(counter:end),'r-','linewidth',2)
hold off
grid on
ylabel('Entropy (S)');
xlabel('Local Temperature Range');
legend('Low Temp','High Temp','location','NW');
title([element],'FontName','Lucida Console');
saveas(figure(2),'Entropy','png');

element{2,1} = ('Enthalpy(H)');     %Inorder to get the plot title in two lines

fh = figure(3);
fh.WindowState = 'maximized';
plot(LTR(1:counter),H(1:counter),'b-','linewidth',2)
hold on
plot(LTR(counter:end),H(counter:end),'r-','linewidth',2)
hold off
grid on
ylabel('Enthalpy (H)');
xlabel('Local Temperature Range');
legend('Low Temp','High Temp','location','NW');
title([element],'FontName','Lucida Console');
saveas(figure(3),'Enthalpy','png');

cd(main_dir);      %returing to main directory after completing a species

end
As per the formulas shown above the values of Cp, H & S are calculated.
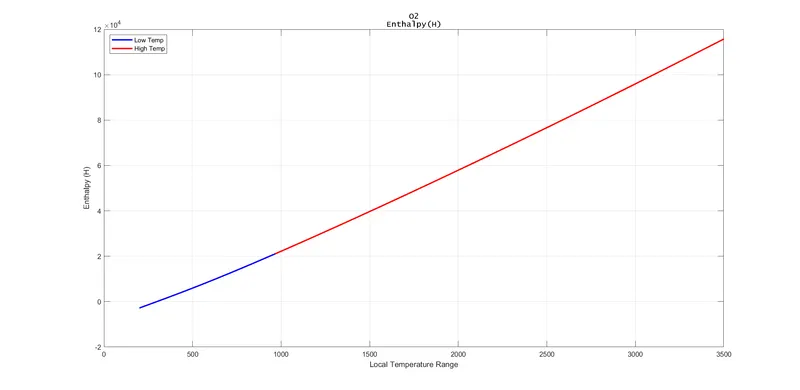
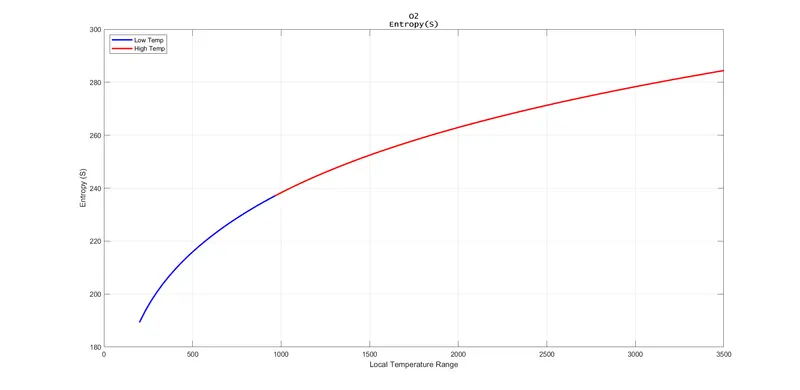
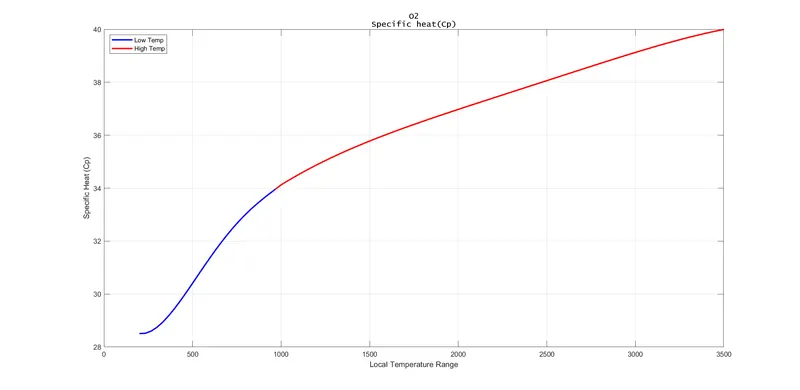
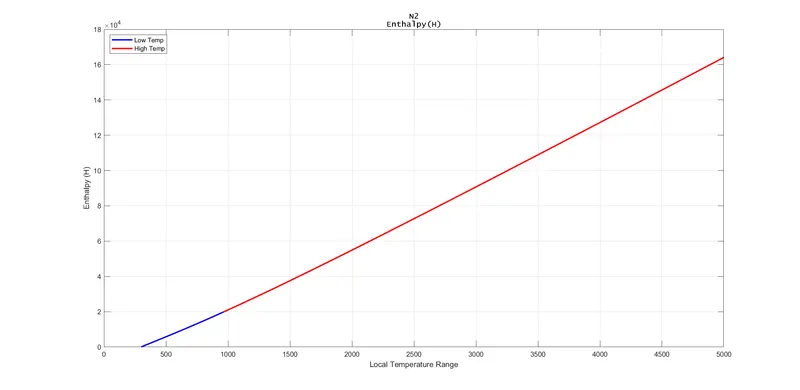
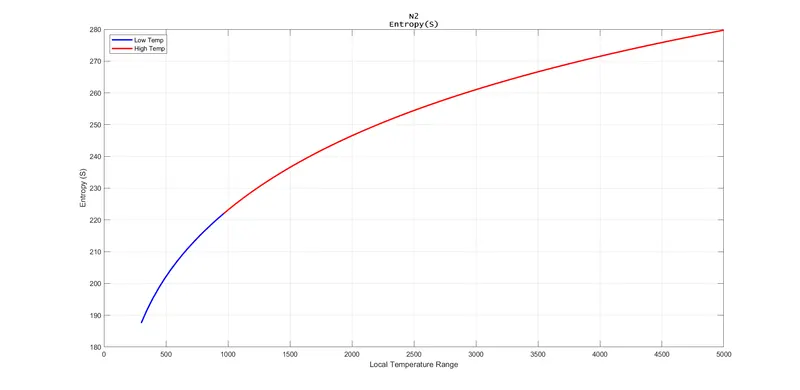
Here, I have used a variable to show the difference in low temperature values and high temperature values. So the plot is split into two 1: counter and counter:end.
To save the plots in maximized view I have used fh.WindowState = 'maximized' cmd and created a 2x1 cell to get the plot title in two lines
4. Molecular Weight Function
function [w] = molecular_weight(element)

%Finding molecular weight
% H_mw = 1; C_mw = 12; N_mw = 14; O_mw = 16; Ar_mw = 39.948;
element_name = ["H","C","N","O","Ar"];
element_weight = [1,12,14,16,39.948];
m.weight =0;     %assigning the initial value
for i = 1:length(element)
    for j = 1:length(element_weight)
if strcmpi( element(i),element_name(j))    %comparing two strings
    m.weight = element_weight(j) + m.weight;
    position = j;       %storing the position of J in a variable
end
    end
number = str2double(element(i));     %converting string to number
if number > 1
    m.weight = m.weight + (element_weight(position)*(number-1));
end
end
w = m.weight;

end
Firstly, we need to create two arrays one with chemical formula and other with its atomic weight respectively. Consider initial molecular weight as 0.
Now, for a given species we need to pick individual character from it and compare it with the predefined elements chemical formula to get its atomic weight using strcmpi cmd.
If the given character matches with predefined once, then its weight is added to the molecular weight which is initially 0. If there is any number instead of a letter then the molecular weight is that number times the atomic weight. But the problem in here is everything in here is in string format.
So if the output of str2double (which converts string to number) gives Nan as output then that character in that position is not a number but if it gives a number then that number minus 1 is multiplied to the previous character atomic weight which will be final molecular weight.
Outputs:
1.Output folders with appropriate names to it
2. Molecular Weight of individual species
3. Graphical plots of O2
4. Graphical plots of N2
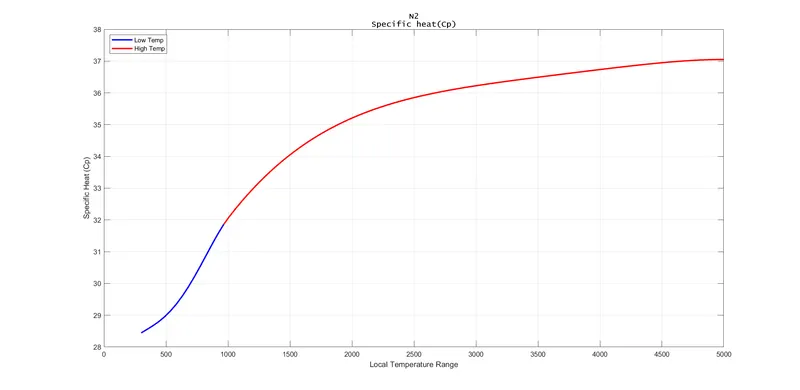
5. Graphical plots of CO2