Project 1 - Parsing NASA thermodynamic data

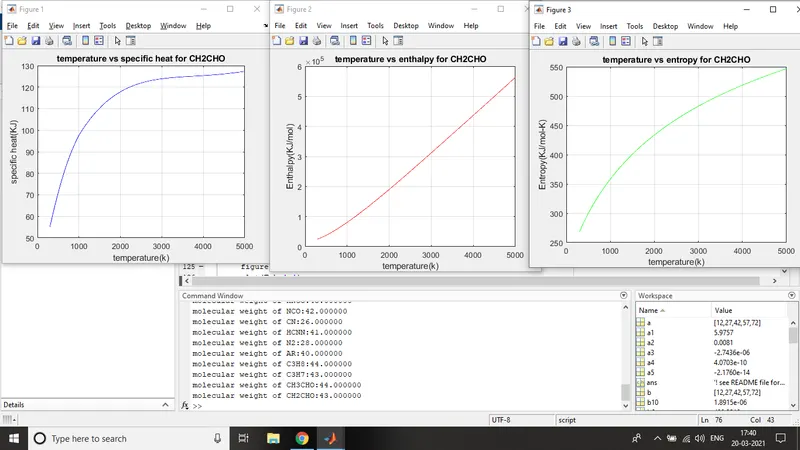
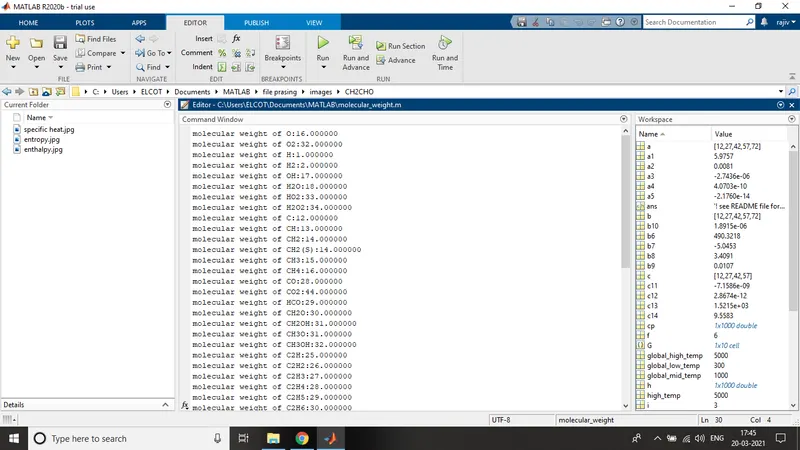
Main program

    clear all
    close all
    clc

    %reading the file
    f = fopen('THERMO.dat','r');
    line1 = fgetl(f);

    %reading global temperature
    temp = fgetl(f);

    %split the str on temp
    T = strsplit(temp,' ');

    global_low_temp = str2double(T{2});%str2double converts a character array or string scalar to a numeric matrix
    global_mid_temp = str2double(T{3});
    global_high_temp = str2double(T{4});

    %skip commands
    for i = 1:3
        fgetl(f);
    end


    %universal gas constant
    R = 8.3145; %j/mol-k

    %reading all lines individualy
    for j = 1:53
        tline = fgetl(f);
        G = strsplit(tline,' ');
        lines = (G{1});

        %global temperature for each line
        low_temp = str2double(G{end-3});
        high_temp = str2double(G{end-2});
        mid_temp = str2double(G{end-1});

        %read the first line of temperature coefficient values
        tline1 = fgetl(f);
        a = strfind(tline1,'E'); %searches the longer of the two input arguments for any occurrences of the shorter argument
        %read the second line of temperature coefficient values
        tline2 = fgetl(f);
        b = strfind(tline2,'E');
        %read the second line of temperature coefficient values
        tline3 = fgetl(f);
        c = strfind(tline3,'E');


        %conveting string to numbers for line1
        a1 = tline1(1:a(1)+3);
        a1 = str2double(a1);
        a2 = tline1(a(1)+4:a(2)+3);
        a2 = str2double(a2);
        a3 = tline1(a(2)+4:a(3)+3);
        a3 = str2double(a3);
        a4 = tline1(a(3)+4:a(4)+3);
        a4 = str2double(a4);
        a5 = tline1(a(4)+4:a(5)+3);
        a5 = str2double(a5);


        %conveting string to numbers for line2
        b6 = tline2(1:b(1)+3);
        b6 = str2double(b6);
        b7 = tline2(b(1)+4:b(2)+3);
        b7 = str2double(b7);
        b8 = tline2(b(2)+4:b(3)+3);
        b8 = str2double(b8);
        b9 = tline2(b(3)+4:b(4)+3);
        b9 = str2double(b9);
        b10 = tline2(b(4)+4:b(5)+3);
        b10 = str2double(b10);


        %conveting string to numbers for line3
        c11 = tline3(1:c(1)+3);
        c11= str2double(c11);
        c12 = tline3(c(1)+4:c(2)+3);
        c12= str2double(c12);
        c13 = tline3(c(2)+4:c(3)+3);
        c13= str2double(c13);
        c14 = tline3(c(3)+4:c(4)+3);
        c14= str2double(c14);

        %fix the range of temperature
        T = linspace(low_temp,high_temp,1000);

        %to get array of specific heat, enthalpy and entropy
        for n = 1:length(T)
        %consider high temperature coefficients as a1 to b7 and
                 %low temperaturecoefficients as b8 to c14
     if T(n)>mid_temp
         %high temperature coefficients
         cp(n) = (a1+a2.*T(n)+ a3.*T(n).^2+a4.*T(n).^3+a5.*T(n).^4)*R;

         h(n) = (a1+(a2.*T(n))/2+(a3.*T(n).^2)/3+(a4.*T(n).^3)/4+(a5.*T(n).^4)/5+(b6./T(n)))*R.*T(n);

         s(n) = (a1.*log(T(n))+a2.*T(n)+(a3.*T(n).^2)/2+(a4.*T(n).^3)/3+(a5.*T(n).^4)/4+b7)*R;

     else
         %low temperature coefficients
         cp(n) = (b8+b9.*T(n)+ b10.*T(n).^2+c11.*T(n).^3+c12.*T(n).^4)*R;

         h(n) = (b8+(b9.*T(n))/2+(b10.*T(n).^2)/3+(c11.*T(n).^3)/4+(c12.*T(n).^4)/5+(c13./T(n)))*R.*T(n);

         s(n) = (b8.*log(T(n))+b9.*T(n)+(b10.*T(n).^2)/2+(c11.*T(n).^3)/3+(c12.*T(n).^4)/4+c14)*R;

     end
        end


        %ploting temperature vs specific heat
        figure(1);
        plot(T,cp,'b');
        grid on
        xlabel('temperature(k)');
        ylabel('specific heat(KJ)');
        title(sprintf('temperature vs specific heat for %s',lines));%sprinf is the formatspec operation to get result in string


        %ploting temperature vs enthalpy
        figure(2);
        plot(T,h,'r');
        grid on
        xlabel('temperature(k)');
        ylabel('Enthalpy(KJ/mol)');
        title(sprintf('temperature vs enthalpy for %s',lines));


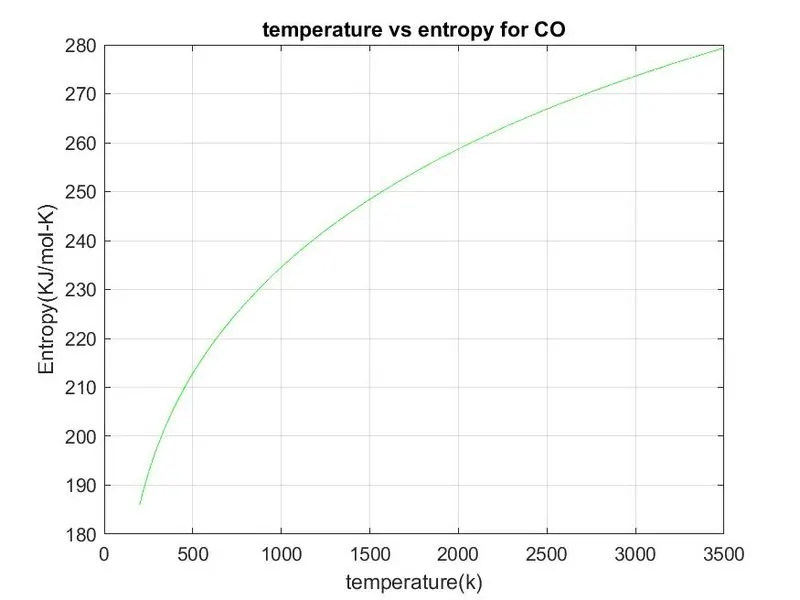
        %ploting temperature vs entropy
        figure(3);
        plot(T,s,'g');
        grid on
        xlabel('temperature(k)');
        ylabel('Entropy(KJ/mol-K)');
        title(sprintf('temperature vs entropy for %s',lines'));


        %to read molecular weight file
        m = molecular_weight(lines);

        %create folder
        mkdir(['C:\Users\ELCOT\Documents\MATLAB\file prasing\images\',lines]);

        %changing the directory and save the file
        cd(['C:\Users\ELCOT\Documents\MATLAB\file prasing\images\',lines]);


        %save all figures into respective folders
        saveas(figure(1),'specific heat','jpg');
        saveas(figure(2),'enthalpy','jpg');
        saveas(figure(3),'entropy','jpg');
    end


Calculation of molecular weight

    %function of mecular weight
    function m = molecular_weight(lines)


    %define atom and atomic weight
    atoms = ['H','C','N','O','A'];
    atomic_weight = [1, 12, 14, 16,40];
    m = 0;

    %compare atom to read data
    for i =1:length(lines)
        for j=1:length(atoms)
            if strcmp(lines(i),atoms(j))
                m = m+atomic_weight(j);
                a = j;
            end
        end
        n = str2double(lines(i));
        if n>1
            m = m+atomic_weight(a)*(n-1);
        end
    end


    %display molecular weight into command window
    fprintf('molecular weight of %s:',lines);
    fprintf('%f',m);
    disp(' ')
end 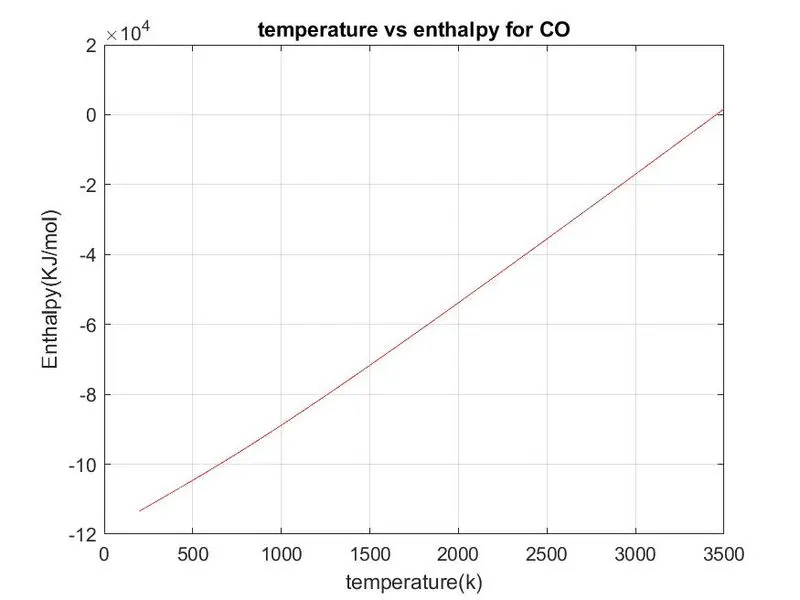
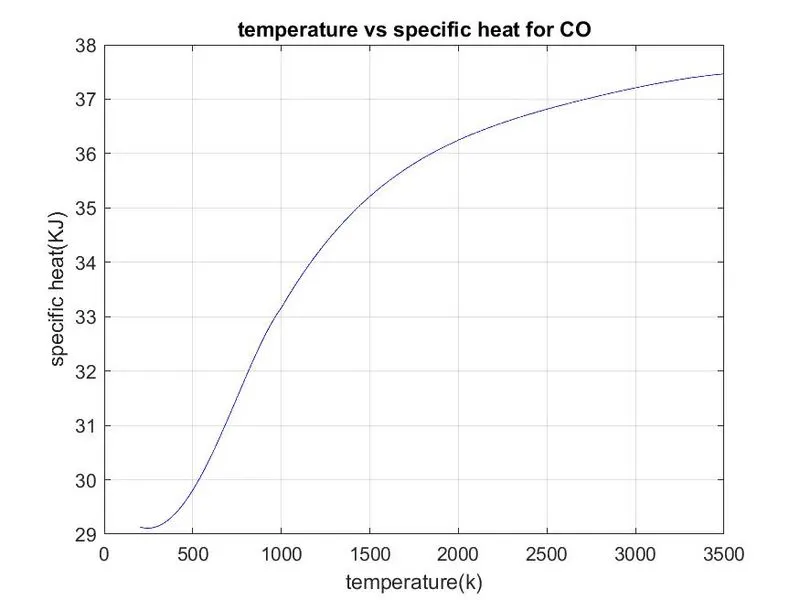
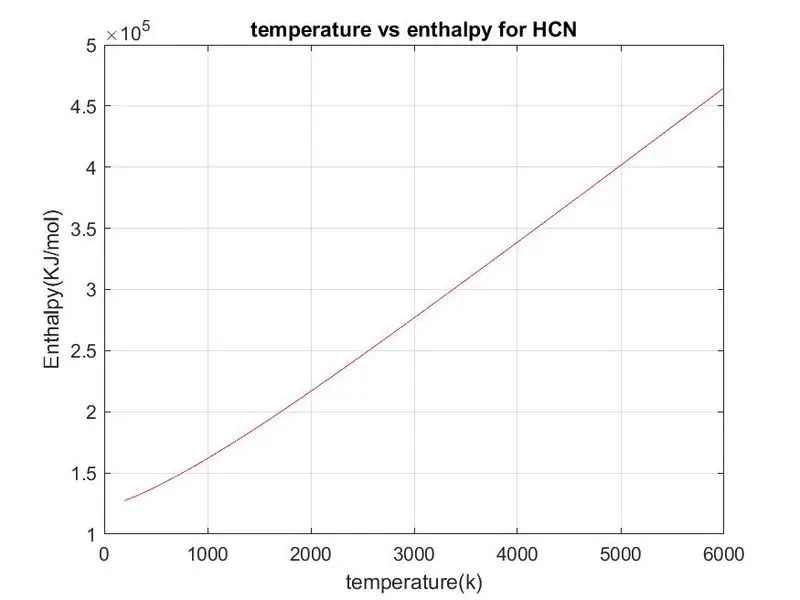
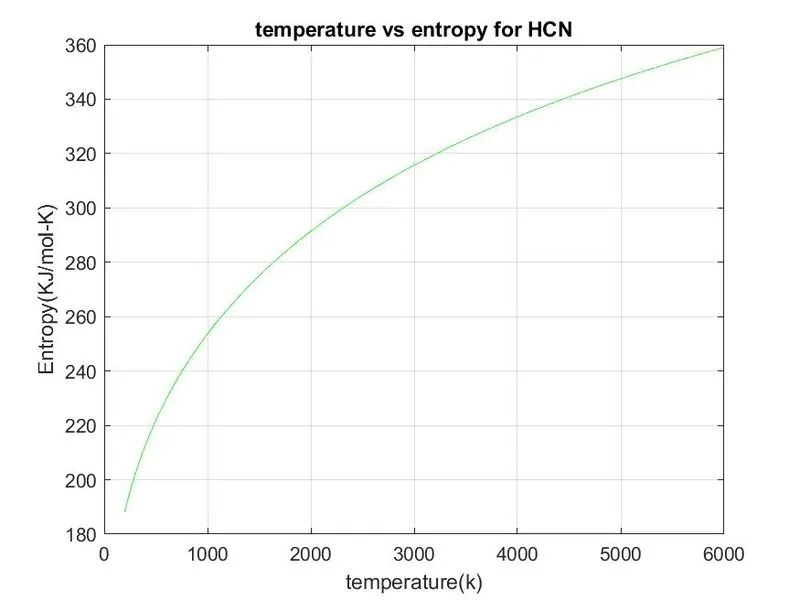
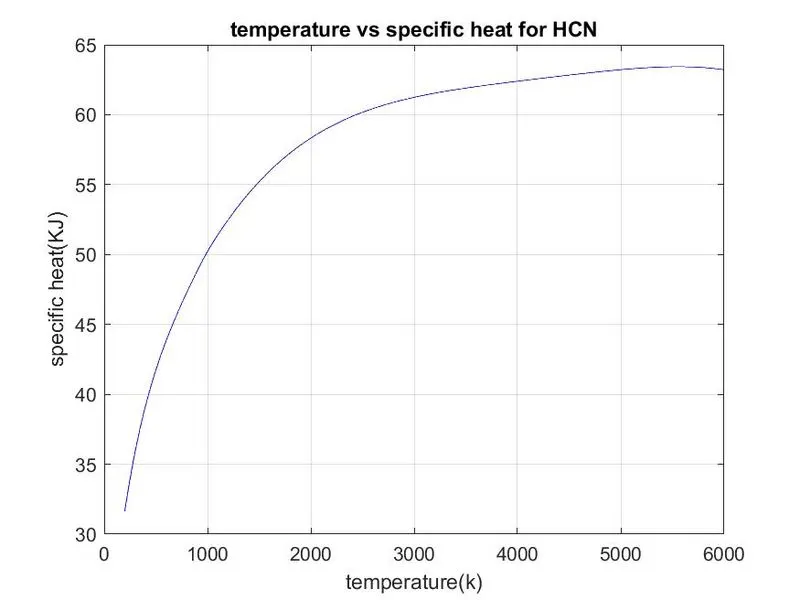

Code Explanation:-
1. The program starts with clear all, close all, clc with clear workspace respectively
2. in next step need to open nasa thermostat file using fopen command and readt the file using letter 'r'
3. using fgetl command to extract each line of the file to command windpw
4. the filrst line of header information follwed by global temperature values
5. and next three lines are commands ingnore that using for loop
6. after that we have 53 species (i mentioned in prodram as lines) and 14 coefficients are extracted using for loop
7. first fgetl command is used to get species(lines) name
8. next three of fgetl is used to extract the coefficients
9. and next use command strfind to locate letter 'E'(exponential) which is used to refer the values of coefficient
10. the strings are convereted into numbers by using str3double command.
11. after that fix the temperature range for calculate cp, h, s uisng linespace command
12. calculate the enthalpy, entropy, specific heat by using the formula which is shown in the video
13. using for loop to get array of cp,h,s and fix the low temperature and high temperature coefficient ranges
14. and make plots for cp, h, s with respecive lables and titles
15. to read the molecular weight data write subfunction program for molecular weight
16. in that function define atom and its atomic weight and compare the atom to read molecular weight data and display that molecular weight into command window using fprintf and disp command and after that call the function in main program
17. and create file directory to save the plots and the directory changing back for molecular weight calculation
18. save the figures into respective folders by using saveas command(figurename,format)
19. close the for loop using end and run program