Project 1 - Parsing NASA thermodynamic data
AIM
1. Write a function that extracts the 14 co-efficients and calculates the enthalpy, entropy and specific heats for all the species in the data file.
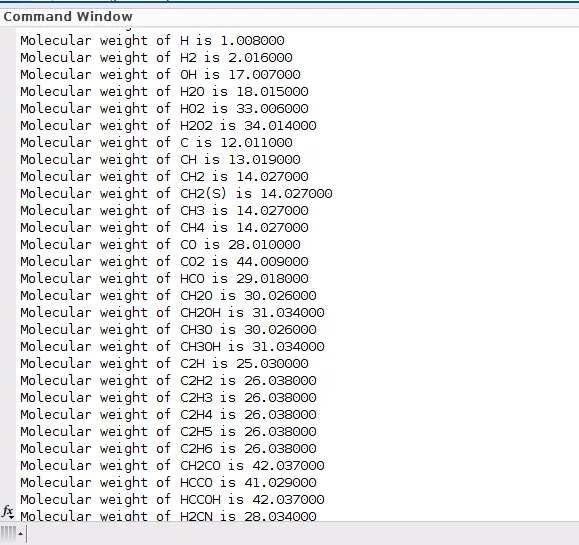
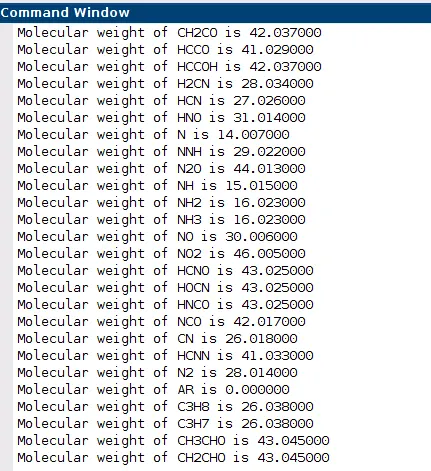
2. Calculate the molecular weight of each species and display it in the command window.
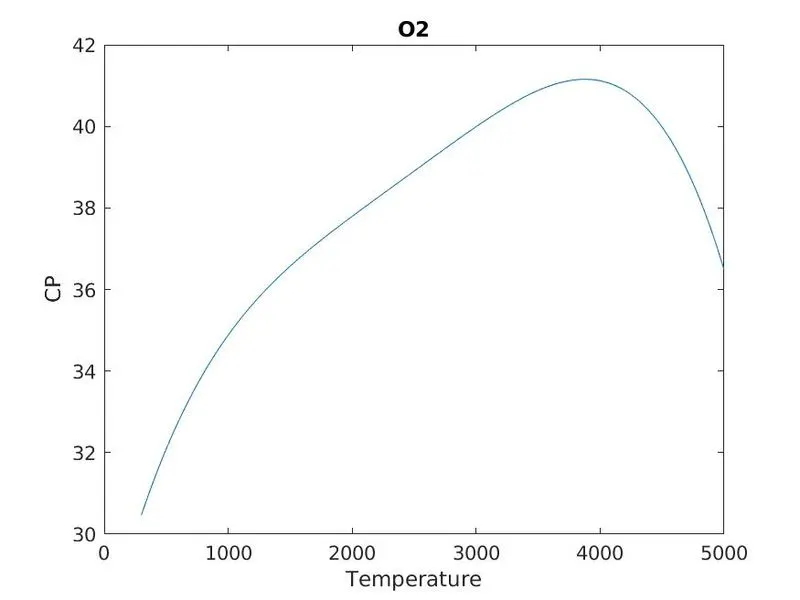
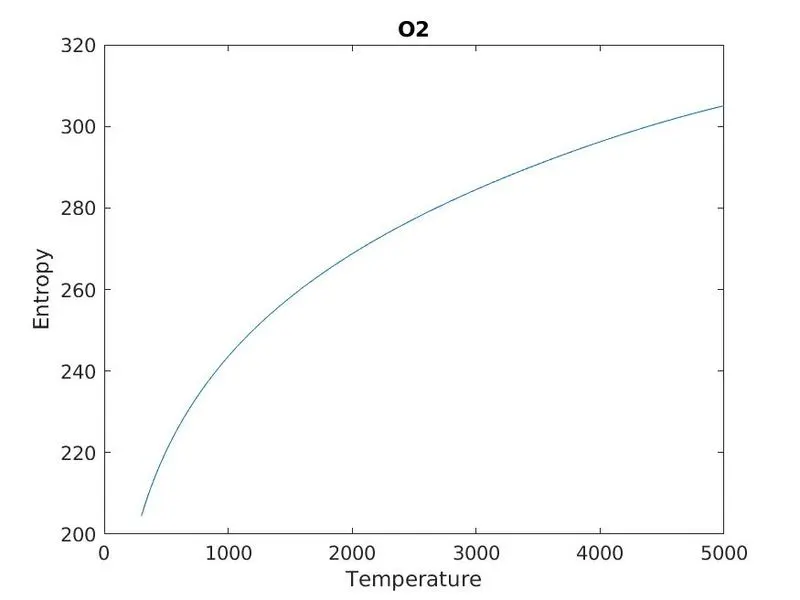
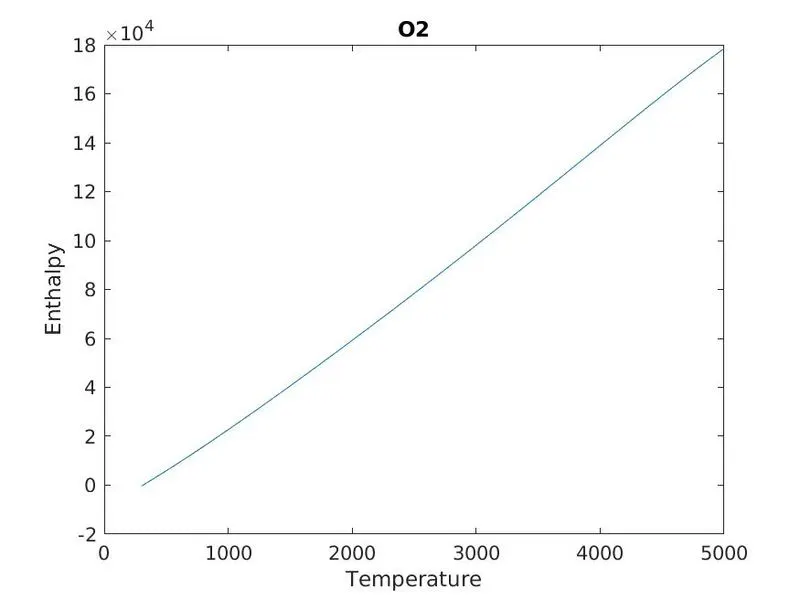
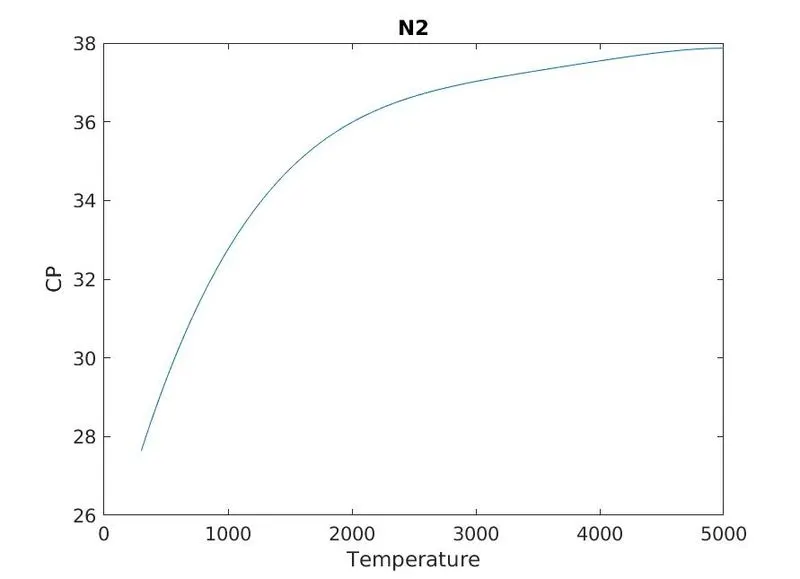
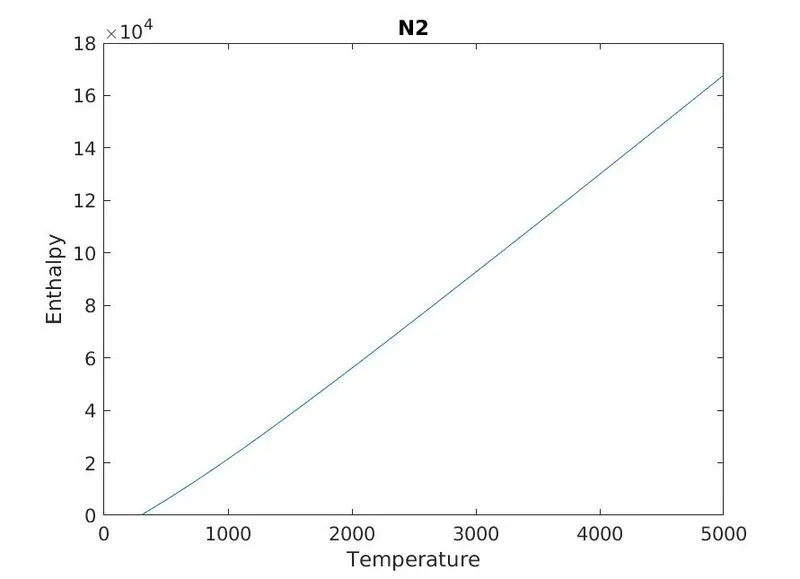
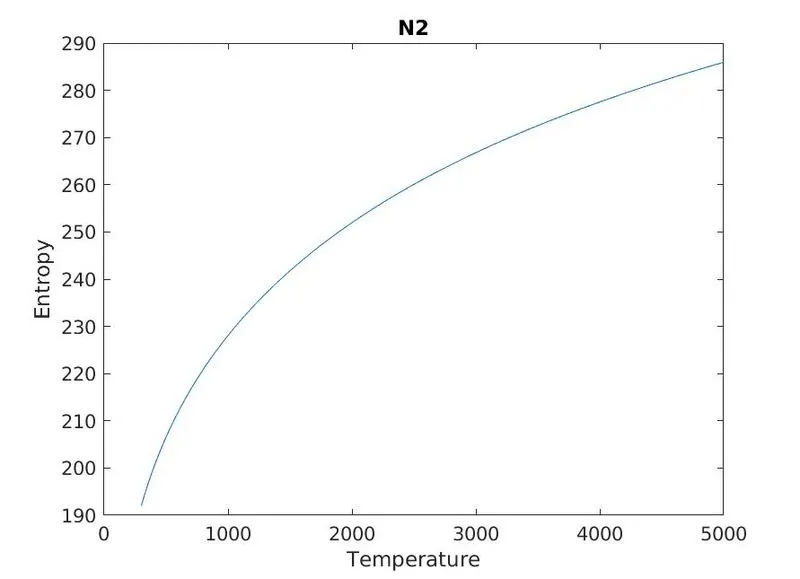
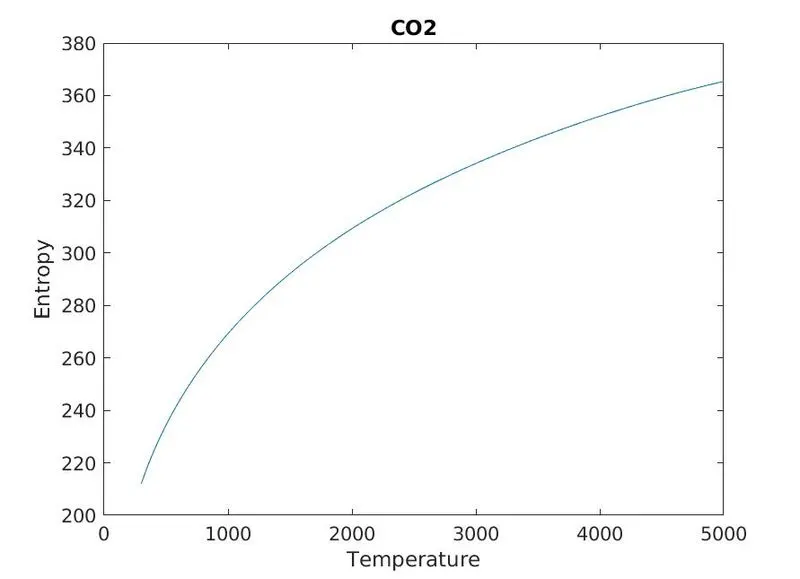
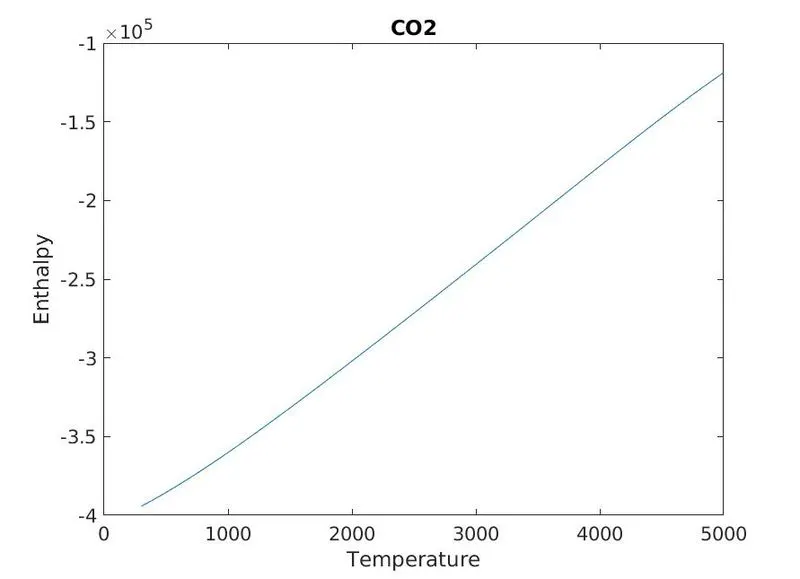
3. Plot the Cp, Enthalpy and Entropy for the local temperature range (low temperature : high temperature) specific for each species.
4. Plots for o2, N2 and Co2 species (your program should be case insensitive, if it is going to take the species name as an input).
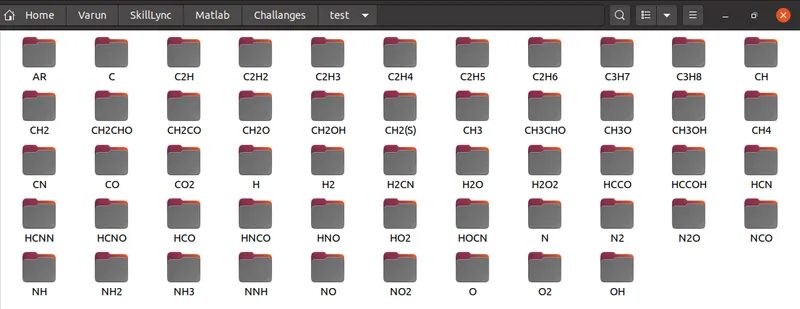
5. Save the plots as images with appropriate names and dump them in separate folders for each species with suitable name. All these should be generated automatically.
Explaination of code.
- Code contain 1 main program file and 3 files with functions caluclating Molecular weight, CP , entropy, enthalpy.
- Main pogram first open the file and read first two line. First line is ignored and from second line extract high , mid and low temperature values.
- Next three lines are ignored.
- A while loop is created which runs till eof is reached.
- In the while loop first line is read and species name is extracted.
- Next for loop iterates and read the next three lines which is the high and low coefficients. Strfind , strcmp and str2num is used for this
- For each line of species split the string and get each coefficient. length exponential valie is used to find the start of each coeffiicient value in a line.
- One each coefficient value is found the same is passed to CP , Entropy and Enthalpy functions to run the function.
- CP Enthalpy and entripy functions are straight fowarded and coded to execute the standard function.
- Molecular weight function has a map of elements and their values.
- A for loop iterates through the species name character by character . For each charatcter it gets the element values and adds it. For those with '2' in their species name previosu character is added twice.
- For saving the plot cd to a directory is done and figures are saved using saveas function
Thermodynamic.m ( main program )
close all
clear all
clc

f = fopen('THERMO.dat', 'r');
fline = fgetl(f);

gtempline = fgetl(f);
gtemp = strsplit(gtempline);
gtemp_low = str2num(gtemp{2});
gtemp_med = str2num(gtemp{3});
gtemp_high = str2num(gtemp{4});
temp=linspace(gtemp_low,gtemp_high,1000);

fgetl(f);
fgetl(f);
fgetl(f);
curDir = pwd;
curDir2 = pwd;

EXPLEN = 3;

%for i = 1:217
    %disp(i);
i = 1;
while ~feof(f)
    speciesLine = fgetl(f);
    speciesValue = strsplit(speciesLine, ' ');
    speciesName = (speciesValue{1});
    %disp(speciesName)
    if(strcmp(lower(speciesName),'end'))
       break
    end
    b = 0;
    index = 1;
    for k = 1: 3
        %fprintf('k=%d',k);
        coeffline = fgetl(f);
        if (feof(f))
            continue
        end
        if (strcmp(coeffline,''))
            continue
        end
        %disp("-----");
        %disp(coeffline);
        expPos = strfind(lower(coeffline), 'e');
        val(index)=str2num(coeffline(1:expPos(1)+EXPLEN));
        index = index+1;
        b = 0;
        for j = 1: length(expPos)-1
            %fprintf('j=%d',j);
            val(index)=str2num(coeffline(expPos(j)+EXPLEN+1:expPos(j+1)+EXPLEN));
            index = index +1;
        end
    end

    cd(curDir);
    mkdir(speciesName);
    cd (speciesName);

    %disp(val(1));
    figure(i);
    cp = CP(val, temp,8.314, gtemp_med);
    plot(temp,cp);
    title(speciesName);
    xlabel('Temperature');
    ylabel('CP');
    saveas(figure(i), strcat('CP','-',speciesName,'.jpg'));

    figure(i);
    entp = Enthalpy(val, temp,8.314, gtemp_med);
    plot(temp,entp);
    title(speciesName);
    xlabel('Temperature');
    ylabel('Enthalpy');
    saveas(figure(i), strcat('Enthalpy','-',speciesName,'.jpg'));

    figure(i);
    entrp = Entropy(val, temp,8.314, gtemp_med);
    plot(temp,entrp);
    title(speciesName);
    xlabel('Temperature');
    ylabel('Entropy');
    saveas(figure(i), strcat('Entropy','-',speciesName,'.jpg'));

    weight = MolecularWeight(lower(speciesName));
    i = i +1;
    fprintf("Molecular weight of %s is %f \n",speciesName,weight);

end

curDir = curDir2;
Enthalpy.m ( function to calculate entalpy)
function EnthalpyVal = Enthalpy(coeff,temp,R,gMediumTemp)
    if  temp <= gMediumTemp
        EnthalpyVal = R*temp.*(coeff(8) + (coeff(9)*temp)/2 + (coeff(10)*(temp).^2)/3 + (coeff(11)*(temp).^3)/4 + (coeff(12)*(temp).^4)/5 + (coeff(13)./temp));
    else
        EnthalpyVal = R*temp.*(coeff(1) + (coeff(2)*temp)/2 + (coeff(3)*(temp).^2)/3 + (coeff(4)*(temp).^3)/4 + (coeff(5)*(temp).^4)/5 + (coeff(6)./temp));
    end
CP.m ( function to calculate CP value)
function cpVal = CP(coeff,temp,R,gMediumTemp)
    if  temp <= gMediumTemp
        cpVal = R*(coeff(8) + (coeff(9)*temp) + (coeff(10)*(temp).^2) + (coeff(11)*(temp).^3) + (coeff(12)*(temp).^4));
    else
        cpVal = R*(coeff(1) + (coeff(2)*temp) + (coeff(3)*(temp).^2) + (coeff(4)*(temp).^3) + (coeff(5)*(temp).^4));
    end
Entropy.m ( function to calculate Entropy)
function Entropyval = Entropy(coeff,temp,R,gMediumTemp)
    if  temp <= gMediumTemp
        Entropyval = R.*(coeff(8).*log(temp) + (coeff(9).*temp) + (coeff(10)*(temp).^2)/2 + (coeff(11)*(temp).^3)/3 + (coeff(12)*(temp).^4)/4 + coeff(14));
    else
        Entropyval = R.*(coeff(1).*log(temp) + (coeff(2).*temp) + (coeff(3)*(temp).^2)/2 + (coeff(4)*(temp).^3)/3 + (coeff(5)*(temp).^4)/4 + coeff(7));
    end
MolecularWeight.m ( function to calculate molecular weight)
function weigth = MolecularWeight(name)

    keySet = {'h','c','o','n', 'ar'};
    valueSet = [1.008,12.011,15.999,14.007,39.948];
    M = containers.Map(keySet,valueSet);
    weigth = 0;
    %disp(name);
    for i = 1: length(name)
      if(isKey(M,name(i)))
        weigth = weigth + M(name(i));
      elseif str2num(name(i)) > 0
        weigth = weigth + M(name(i-1));
      end
    end

      %disp(weigth );

end
Plots for O
Plots for N2
Plots for CO2
Screen shot of folders with plots saved ( same attached also )
Molecular weight in command prompt , screenshot