Project 1 - Parsing NASA thermodynamic data
AIM:
To write a code in MATLAB to parse NASA’s Thermodynamic data file and to calculate the thermodynamic properties of various species.
OBJECTIVES:
- To write a program to file parsing from NASA Thermodynamic Data and extract 14 coefficients and to calculate the enthalpy, entropy, specific hear for all the species in the data file.
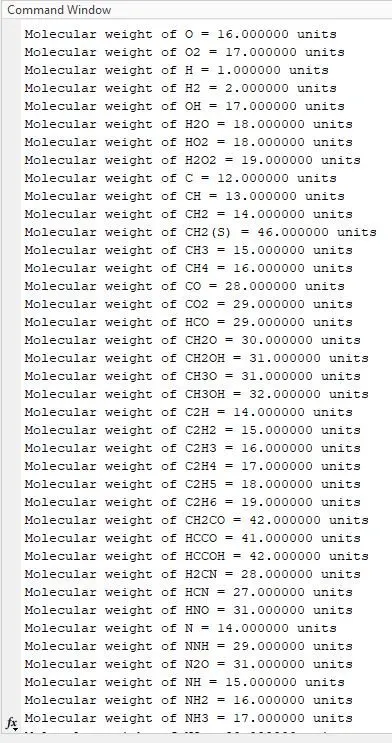
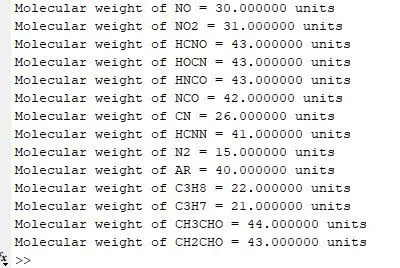
- Molecular weight calculation of all the species.
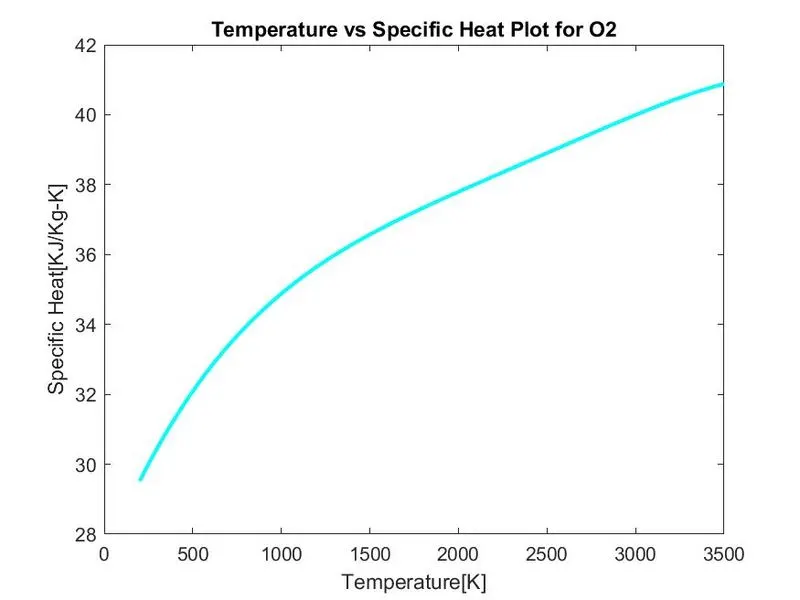
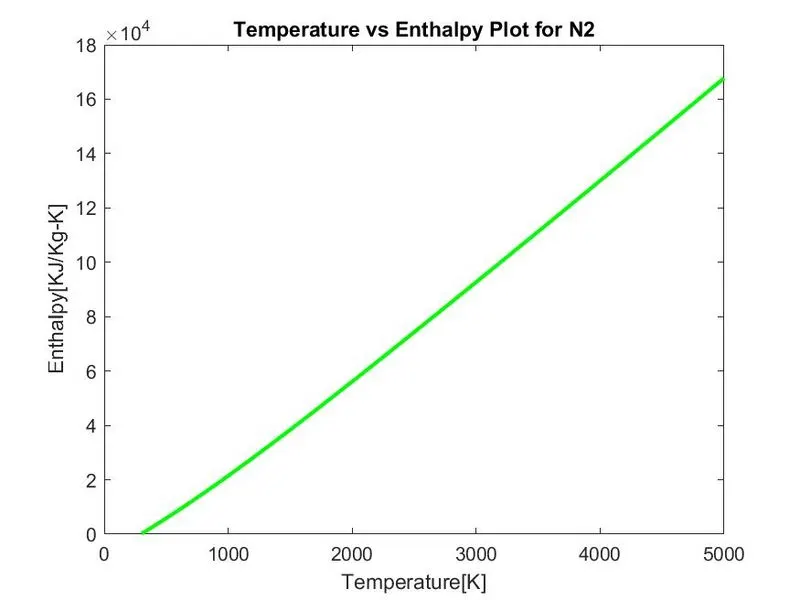
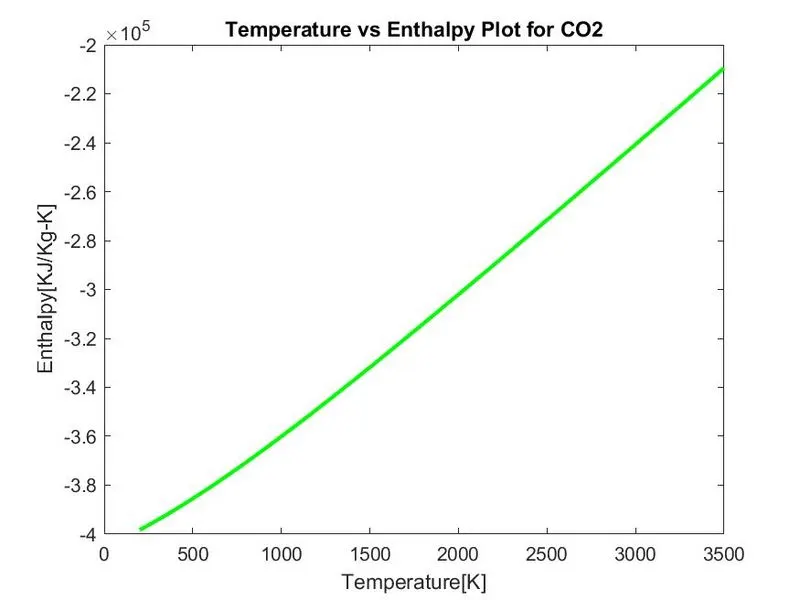
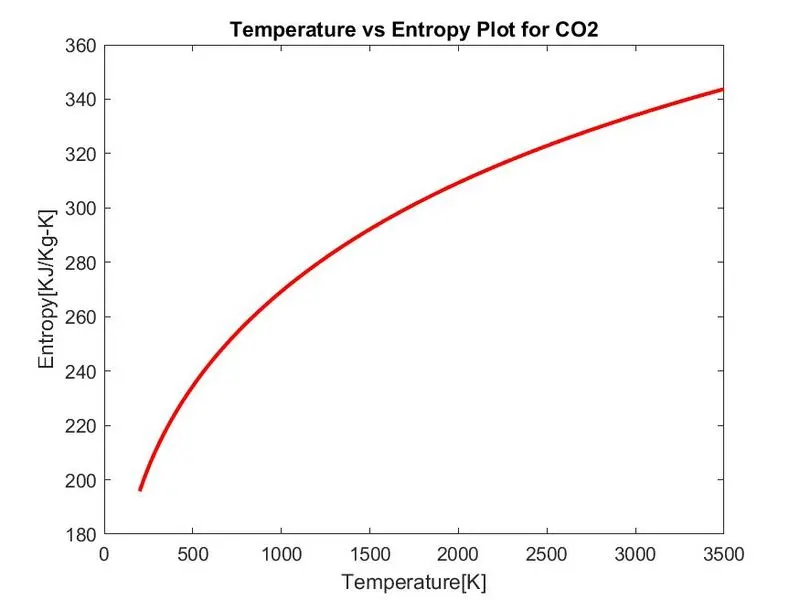
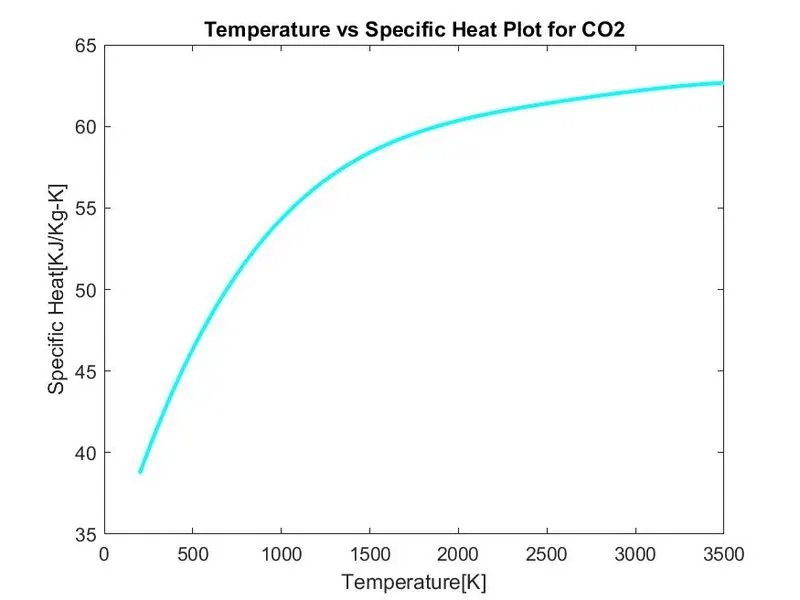
- To plot the specific heat, enthalpy and entropy for the local temperature range(i.e. low temperature range: high temperature range) for each species.
- To save all the plots with appropriate names and to dump them in specific folders for each species which should be performed automatically.
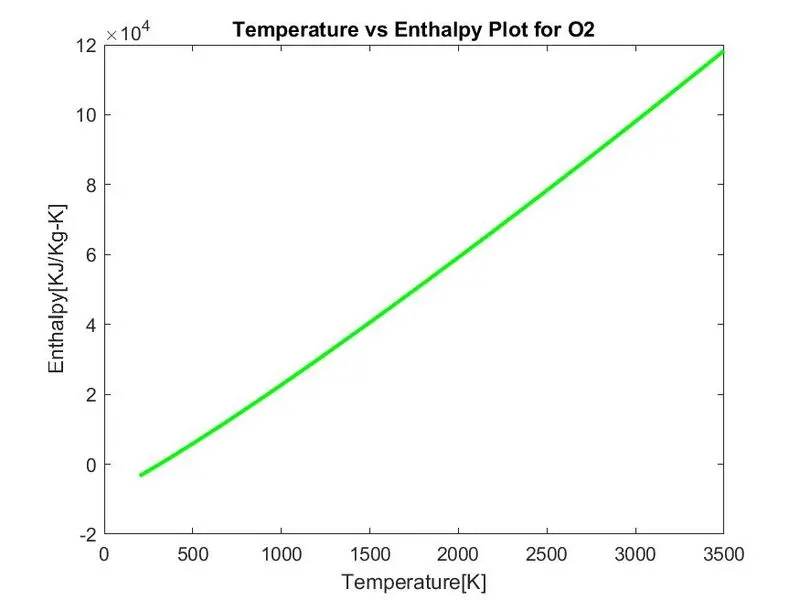
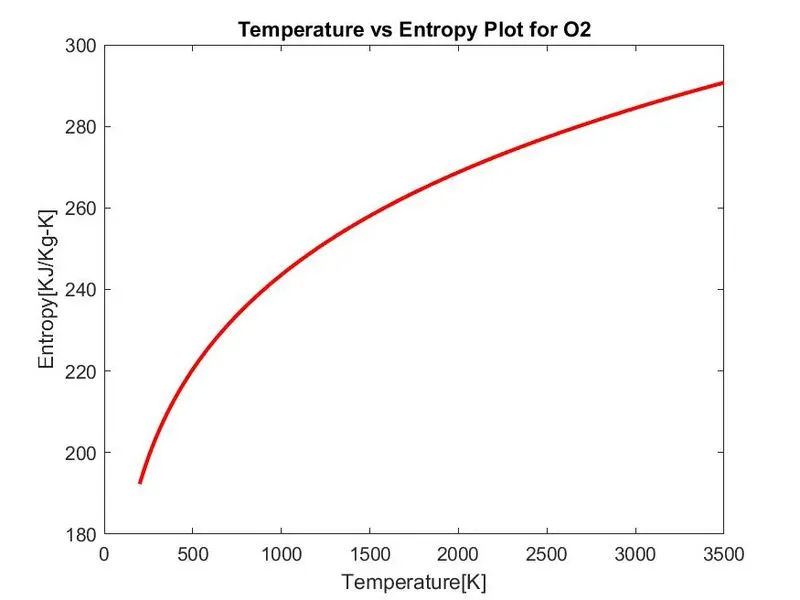
- To show the screenshot of the folders and to show the plots of O2,N2 and CO2 species in the report.
GOVERNING EQUATIONS:
Specific Heat:
The specific heat is the amount of heat per unit mass required to raise the temperature by one degree Celsius.
`C_p/R=a1+a2.T+a3.T^2+a4.T^3+a5.T^4`
Enthalpy:
The sum of the internal energy and the product of the pressure and volume of a thermodynamic system.
`H/(RT)=a1+a2.T/2+a3.T^2/3+a4.T^3/4+a5.T^4/5+(a6)/T`
Entropy:
The measure of a system’s thermal energy per unit temperature that is unavailable for doing useful work.
`S/R=a1.lnT+a2.T+a3.T^2/2+a4.T^3/3+a5.T^4/4+a7`
Where R is the universal gas constant, T is the temperature.
BODY:
Code Explanation:
- To extract the coefficient data from ‘THERMO.dat’ file fopen and fgetl commands are used for file parsing.
- The ‘fopen’ command is used to open the file and reading command is given ‘r’ to read the data from the file.
- The ‘fgetl’ command is used to read the data line by line.
- The first line of the data is header and ‘fgetl’ is used. The second line contains the global temperature ranges using the ‘fgetl’ command and is assigned to a variable. It is represented as a string variable and we need to convert it to number in order to do various operations using it.
- The ‘strsplit’ command is used to split the string with a delimiter ‘(space)’ and it separated the values of low, mid and high temperatures.
- As the next three lines are comments ‘fgetl’ command is used without assigning to any variables
- To extract data from all the different species(53), ‘for’ loop is used for the length of number of species.
- The first line of the species data is read using ‘fgetl’ command and ‘strsplit’ to split the line. The name of the species are extracted as first string and the length of the line is saved as a variable.
- The ‘str2num’ is used to extract the temperature values. Then three more lines extracted as it contains the 14 coefficients.
- The molecular weight calculation is performed using the elements provided and their atomic weights. A ‘for’ loop is used to calculate along with ‘strcmpi’ is used as the strings been compared are case sensitive. The respective molecular weights of the species are shown as output.
- Another ‘for’ loop is used to calculate the thermodynamic properties. It is used to calculate for each species for both low and high temperature ranges.
- A folder is created using ‘mkdir’ command to automatically create and save the folders for different species in a single place. ‘cd’ command is used for changing directory.
- The plots are plotted and saved and the loop is ended along with the file.
CODE:
% Parsing NASA thermodynamic data
clear all                                                    % Clear the Workspace
close all                                                    % Clear all figures and plot
clc                                                          % Clear the Command Window

% Loading the file
File_Parsing = fopen('THERMO.dat','r');

% Reading line 1
Header = fgetl(File_Parsing);

% Reading line 2
Global_temp = fgetl(File_Parsing);

% Split this string line by space
C = strsplit(Global_temp,' ');

% Split the line and save it in cell array as a string
global_low_temp = str2double(C{2});
global_mid_temp = str2double(C{3});
global_high_temp = str2double(C{4});

% Lines 3,4,5 are skipped as they are comments
fgetl(File_Parsing);
fgetl(File_Parsing);
fgetl(File_Parsing);

% Species Evaluation
for i=1:53

    line1 = fgetl(File_Parsing);

    Prop_Species = strsplit(line1,' ');
    Name_Species = (Prop_Species{1});
    L = length(Prop_Species);

    % Local temperature values
    local_low_temp  = str2num(Prop_Species{L-3});
    local_mid_temp  = str2num(Prop_Species{L-1});
    local_high_temp = str2num(Prop_Species{L-2});

    % Coefficients
    line2 = fgetl(File_Parsing);

    a = findstr(line2,'E');
    a1 = str2num(line2(1:a(1)+3));
    a2 = str2num(line2(a(1)+4:a(2)+3));
    a3 = str2num(line2(a(2)+4:a(3)+3));
    a4 = str2num(line2(a(3)+4:a(4)+3));
    a5 = str2num(line2(a(4)+4:a(5)+3));

    line3 = fgetl(File_Parsing);

    b = findstr(line3,'E');
    b1 = str2num(line3(1:b(1)+3));
    b2 = str2num(line3(b(1)+4:b(2)+3));
    b3 = str2num(line3(b(2)+4:b(3)+3));
    b4 = str2num(line3(b(3)+4:b(4)+3));
    b5 = str2num(line3(b(4)+4:b(5)+3));

    line4 = fgetl(File_Parsing);

    c = findstr(line4,'E');
    c1 = str2num(line4(1:c(1)+3));
    c2 = str2num(line4(c(1)+4:c(2)+3));
    c3 = str2num(line4(c(2)+4:c(3)+3));
    c4 = str2num(line4(c(3)+4:c(4)+3));


   % Molecular weight calculation
   Element = ['H','C','N','O','S','A'];
   Weight = [1,12,14,16,32,40];
   Molecular_weight = 0;

   for k = 1: length(Name_Species)
       for j = 1:length(Element)
           if strcmpi(Name_Species(k),Element(j))
               Molecular_weight = Molecular_weight + Weight(j);
               l = j;
           end
       end
       n = str2num(Name_Species(k));
       if n>1
           Molecular_weight = Molecular_weight + Weight(1)*(n-1);
       end
   end


   % Creating Folder
   mkdir(Name_Species)
   cd(Name_Species)

   % Displaying output
   fprintf('Molecular weight of %s = %f units',Name_Species, Molecular_weight)
   disp(' ')

   % Input
   R = 8.314;
   T = linspace(local_low_temp,local_high_temp,500);

% Thermodynamic Parameters calculation
for j = 1:length(T)
    if T(j)>local_mid_temp
        cp = (a1+a2.*T+a3.*T.^2+a4.*T.^3+a5.*T.^4).*R;
        H = (a1+(a2.*T)./2+(a3.*T.^2)/3+(a4.*T.^3)/4+(a5.*T.^4/5)+b1./T).*T.*R;
        S = (a1.*log(T)+a2.*T+(a3.*T.^2)/2+(a4.*T.^3)/3+(a5.*T.^4)/4+b2).*R;
    else
        cp = (b3+b4.*T+b5.*T.^2+c1.*T.^3+c2.*T.^4).*R;
        H = (b3+(b4.*T)./2+(b5.*T.^2)/3+(c1.*T.^3)/4+(c2.*T.^4/5)+c3./T).*T.*R;
        S = (b3.*log(T)+b4.*T+(b5.*T.^2)/2+(c1.*T.^3)/3+(c2.*T.^4)/4+c4).*R;
    end
end


% Plot
% Temperature vs Specific Heat Plot
figure(1)
plot(T,cp,'linewidth',2,'color','c')
xlabel('Temperature[K]')
ylabel('Specific Heat[KJ/Kg-K]')
title(sprintf('Temperature vs Specific Heat Plot for %s',Name_Species))
saveas(figure(1),'Specific Heat.jpg')
grid on

% Temperature vs Enthalpy
figure(2)
plot(T,H,'linewidth',2,'color','g')
xlabel('Temperature[K]')
ylabel('Enthalpy[KJ/Kg-K]')
title(sprintf('Temperature vs Enthalpy Plot for %s',Name_Species))
saveas(figure(2),'Enthalpy.jpg')
grid on

% Temperature vs Entropy

figure(3)
grid on
plot(T,S,'linewidth',2,'color','r')
xlabel('Temperature[K]')
ylabel('Entropy[KJ/Kg-K]')
title(sprintf('Temperature vs Entropy Plot for %s',Name_Species))
saveas(figure(3),'Entropy.jpg')

% Changging directory
cd(pwd)
cd ..

end

%Closing file
fclose(File_Parsing);
OUTPUT:
Molecular weights:
Folders:

Plots:
1.O2 Plots
2. N2 Plots:
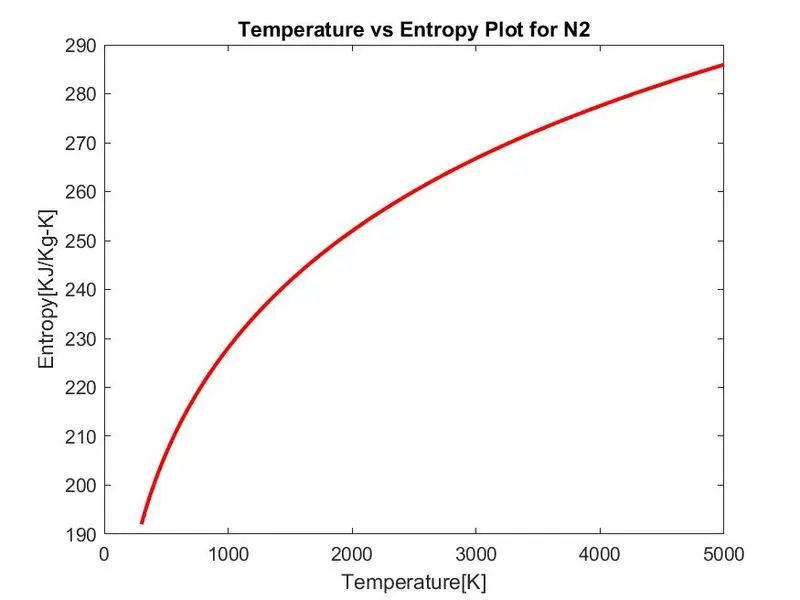
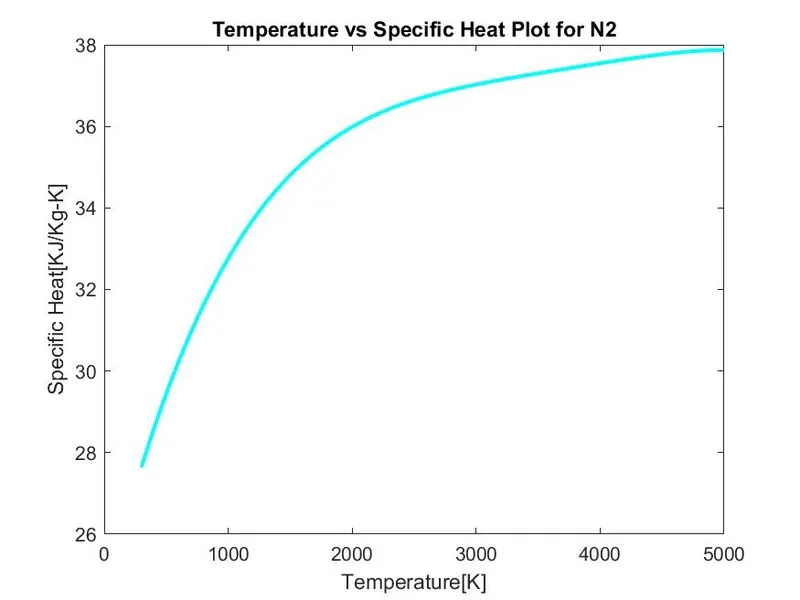
3. CO2 Plots:
ERROR:
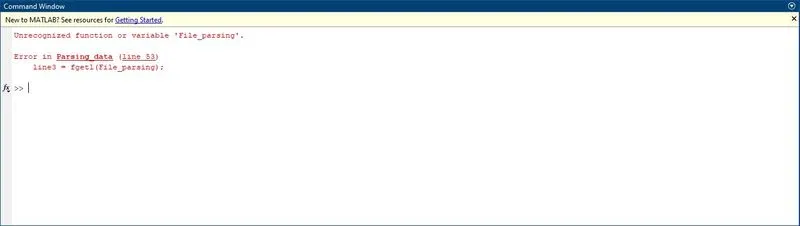
The file name was changed on that particular line.
Another error occured where the array index was limited as the '.dat' file was not in the same directory as the program.
CONCLUSIONS:
- The report is submitted along with the necessary plots and codes.
REFERENCES:
https://en.wikipedia.org/wiki/Parsing
https://www.mathworks.com/help/matlab/ref/cd.html
https://www.mathworks.com/help/matlab/ref/if.html?s_tid=srchtitle
https://www.mathworks.com/help/matlab/ref/saveas.html?searchHighlight=save%20gcf&s_tid=doc_srchtitle