Parsing NASA thermodynamic data by Nishant Dutt Mishra
AIM:-
To extract the coefficients of each species provided by NASA and calculate the values of specific heat, enthalpy, and entropy for the given temperature ranges.
OBJECTIVES:-
- To extract coefficients and find the values of different properties as stated(specific heat, enthalpy, and entropy).
- To plot the values for the lower and higher temperature properties separately.
- To save the plots in the folders named after their respective species name.
THEORY:-
There are often times when we have to read data from a certain file and use it in our program. Copying the data line by line is a tedious task. Therefore MATLAB provides specific commands that can help parse all the data swiftly.
Explanation of the code:
- First, we open the data file by 'fopen' command. The term 'r' is the permission that we give to the code as per our requirements i.e. whether we have to read ('r') the file or we have to write ('w') in a file. There are several other types of permissions as well.
- The 'fgetl' command is used to skip the next line of the text. But if assigned to a variable, it stores the line in that variable. Since we just have to display the global temperatures, we have stored that in separate variables (global_low_temp, global_mid_temp, and global_high_temp).
- The next three lines after global temperatures have to be skipped as shown below, therefore we run a for loop and use fgetl command to skip all these lines.
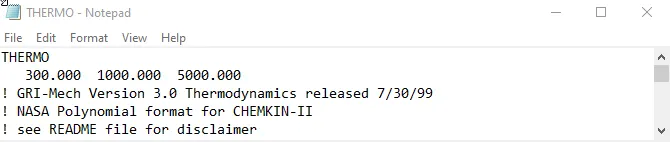
Here is the code for the first part;
clear all
close all
clc

% Reading the file from the current folder
f2 =fopen('THERMO.dat','r');
A = fgetl(f2);
tline = '300.00 1000.00 5000.00';

% strsplit is used to split the string into cell arrays
B = strsplit(tline,' ');
global_low_temp  = str2double(B{1});
global_mid_temp  = str2double(B{2});
global_high_temp = str2double(B{3});
R = 8.314;
% fgetl is used to skip and also to store next line of the text
for i = 1:4
    fgetl(f2);
end
Now, since there are 53 species, we have to run the code 53 times. Therefore we create a for loop to calculate molecular mass, enthalpy, etc. for all the species. The local low and local high temperature ranges are made by extracting them from the first line of every species. As it can be seen below that they are the second, third, and fourth terms from last.
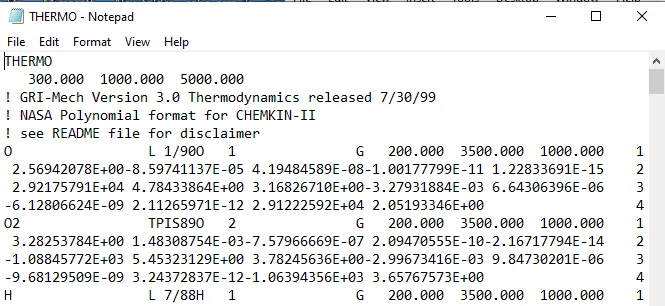
Here is the code to create the respective temperature ranges;
% Using the for loop to extract species name and respective coefficients
for j = 1:53
   C1 = fgetl(f2);
   D = strsplit(C1,' ');
   species_name = D{1};

   T6 = str2double(D{end-1});
   T7 = str2double(D{end-2});
   T8 = str2double(D{end-3});

   % Making lower and higher temperature ranges
   t1 = linspace(T6,T7,100);
   t2 = linspace(T8,T6-1,100);
In order to ease the extraction of the coefficients, we have assigned different names to all the three lines under each species. 'a' to the first line of coefficients, 'b' to the second line, and 'c' to the third line. Then a for loop is executed to extract and separate the values of coefficients. The 'strfind' command finds the position of 'E' in the terms, and with the help of that we separate the coefficients from one another.
Here is the code for that;
 % Extracting coefficients for respective species
        E1 = fgetl(f2);
        F = strfind(E1,'E');
    for i = 1:length(F)
        G = E1(F(i)-11:F(i)+3);
        a(i) = str2double(G);
    end

        J = fgetl(f2);
        x = strfind(J,'E');
    for k = 1:length(x)
        L = J(x(k)-11:x(k)+3);
        b(k) = str2double(L);
    end

        M = fgetl(f2);
        N = strfind(M,'E');
    for m = 1:length(N)
        O = M(N(m)-11:N(m)+3);
        c(m) = str2double(O);
    end
Then we have created directories by the name of the respective elements and ran a for loop to find the values for specific heat, enthalpy, and entropy. 'mkdir' command helps in making a directory and 'cd' command returns the value to the current directory. Two loops have been executed as we have to find the values of low and high temperature properties separately Then these values have been plotted and saved in their respective folders (species name). And at last 'cd..' command is used to change the current folder.
% Creating directories named after the species name
        mkdir(species_name)
        cd(species_name)

    % Calculating the specific heat, enthalpy and entropy
    for s = 1:length(t1)
        T1 = t1(s);
    high_Cp(s) = R*(a(1) + a(2)*T1 + a(3)*T1^2 + a(4)*T1^3 + a(5)*T1^4);
    high_H(s) = R*T1*(a(1) + a(2)*(T1/2) + a(3)*(T1^2/3) + a(4)*(T1^3/4) + a(5)*(T1^4/5) + b(1)/T1);
    high_S(s) = R*(a(1)*log(T1) + a(2)*T1 + a(3)*(T1^2/2) + a(4)*(T1^3/3) + a(5)*(T1^4/4) + b(2));
    end

    for z = 1:length(t2)
        T2 = t2(z);
    low_Cp(z) = R*(b(3) + b(4)*T2 + b(5)*T2^2 + c(1)*T2^3 + c(2)*T2^4);
    low_H(z) = R*T2*(b(3) + b(4)*(T2/2) + b(5)*(T2^2/3) + c(1)*(T2^3/4) + c(2)*(T2^4/5) + c(3)/T2);
    low_S(z) = R*(b(3)*log(T2) + b(4)*T2 + b(5)*(T2^2/2) + c(1)*(T2^3/3) + c(2)*(T2^4/4) + c(4));
    end

    t_1= [t2,t1];
    Cp = [low_Cp, high_Cp];
    H_1 = [low_H,high_H];
    S_1 = [low_S,high_S];

   % saving the plots into respective folders
   figure(1)
   plot(t_1,Cp,'color','b')
   xlabel('temperature in K')
   ylabel('Specific heat in KJ/Kg-K')
   saveas(1,'Specific_heat.png')

   figure(2)
   plot(t_1,H_1,'color','r')
   xlabel('temperature in K')
   ylabel('Enthalpy in KJ/Kg ')
   saveas(2,'enthalpy.png')

   figure(3)
   plot(t_1,S_1,'color','g')
   xlabel('temperature in K')
   ylabel('S')
   saveas(3,'entropy.png')

   % cd.. command will exit the current folder and also change the folder
   cd ..
Then, in order to print the molecular mass of the element, we have run a loop for 2 arrays consisting of the species name and molecular mass respectively. The 'strcmp' command is used to assign the values of a string array to the respective elements of a numeric array. And hence by comparing the values, we have calculated the molecular mass.
  mass = ['O','H','N','C','A'];
   MW =    [16 ,1 ,14, 12, 40];
   mol_wt = 0;
    for p = 1:length(species_name)
       for q = 1:length(mass)
           if strcmp(species_name(p),mass(q))
               mol_wt = mol_wt+MW(q);
               n=q;
           end
       end
       x = str2double(species_name(p));
       if (x>1)
       mol_wt = mol_wt+MW(n)*(x-1);
       end
    end
   sprintf('molecular weight of  %s = %f',species_name,mol_wt)
end
Here is the complete code:
clear all
close all
clc

% Reading the file from the current folder
f2 =fopen('THERMO.dat','r');
A = fgetl(f2);
tline = '300.00 1000.00 5000.00';

% strsplit is used to split the string into cell arrays
B = strsplit(tline,' ');
global_low_temp  = str2double(B{1});
global_mid_temp  = str2double(B{2});
global_high_temp = str2double(B{3});
R = 8.314;
% fgetl is used to skip and also to store next line of the text
for i = 1:4
    fgetl(f2);
end

% Using the for loop to extract species name and respective coefficients
for j = 1:53
   C1 = fgetl(f2);
   D = strsplit(C1,' ');
   species_name = D{1};

   T6 = str2double(D{end-1});
   T7 = str2double(D{end-2});
   T8 = str2double(D{end-3});

   % Making lower and higher temperature ranges
   t1 = linspace(T6,T7,100);
   t2 = linspace(T8,T6-1,100);

   % Extracting coefficients for respective species
        E1 = fgetl(f2);
        F = strfind(E1,'E');
    for i = 1:length(F)
        G = E1(F(i)-11:F(i)+3);
        a(i) = str2double(G);
    end

        J = fgetl(f2);
        x = strfind(J,'E');
    for k = 1:length(x)
        L = J(x(k)-11:x(k)+3);
        b(k) = str2double(L);
    end

        M = fgetl(f2);
        N = strfind(M,'E');
    for m = 1:length(N)
        O = M(N(m)-11:N(m)+3);
        c(m) = str2double(O);
    end

    % Creating directories named after the species name
        mkdir(species_name)
        cd(species_name)

    % Calculating the specific heat, enthalpy and entropy
    for s = 1:length(t1)
        T1 = t1(s);
    high_Cp(s) = R*(a(1) + a(2)*T1 + a(3)*T1^2 + a(4)*T1^3 + a(5)*T1^4);
    high_H(s) = R*T1*(a(1) + a(2)*(T1/2) + a(3)*(T1^2/3) + a(4)*(T1^3/4) + a(5)*(T1^4/5) + b(1)/T1);
    high_S(s) = R*(a(1)*log(T1) + a(2)*T1 + a(3)*(T1^2/2) + a(4)*(T1^3/3) + a(5)*(T1^4/4) + b(2));
    end

    for z = 1:length(t2)
        T2 = t2(z);
    low_Cp(z) = R*(b(3) + b(4)*T2 + b(5)*T2^2 + c(1)*T2^3 + c(2)*T2^4);
    low_H(z) = R*T2*(b(3) + b(4)*(T2/2) + b(5)*(T2^2/3) + c(1)*(T2^3/4) + c(2)*(T2^4/5) + c(3)/T2);
    low_S(z) = R*(b(3)*log(T2) + b(4)*T2 + b(5)*(T2^2/2) + c(1)*(T2^3/3) + c(2)*(T2^4/4) + c(4));
    end

    t_1= [t2,t1];
    Cp = [low_Cp, high_Cp];
    H_1 = [low_H,high_H];
    S_1 = [low_S,high_S];

   % saving the plots into respective folders
   figure(1)
   plot(t_1,Cp,'color','b')
   xlabel('temperature in K')
   ylabel('Specific heat in KJ/Kg-K')
   saveas(1,'Specific_heat.png')

   figure(2)
   plot(t_1,H_1,'color','r')
   xlabel('temperature in K')
   ylabel('Enthalpy in KJ/Kg ')
   saveas(2,'enthalpy.png')

   figure(3)
   plot(t_1,S_1,'color','g')
   xlabel('temperature in K')
   ylabel('S')
   saveas(3,'entropy.png')

   % cd.. command will exit the current folder and also change the folder
   cd ..

   mass = ['O','H','N','C','A'];
   MW =    [16 ,1 ,14, 12, 40];
   mol_wt = 0;
    for p = 1:length(species_name)
       for q = 1:length(mass)
           if strcmp(species_name(p),mass(q))
               mol_wt = mol_wt+MW(q);
               n=q;
           end
       end
       x = str2double(species_name(p));
       if (x>1)
       mol_wt = mol_wt+MW(n)*(x-1);
       end
    end
   sprintf('molecular weight of  %s = %f',species_name,mol_wt)
end
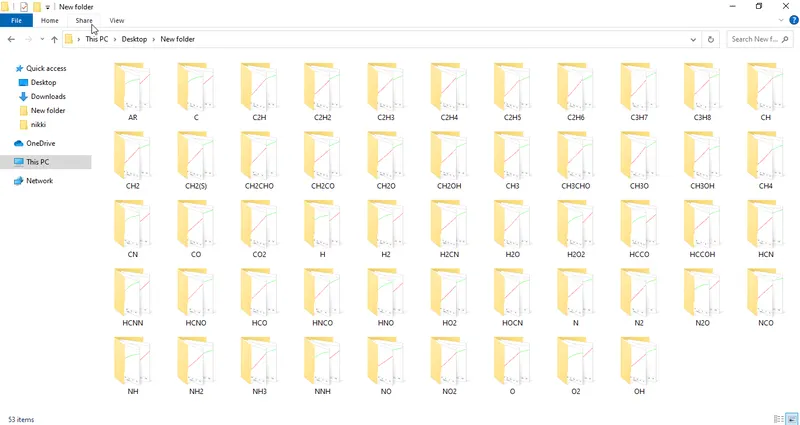
The only error that occurred was the fact that the 'cd' command was not given, so instead of creating separate folders for all species, it created folders one inside the other. There was no logical error.
Here's how folders are stored when we use the 'cd..' command
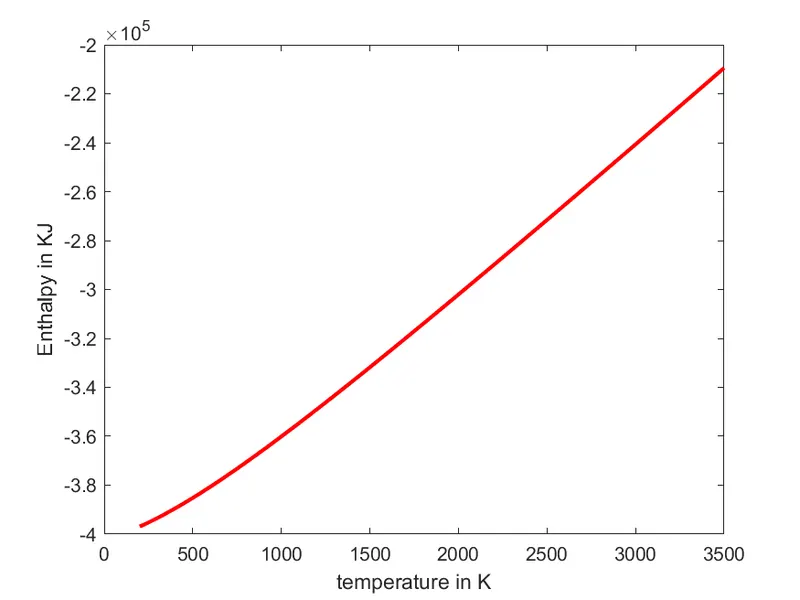
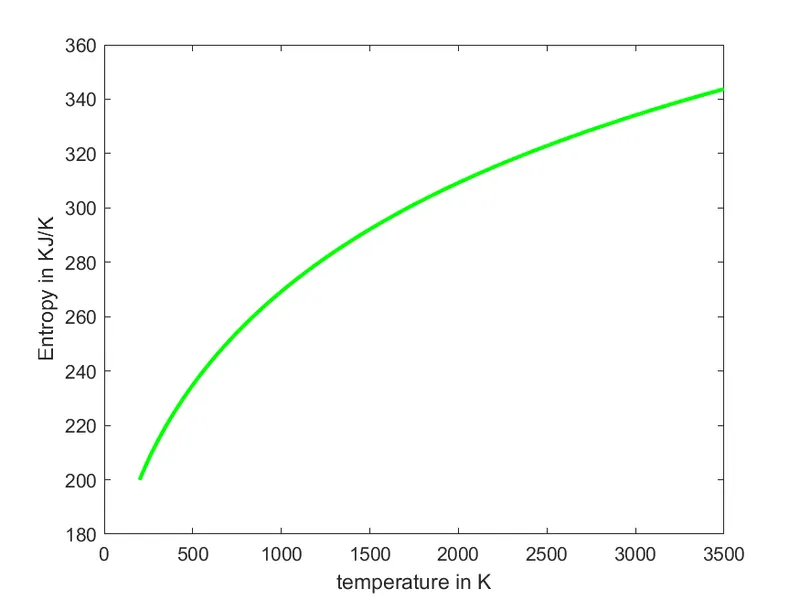
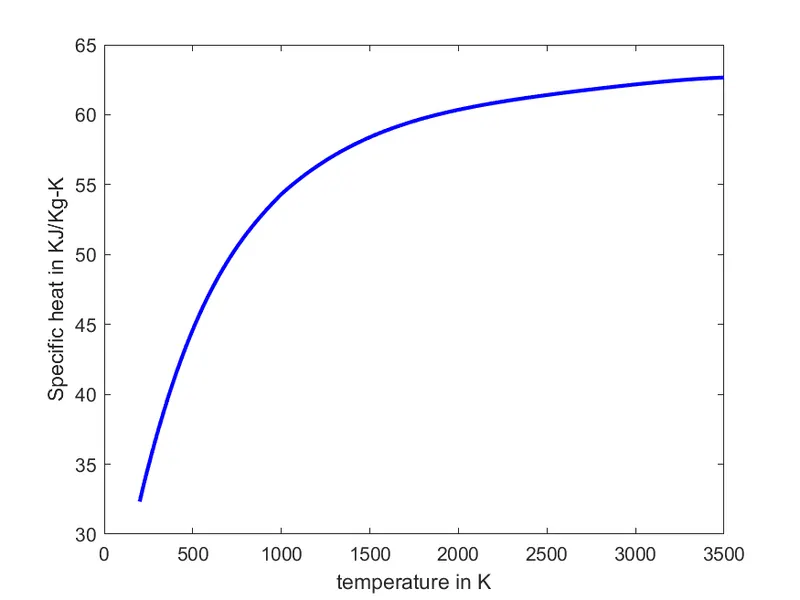
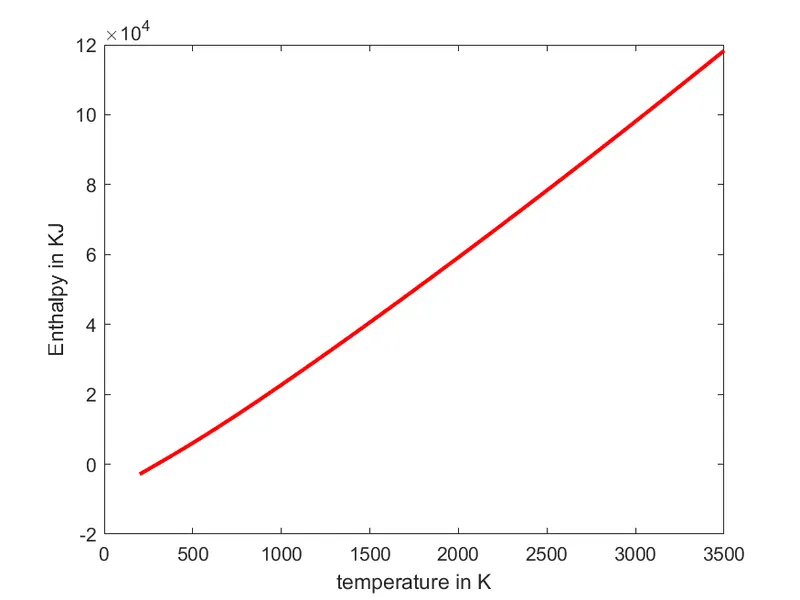
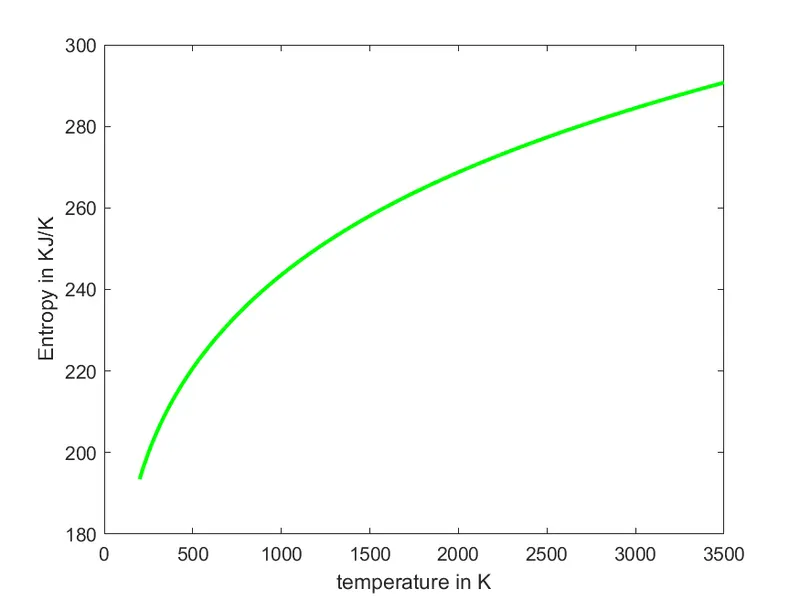
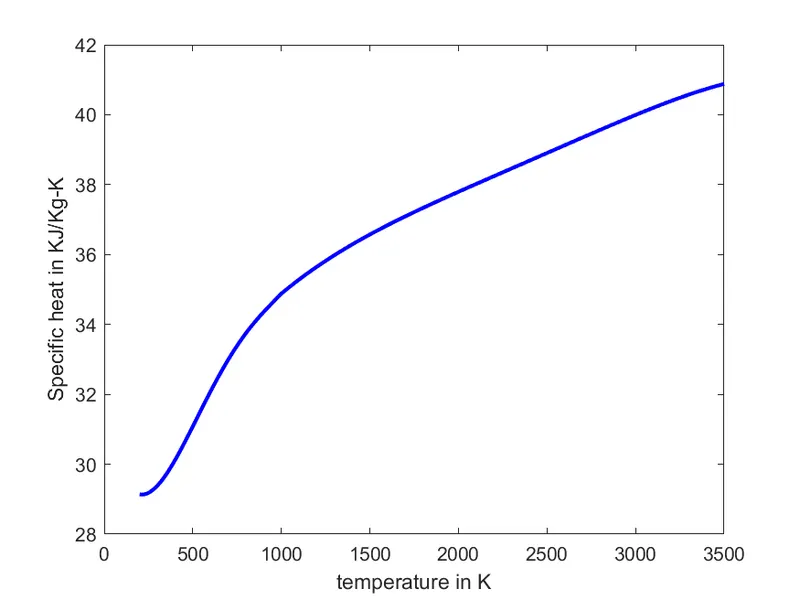
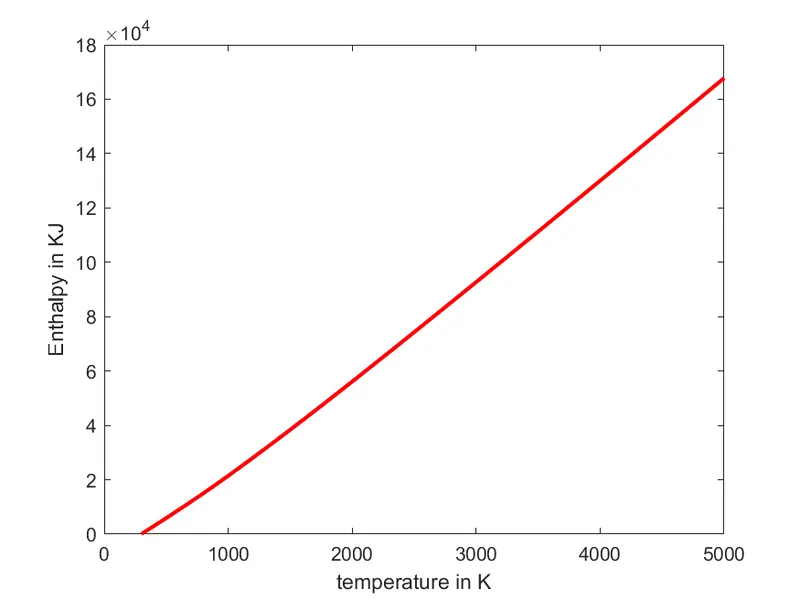
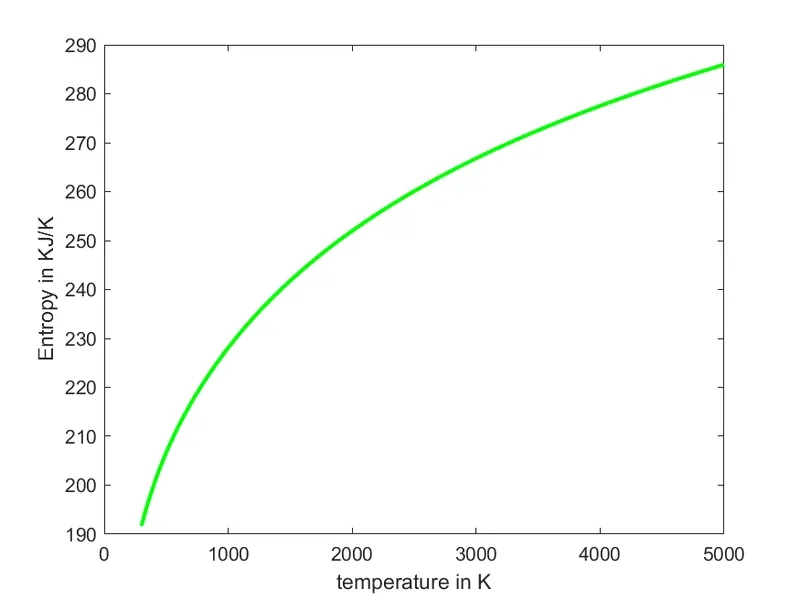
Here are the plots of O2, N2 and CO2:-
O2:-
N2:-
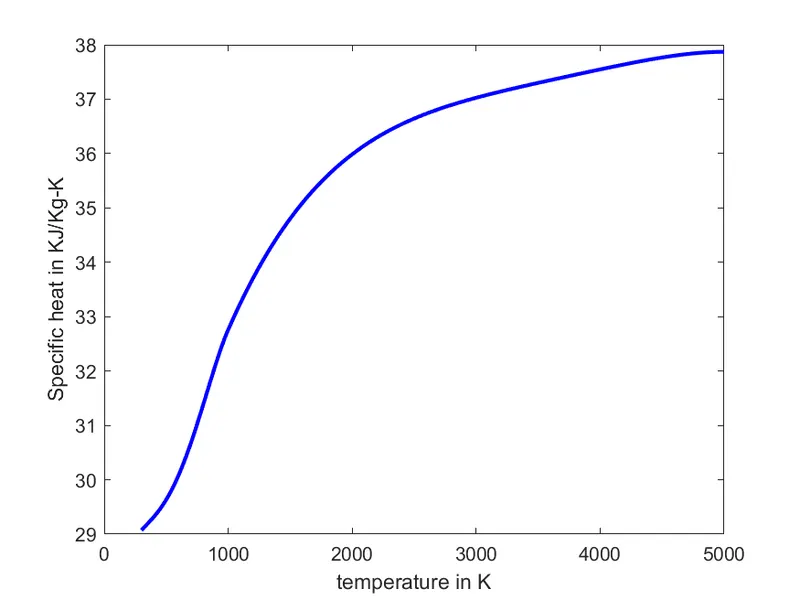
CO2:-