Parsing NASA thermodynamic data file using MATLAB
Parsing NASA thermodynamic data file using MATLAB
Aim
The main aim is as follows:
- Write a function that extracts the 14 coefficients and calculates the enthalpy, entropy, and specific heats for all the species in the data file.
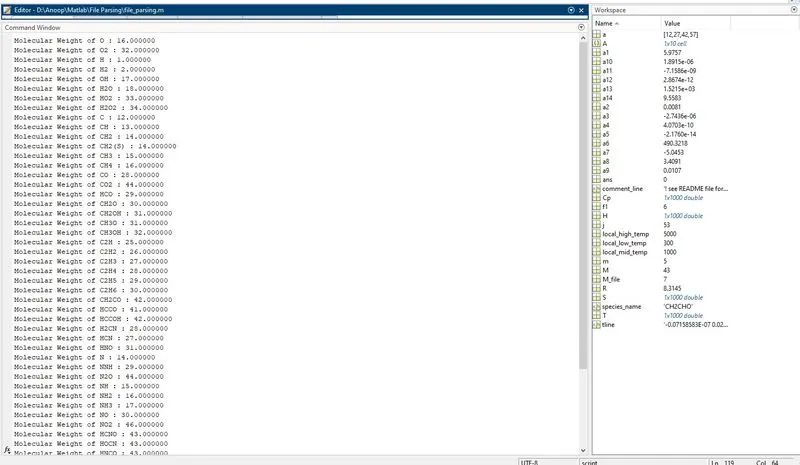
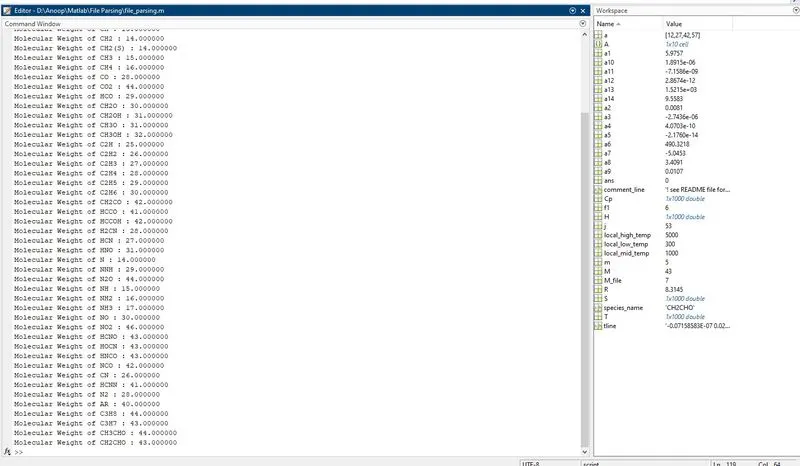
- Calculate the molecular weight of each species and display it in the command window.
- Plot the Cp, Enthalpy, and Entropy for the local temperature range (low temperature: high temperature) specific for each species.
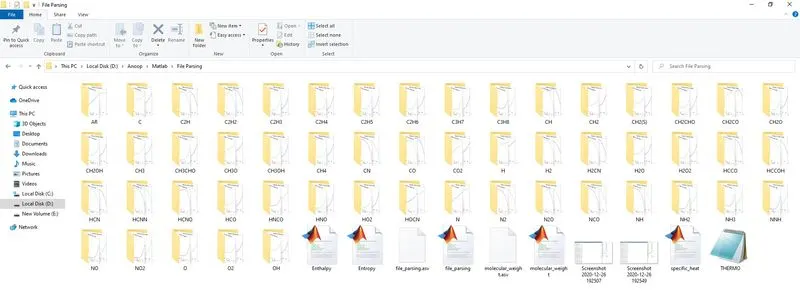
- Save the plots as images with appropriate names and dump them in separate folders for each species with a suitable name. All these should be generated automatically.
FILE PARSING :
To parse data or information means to break it down into component parts so that its syntax can be analysed, categorized, and understood. The actual definition of ‘parsing’ is to spit a file or other input into pieces of data that can be easily stored or manipulated. So in file parsing, we split a string into parts then recognize the parts to convert it into something simpler than a string. File Parsing is used to read as well as to write data in a file. File parsing can be used to create text or data file or even websites can be created.
NASA’s Thermodynamic data file contains coefficients for polynomials that are used to calculate thermodynamic properties for various chemical species. We are going to use file parsing to read the data given in “NASA’s Thermodynamic data file” (NASA's Thermodynamic Data File)to extract these coefficients and perform calculations in Matlab.
The formula to calculate Specific Heat (Cp), Enthalpy and Entropy is given as,
`(Cp)/R=a1+a2T+a3T^2+a4T^3+a5T^4`
`(H)/(RT)=a1+(a2T)/2+(a3T^2)/3+(a4T^3)/4+(a5T^4)/5+(a6)/T`
`S/R=a1ln(T)+a2T+(a3T^2)/2+(a4T^3)/3+(a5T^4)/4+a7`
The first 7 coefficients are High-temperature coefficients and the Second 7 coefficients are Low-temperature coefficients.
Where,
R = Universal Gas Constant;
T = Temperature;
Main Matlab program to parse NASA's Thermodynamic data
clear all
close all
clc

% Reading the NASA Thermodynamic data file using 'fopen' function
f1= fopen('THERMO.dat','r');

%'fgetl' is used to read the data file line by line.
% First 5 lines are generally considered as comments. also global temperature data we are not using for calculation.
for m = 1:5
    comment_line = fgetl(f1);
end

%Defining Universal Gas constant
R = 8.3145;         %in J/mol-K

%Reading all species individually
for j = 1:53
    tline = fgetl(f1);
    A = strsplit(tline,' ');
    species_name = (A{1});

    %Reading Local Temperature for each species
    local_low_temp   = str2num(A{end-3});
    local_high_temp  = str2num(A{end-2});
    local_mid_temp   = str2num(A{end-1});

    %Reading 1st line of Temperature values
    tline = fgetl(f1);
    a = findstr(tline,'E');

    %Converting the string of values to number
    a1 = tline(1:a(1)+3);
    a1 = str2num(a1);
    a2 = tline(a(1)+4:a(2)+3);
    a2 = str2num(a2);
    a3 = tline(a(2)+4:a(3)+3);
    a3 = str2num(a3);
    a4 = tline(a(3)+4:a(4)+3);
    a4 = str2num(a4);
    a5 = tline(a(4)+4:a(5)+3);
    a5 = str2num(a5);

    %Reading 2nd line of Temperature values
    tline = fgetl(f1);
    a = findstr(tline,'E');

    %Converting the string of values to number
    a6  = tline(1:a(1)+3);
    a6  = str2num(a6);
    a7  = tline(a(1)+4:a(2)+3);
    a7  = str2num(a7);
    a8  = tline(a(2)+4:a(3)+3);
    a8  = str2num(a8);
    a9  = tline(a(3)+4:a(4)+3);
    a9  = str2num(a9);
    a10 = tline(a(4)+4:a(5)+3);
    a10 = str2num(a10);

    %Reading 3rd line of Temperature values
    tline = fgetl(f1);
    a = findstr(tline,'E');

    %Converting the string of values to number
    a11 = tline(1:a(1)+3);
    a11 = str2num(a11);
    a12 = tline(a(1)+4:a(2)+3);
    a12 = str2num(a12);
    a13 = tline(a(2)+4:a(3)+3);
    a13 = str2num(a13);
    a14 = tline(a(3)+4:a(4)+3);
    a14 = str2num(a14);

    %Defining Temperature range for calculations
    T = linspace(local_low_temp,local_high_temp,1000);

    %Calculating Specific Heat, Enthalpy, Entropy and Molecular Weight
    Cp = specific_heat(a1,a2,a3,a4,a5,a8,a9,a10,a11,a12,R,T,local_mid_temp);

    H = Enthalpy(a1,a2,a3,a4,a5,a6,a8,a9,a10,a11,a12,a13,R,T,local_mid_temp);

    S = Entropy(a1,a2,a3,a4,a5,a7,a8,a9,a10,a11,a12,a14,R,T,local_mid_temp);

    M = molecular_weight(species_name);

    %Creating separate Directory to store graphs and values of each species
    cd('D:/Anoop/Matlab/File parsing');
    mkdir(species_name);
    cd(species_name);

    %Writing Molecular Weight to a text file
    M_file = fopen('Molecular Weight.txt','w');
    fprintf(M_file,'Molecular Weight of %s is %d',species_name,M);
    fclose(M_file);

    %Plotting Temperature VS Specific Heat graph and Saving
    figure(1)
    plot(T,Cp,'linewidth',1.5,'color','r');
    xlabel('Temperature (K)');
    ylabel('Specific Heat (KJ)');
    title(sprintf('Temperature vs Specific Heat of %s',species_name))
    grid on
    saveas(figure(1),'Specific Heat.jpg');

    %Plotting Temperature VS Enthalpy graph and Saving
    figure(2)
    plot(T,H,'linewidth',1.5,'color','b');
    xlabel('Temperature (K)');
    ylabel('Enthalpy (KJ/mol)');
    title(sprintf('Temperature vs Enthalpy of %s',species_name))
    grid on
    saveas(figure(2),'Enthalpy.jpg');

    %Plotting Temperature VS Entropy graph and Saving
    figure(3)
    plot(T,S,'linewidth',1.5,'color','g');
    xlabel('Temperature (K)');
    ylabel('Entropy (KJ/mol-K)');
    title(sprintf('Temperature vs Entropy of %s',species_name))
    grid on
    saveas(figure(3),'Entropy.jpg');

    %Changing Directory to Original Directory
    cd('D:/Anoop/Matlab/File parsing');
end
Explanation of code
- The code starts with clear all, close all and clc where,
‘clear all’ command is used to clear the data stored in the workspace.
‘close all’ command is used to close all plots and figures.
‘clc’ command is used to clear the command window.
- Then to open the ‘THERMO.dat’ data file, fopen command is used and reading permission is provided.
- Then to read the data in the file, fgetl command is used and the first line and the global temperature is read.
- The strsplit command is used to split the string at a specified delimiter which in this case is the spacing between the numbers.
- The str2num command is used convert the string of values of temperature into actual numbers and the global temperature values are read.
- To skip the comments in the file, the ‘for loop’ is used and the value of Universal Gas constant is defined.
- To read the data for all the 53 species mentioned in the data file and to calculate the thermodynamic properties of each species, ‘for loop’ is used.
- In the ‘for loop’, the first line of each species is read using fgetl command and the string is converted into array with strsplit command.
- The name of the species is stored in the ‘species_name’ variable and the local temperature values are extracted using str2num command.
- To read the values of coefficients from the proceeding three lines fgetl command is used along with findstr command to find a common term in the string. Here ‘E’ is given as input to find common in the string.
- The common term is found in order to separate the values in the string and str2num is used to extract those values.
- In this way all the 14 coefficients are extracted and stored in a variable ‘an’, where ‘n = 1,2,3,4,…,13,14’.
- The local temperature range for calculations is defined for 1000 values between lower value and higher value using linspace command.
- To calculate specific heat, enthalpy, entropy and molecular weight, separate function is written.
Function to calculate specific heat
%Defining function for Specific Heat based on the values of Temperature
function Cp = specific_heat(a1,a2,a3,a4,a5,a8,a9,a10,a11,a12,R,T,local_mid_temp)

if T >= local_mid_temp
   Cp = R*(a1+ (a2*T)+ (a3*(T).^2)+ (a4*(T).^3)+ (a5*(T).^4));
else
   Cp = R*(a8+ (a9*T)+ (a10*(T).^2)+ (a11*(T).^3)+ (a12*(T).^4));
end
end
Function to calculate enthalpy
%Defining function for Enthalpy based on the values of Temperature
function H = Enthalpy(a1,a2,a3,a4,a5,a6,a8,a9,a10,a11,a12,a13,R,T,local_mid_temp)

if T >= local_mid_temp
   H = R*T.*(a1+ ((a2*T)/2)+ ((a3*(T).^2)/3)+ ((a4*(T).^3)/4)+ ((a5*(T).^4)/5)+ (a6./T));
else
   H = R*T.*(a8+ ((a9*T)/2)+ ((a10*(T).^2)/3)+ ((a11*(T).^3)/4)+ ((a12*(T).^4)/5)+ (a13./T));
end
end
Function to calculate entropy
%Defining function for Entropy based on the values of Temperature
function S = Entropy(a1,a2,a3,a4,a5,a7,a8,a9,a10,a11,a12,a14,R,T,local_mid_temp)

if T >= local_mid_temp
   S = R*(a1.*log(T)+ a2*T+ ((a3*(T).^2)/2)+ ((a4*(T).^3)/3)+ ((a5*(T).^4)/4)+ a7);
else
   S = R*(a8.*log(T)+ a9*T+ ((a10*(T).^2)/2)+ ((a11*(T).^3)/3)+ ((a12*(T).^4)/4)+ a14);
end
end- In all the three functions, ‘if else’ loop is used as there are 14 coefficients in which the first 7 coefficients are high temperature coefficients and second 7 coefficients are low temperature coefficients.
- So to calculate the specific heat, enthalpy and entropy of the species based on the formula, the ‘if else’ loop is used in such a way that if the values of temperature is above the local medium temperature of the respective specie, the function will take the high temperature coefficients and if the values of temperature is below the local medium temperature, the function will take the low temperature coefficients to perform the calculations.
Function to calculate the molecular weight of each species
%Defining function for Molecular Weight
function M = molecular_weight(species_name)

%Defining atoms and their respective atomic weights
Atoms = ['O','H','C','N','Ar'];
Atomic_weight = [16,1,12,14,40];
M = 0;
%Comparing Atoms to the read data of species name and then calculating
%molecular weight
for i = 1:length(species_name)
    for j = 1:length(Atoms)
        if strcmp(species_name(i),Atoms(j))
           M = M + Atomic_weight(j);
           place = j;
        end
    end
    n = str2num(species_name(i));
    if (n>1)
       M = M + Atomic_weight(place)*(n-1);
    end
end

%Displaying Molecular weight in command window
fprintf('Molecular Weight of %s : ',species_name);
fprintf('%f',M);
disp(' ')
end
Explanation of code
- In the above script, the molecular weight function will take ‘species_name’ as its input. Then the ‘Atoms’ along with their respective ‘Atomic Weight’ is defined and initially the value of ‘M’ is stored as 0. Then two for loops are used, one for the data stored in ‘species_name’ and another for the 'atoms' that we defined.
- The first 'for loop' runs for entire length of species name that has been determined by the for loop in the main program. The second 'for loop' runs for entire length of atoms array.
- An ‘if’ loop is used where, at first the ‘species_name’ and ‘Atoms’ is compared using strcmp command and if the comparison is true, then atomic weight of that particular atom is added to the ‘M’ variable at every place where the atom is present in the species.
- Another ‘if’ loop is used to multiply the value (which is adjacent to the particular atom and which indicates the number of that particular atom such as H2) to the atomic weight.
- Now to display the molecular weight in the command window, the fprintf command is used which will display ‘Molecular weight of %s : %f’ where %s will take species name and %f will take value of M.
- Then in the main code the molecular weight is written to a text file by using fprintf The fopen and fclose command is used to open and close the text file.
- Then to save all outputs to a separate folder first the folder is changed using cd command which takes the folder address as input to change folder.
- The mkdir command makes new folder for each species and cd will again change the folder to that particular species name to save the output.
- Then the graphs of Specific heat, Enthalpy and Entropy against Temperature are plot using plot command using proper labels and titles.
- The three graphs for each species is saved using saveas command as an image file with ‘.jpg’ extension
- At the end the directory is changed to original directory using cd command.
RESULT
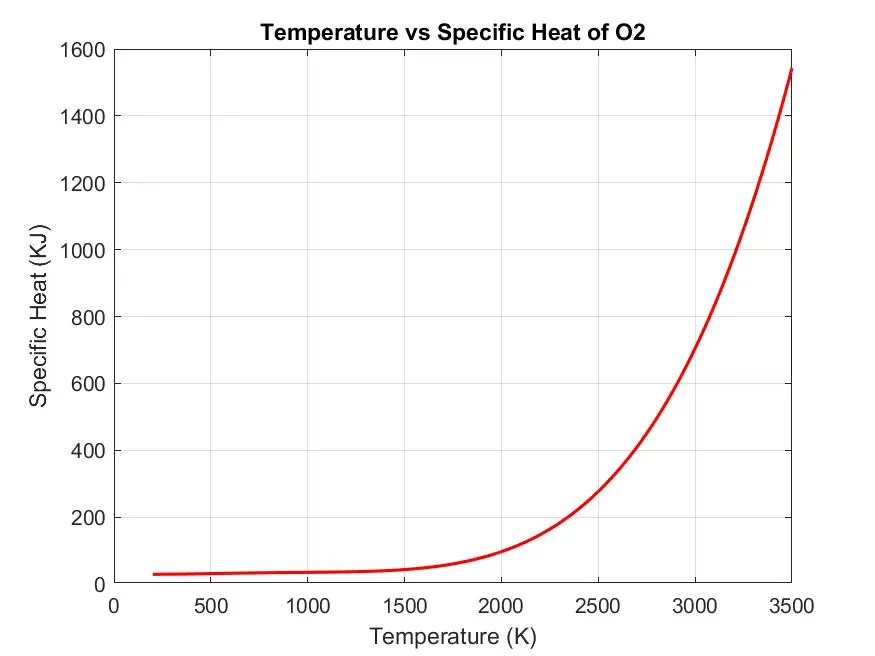
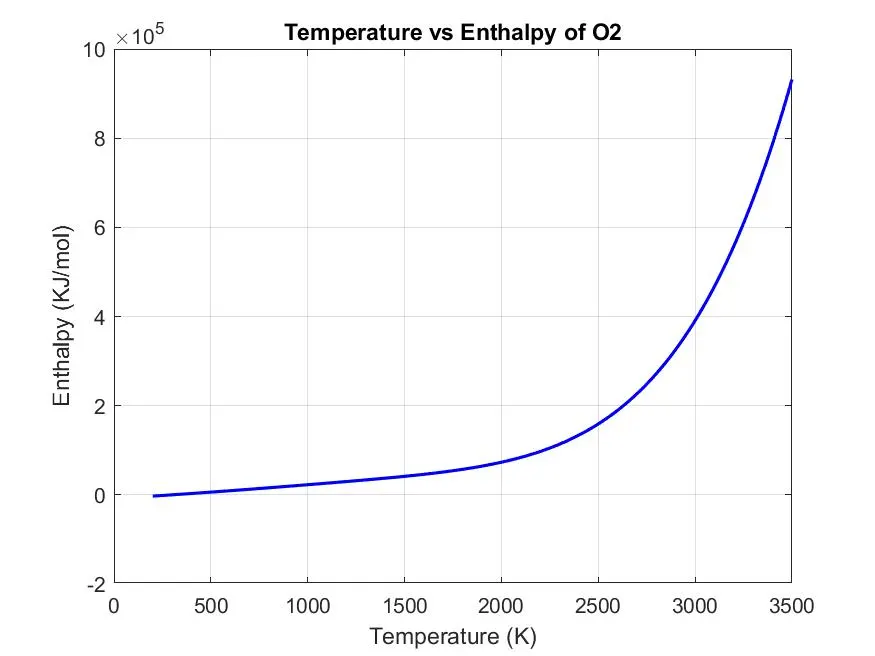
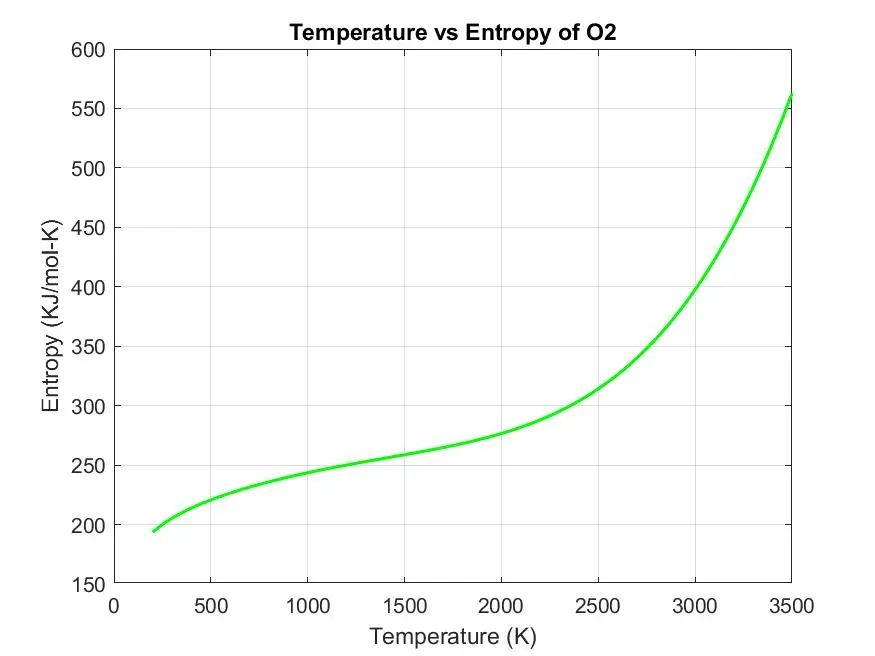
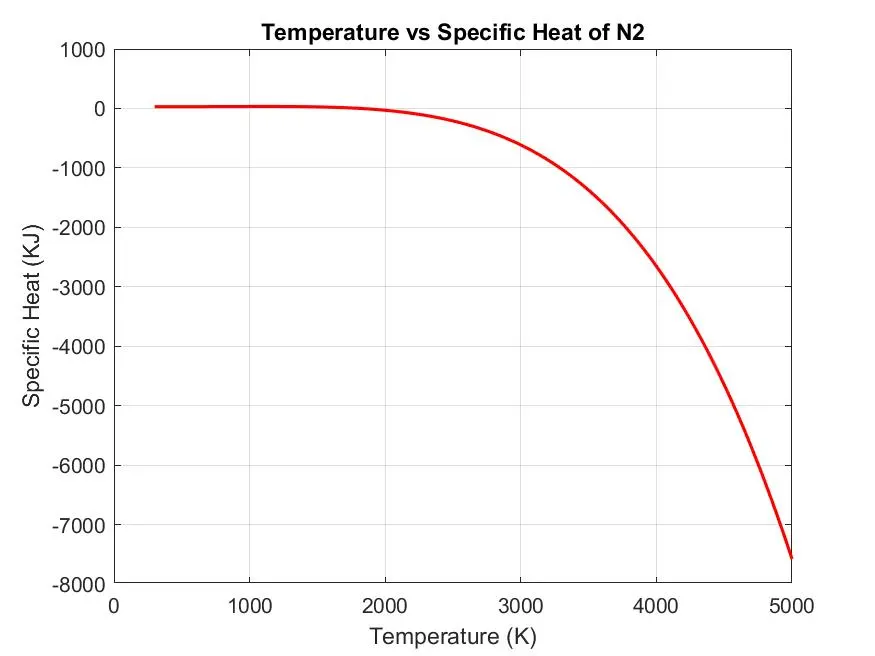
OUTPUT PLOTS :
- Plots for ‘O2’ species –
- Temperature vs Specific Heat
- Temperature vs Enthalpy
- Temperature vs Entropy
- Plots for ‘N2’ species –
- Temperature vs Specific Heat
- Temperature vs Enthalpy
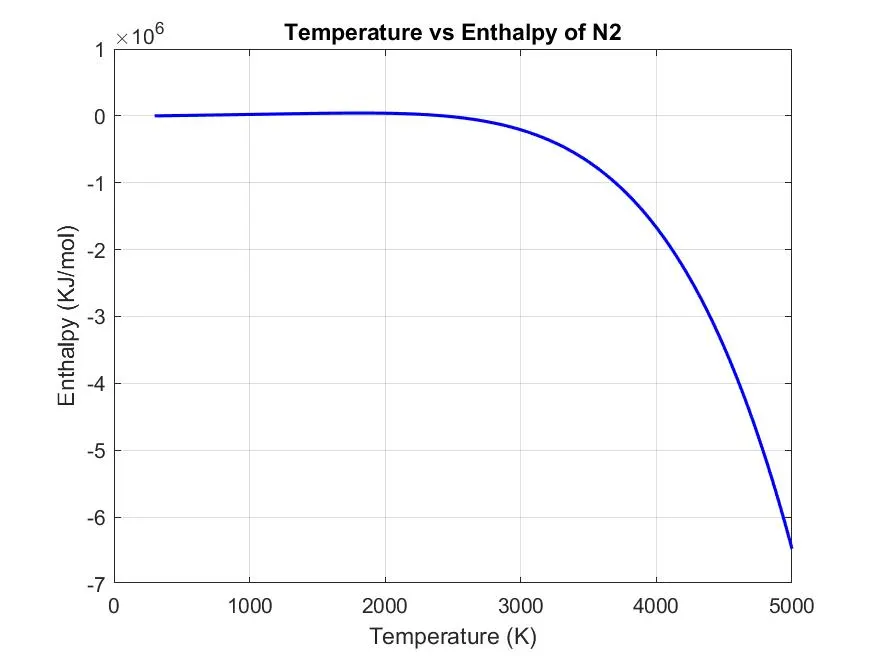
- Temperature vs Entropy
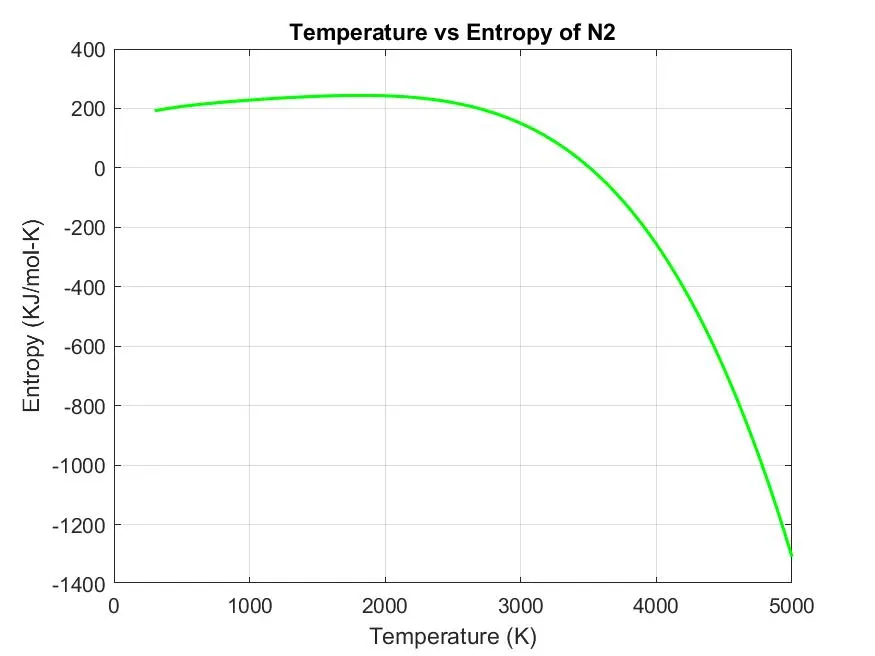
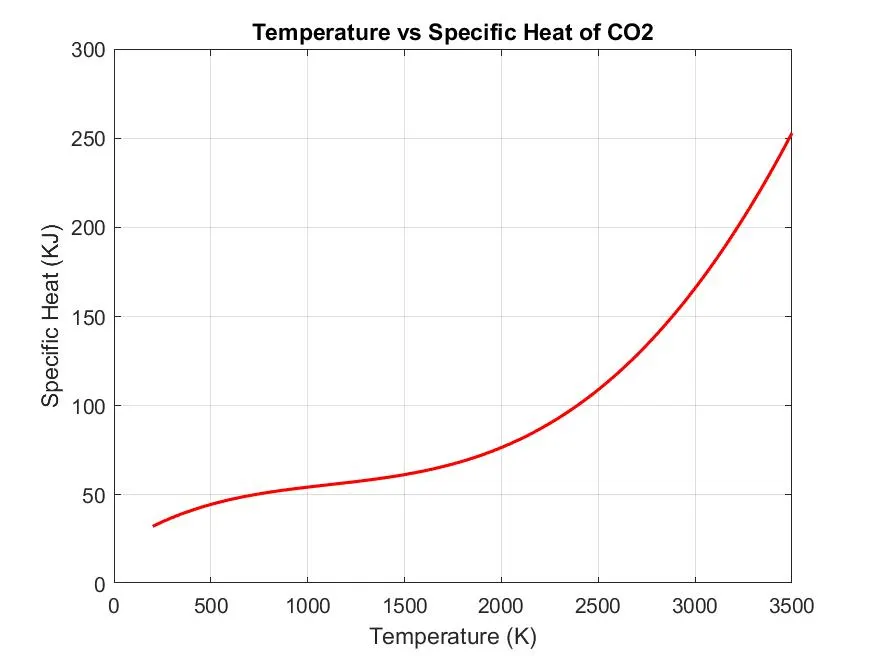
- Plots for ‘CO2’ species –
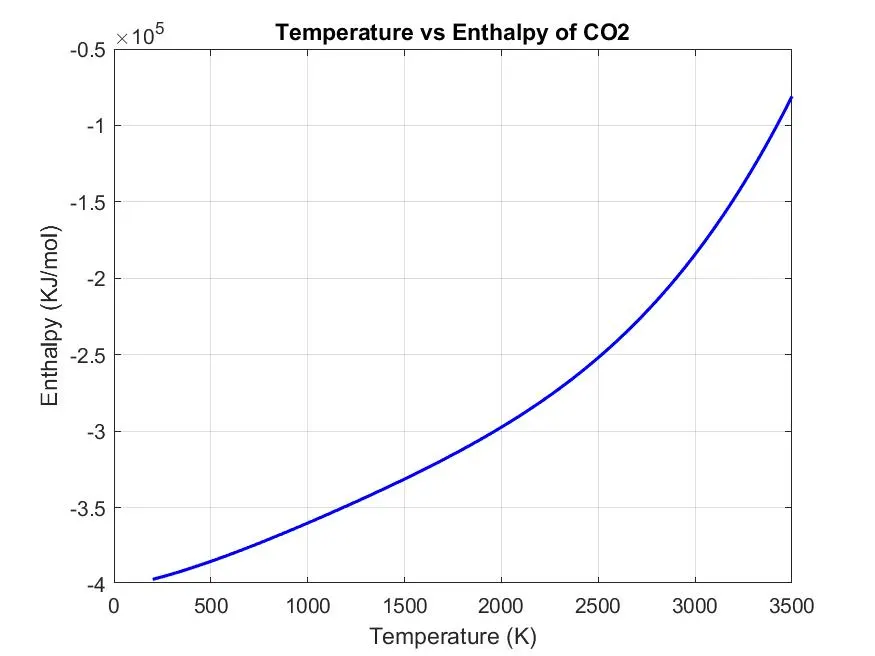
- Temperature vs Specific Heat
- Temperature vs Enthalpy
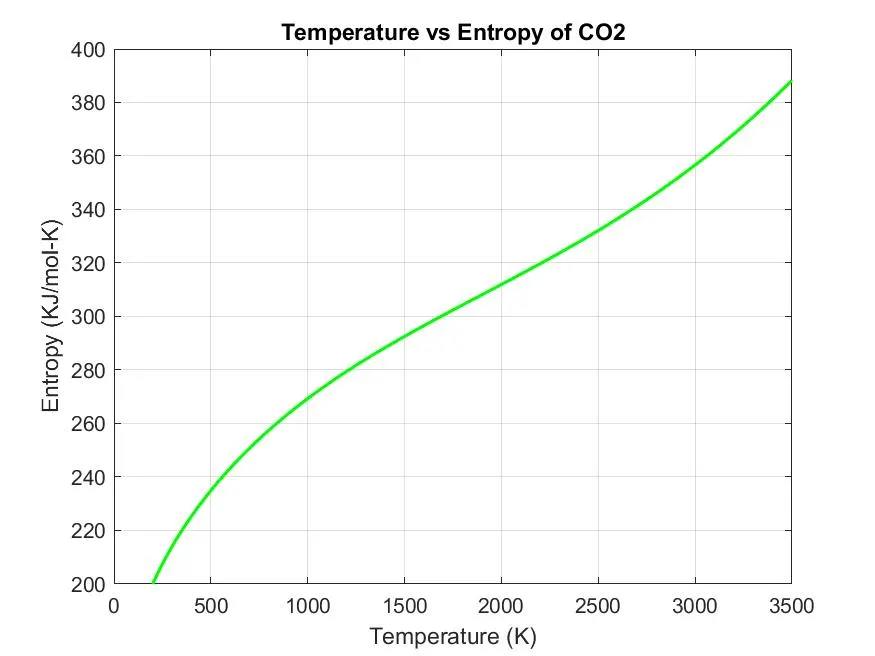
- Temperature vs Entropy
Screenshot of the window where all folders are saved :
Molecular weight values showing in command window
ERRORS :
- Error in molecular weight function –
The variable ‘M’ is unable to calculate the molecular weight of atoms.
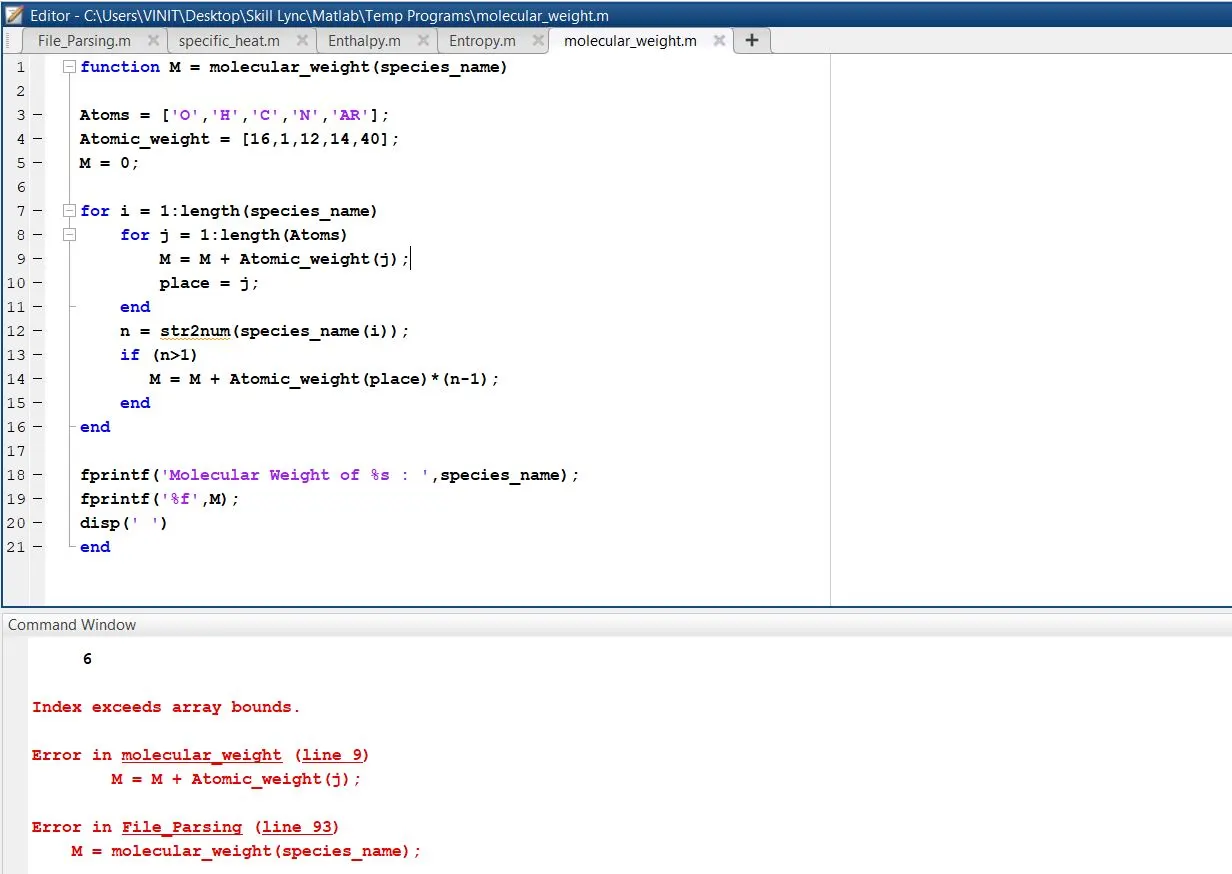
Solution : Include an ‘if’ loop to compare the ‘species_name’ and ‘Atoms’ using strcmp command. If the value is true, molecular weight can be estimated.
- Error in calculating molecular weight of Argon(AR) –
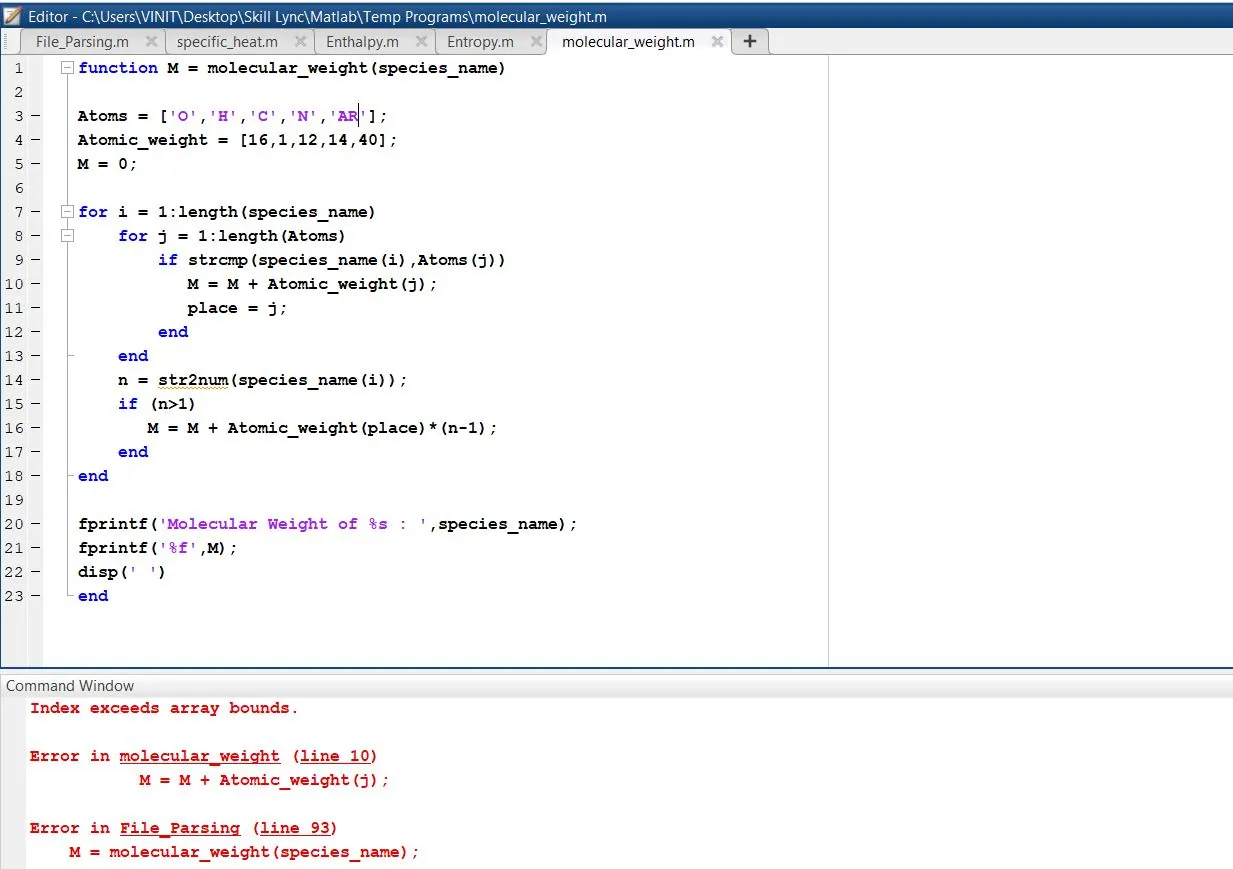 Solution : ‘AR’ is case sensitive, so write ‘AR’ as ‘Ar’. The molecular weight of Argon will be displayed.