Project 1 - Parsing NASA thermodynamic data
Aim:
To write a function to extract the 14 co-effecients and to calculate the Enthalpy, Entropy and specific heat for all the species in the data file.
Theory:
FILE PARSING:
Parsing in computer language refer to synthetic analysis of the input data from a file into its component parts in order to facilitate the writing of compilers and interpreters.it can be used to split r seperation.
MOLECULAR WEIGHT:
Molecular weight is the measure of the sum of the atomic weight value of the atoms in a molecule. Molecular weight which is used in chemistry to determine stoichiometry in chemical reactions and equations,which is represented by M.W either expressed in unit less or in terms of Atomic mass unit(amu) or Daltons(Da).
FORMULAR TO CALCULATE THE CP,ENTHALPY AND ENTROPY:
Here R is universal gas constant , T is temperature.
Cp/R =a1 + a2T + a3T^2 + a4T^3 + a5T^4
H/RT =a1 + a2T/2 + a3T^2/3 + a4T^3/4 + a5T^4/5 + a6/T
S/R = a1 lnT + a2T + a3T^2/2 + a4T^3/3 + a5T^4/4 + a7
:: The first 7 co-effecient are high temperature coffecients and the next 7 co-effecient are low temperature co-effecients.
Also use the local temperature range which is unique for each species .
PROJECT HINT:
* The THERMO.dat file is named as f1 and opened by fopen command, fgetl.file to get the first line of the dat.file
*The next line contanins the global temp so we are using fgetl command to get them and seperate them using strsplit command.
::Where the gas constant is R = 8.31
*The first line contains a main line and the next line contains the co-effecient value, hence the loop is been created for 53 species .
* A function to calculate the molecular weight for each species from its name .
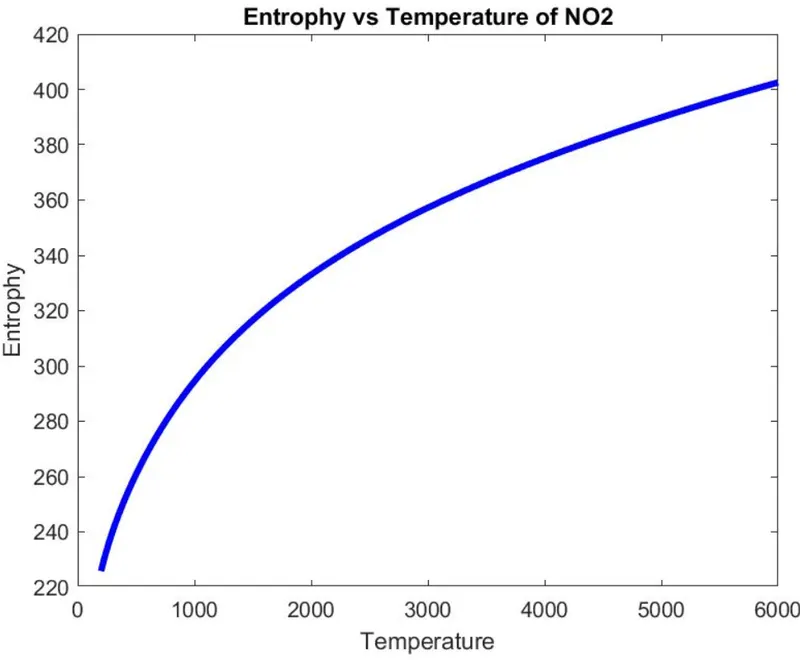
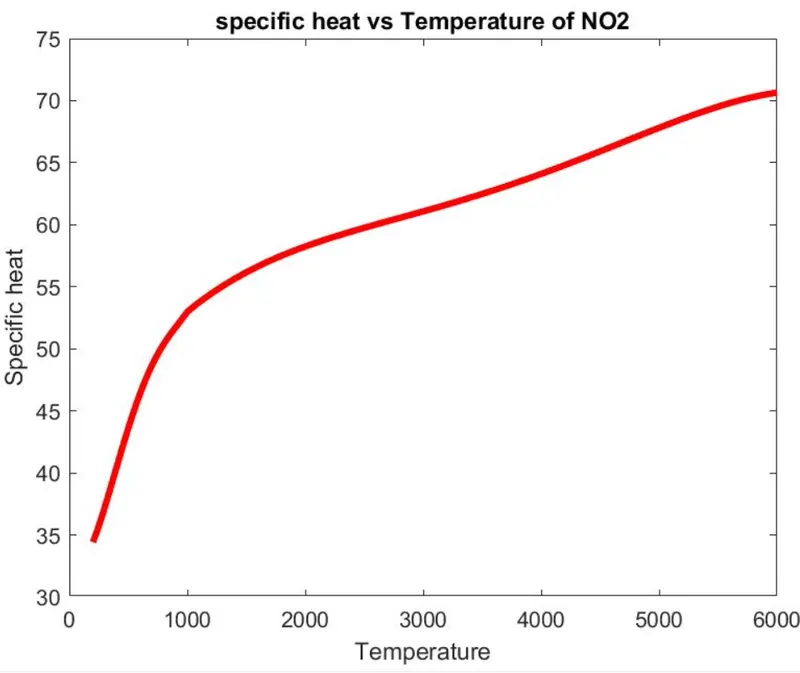
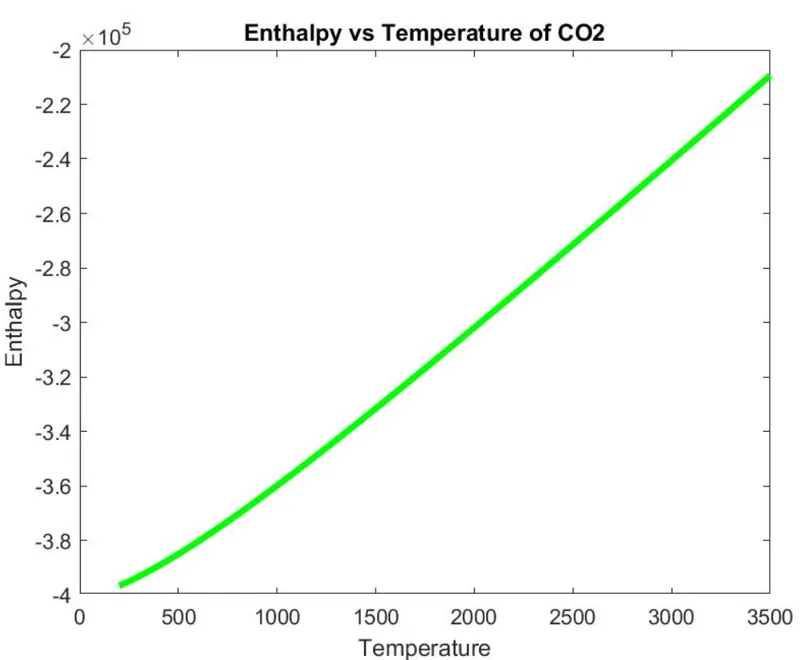
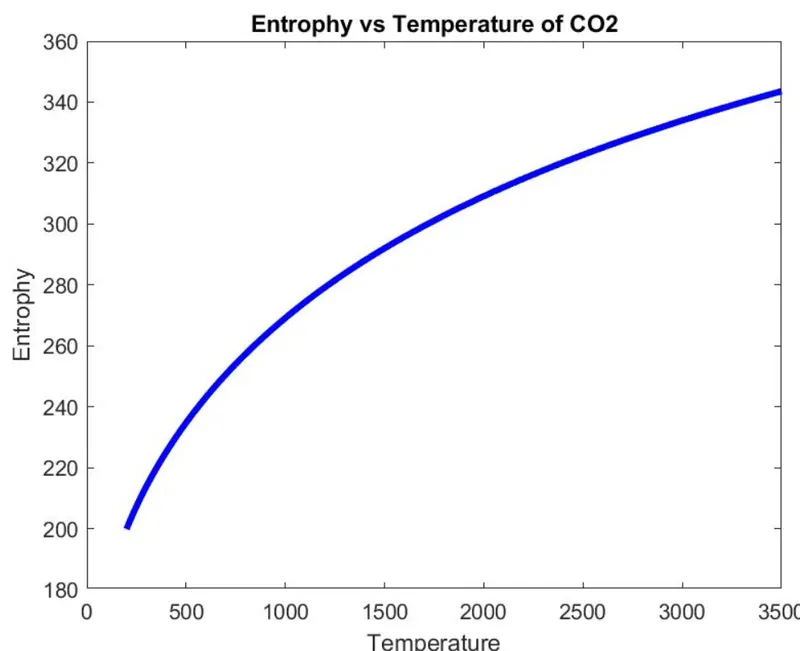
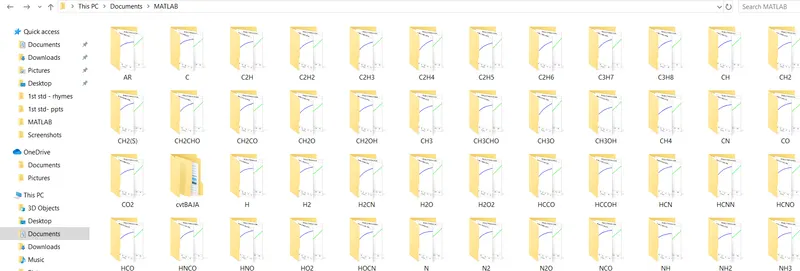
*Create T vs Cp ,T vs Enthalpy , T vs Entropy plot for each species and save them in corresponding folders.
* Molecular weight of all the species are stored in a MW.txt file.
Main Program :
clear all
close all
clc

f1=fopen('C:\Users\dell\Documents\THERMO.dat','r')


fgetl(f1);

temp=fgetl(f1);


A=strsplit(temp,' ');


global_low_temp=(A{2});
global_mid_temp=(A{3});
global_high_temp=(A{4});


R=8.31;

for j=1:3
    fgetl(f1);
end
for i=1:53
    main=fgetl(f1);

    B=strsplit(main,' ');
    species=(B{1});


   local_low_temp=(B{end-3});
   local_low_temp=str2num(local_low_temp);

   local_med_temp=(B{end-1});
   local_med_temp=str2num(local_med_temp);

   local_high_temp=(B{end-2});
   local_high_temp=str2num(local_high_temp);


    line1=fgetl(f1);
    c=findstr(line1,'E');
    c1=line1(1:c(1)+3);
    c1=str2num(c1);
    c2=line1(c(1)+4:c(2)+3);
    c2=str2num(c2);
    c3=line1(c(2)+4:c(3)+3);
    c3=str2num(c3);
    c4=line1(c(3)+4:c(4)+3);
    c4=str2num(c4);
    c5=line1(c(4)+4:c(5)+3);
    c5=str2num(c5);


    line2=fgetl(f1);
    d=strfind(line2,'E');
    c6=line2(1:c(1)+3);
    c6=str2num(c6);
    c7=line2(c(1)+4:c(2)+3);
    c7=str2num(c7);
    c8=line2(c(2)+4:c(3)+3);
    c8=str2num(c8);
    c9=line2(c(3)+4:c(4)+3);
    c9=str2num(c9);
    c10=line2(c(4)+4:c(5)+3);
    c10=str2num(c10) ;


    line3=fgetl(f1);
    f=findstr(line3,'E');
    c11=line3(1:c(1)+3);
    c11=str2num(c11);
    c12=line3(c(1)+4:c(2)+3);
    c12=str2num(c12);
    c13=line3(c(2)+4:c(3)+3);
    c13=str2num(c13);
    c14=line3(c(3)+4:c(4)+3);
    c14=str2num(c14);


    T=linspace(local_low_temp,local_high_temp,500);


    for k=1:length(T)
    if T(k)>local_med_temp
        Cp(k)=(8.31)*(c1+(c2*(T(k)))+(c3*(T(k)^2))+(c4*(T(k)^3))+(c5*(T(k)^4)));
        H(k)=((8.31)*(T(k)))*(c1+(c2*(T(k))/2)+((c3*((T(k)^2))/3))+((c4*(T(k)^3))/4)+((c5*(T(k)^4))/5)+(c6/T(k)));
        S(k)=(8.31)*(c1*(log(T(k)))+(c2*(T(k)))+((c3*(T(k)^2))/2)+((c4*(T(k)^3))/3)+((c5*(T(k)^4))/4)+c7);
    else
        Cp(k)=(8.31)*(c8+(c9*(T(k)))+(c10*(T(k)^2))+(c11*(T(k)^3))+(c12*(T(k)^4)));
        H(k)=((8.31)*(T(k)))*((c8+c9*(T(k))/2)+((c10*((T(k)^2))/3))+((c11*(T(k)^3))/4)+((c12*(T(k)^4))/5)+(c13/T(k)));
        S(k)=(8.31)*(c8*(log(T(k)))+(c9*(T(k)))+((c10*(T(k)^2))/2)+((c11*(T(k)^3))/3)+((c12*(T(k)^4))/4)+c14);
    end
    end

   w=molecular_weight(species);

   mw_file=fopen('molecular_weight.txt','w');
   fprintf(mw_file,'molecular weight of %s id %d',species,w);
   fclose(mw_file);

   cd('C:\Users\dell\Documents\MATLAB')
   mkdir(species);
   cd(species);


figure(1)
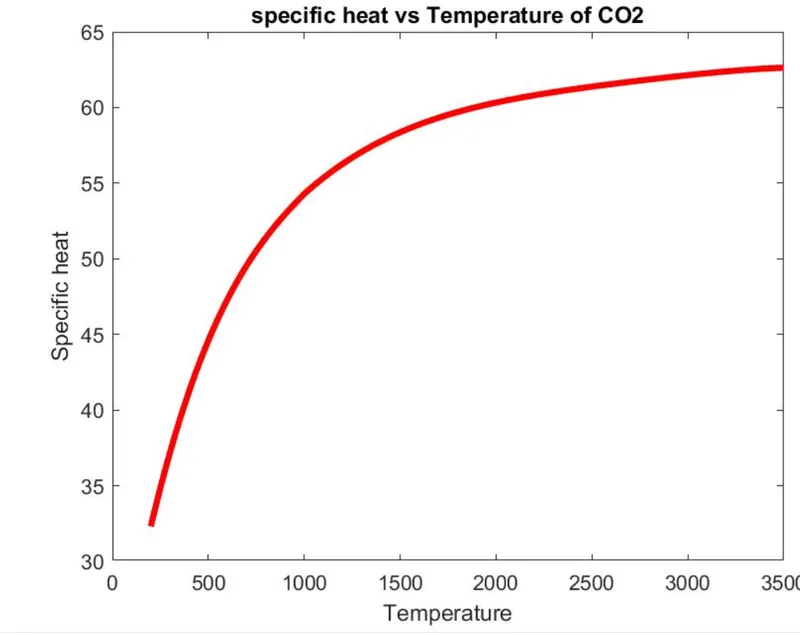
plot(T,Cp,'linewidth',3,'color','r')
xlabel('Temperature')
ylabel('Specific heat')
title(sprintf('specific heat vs Temperature of %s ',species));
saveas(figure(1),'specific heat.jpg')

figure(2)
plot(T,S,'linewidth',3,'color','b')
xlabel('Temperature')
ylabel('Entrophy')
title(sprintf('Entrophy vs Temperature of %s ',species));
saveas(figure(2),'Entrophy.jpg')

figure(3)
plot(T,H,'linewidth',3,'color','g')
xlabel('Temperature')
ylabel('Enthalpy')
title(sprintf('Enthalpy vs Temperature of %s ',species));
saveas(figure(3),'Enthalpy.jpg')

cd('C:\Users\dell\Documents')

w=molecular_weight(species)


end
FUNCTION:
function w=molecular_weight(species)

atomic_name=['H','C','O','N','Ar'];

atomic_weight=[1.008 12.011 15.999 14.007 39.948];

w=0;

for i=1:length(species)
    for j=1:length(atomic_name)
        if strcmp(species(i),atomic_name(j))
            w = w+atomic_weight(j);
            position=j;
        end
    end
    n=str2num(species);

    if n>1
        w = w+atomic_weight(position)*(n-1);
    end


end
fprintf('molecular_weight of %s ',species);
fprintf('%f',w)
disp(' ')
end
GRAPH PLOTTED FOR O2,NO2 AND CO2:
O2:
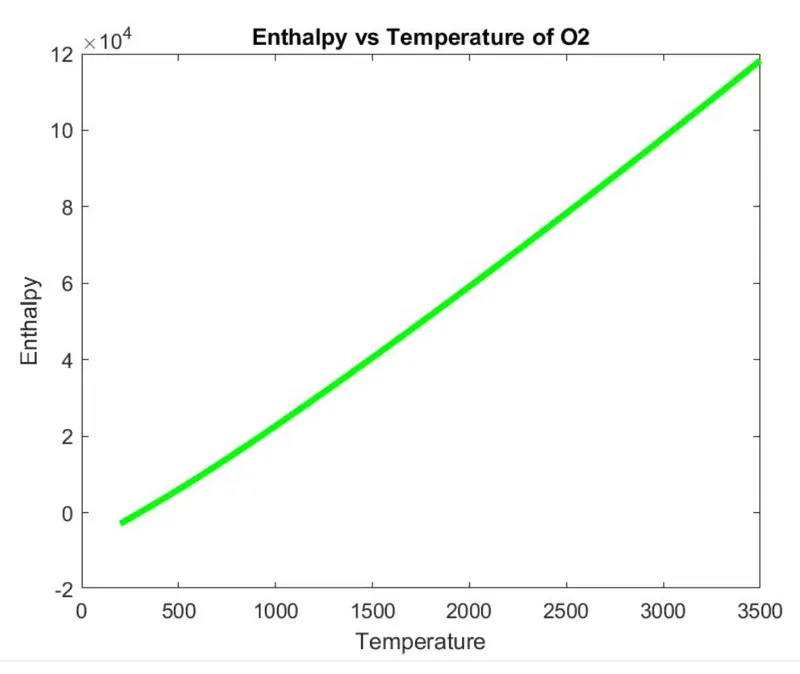
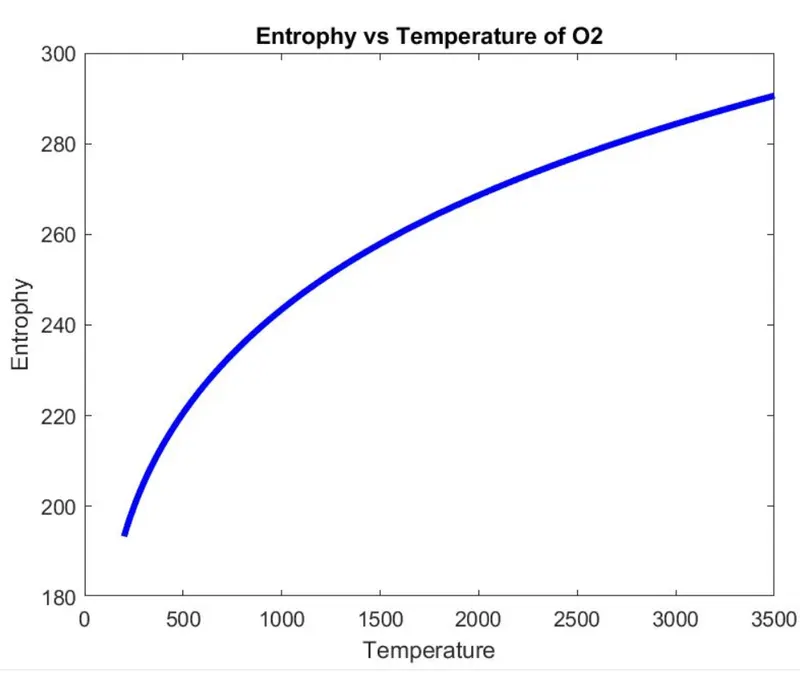
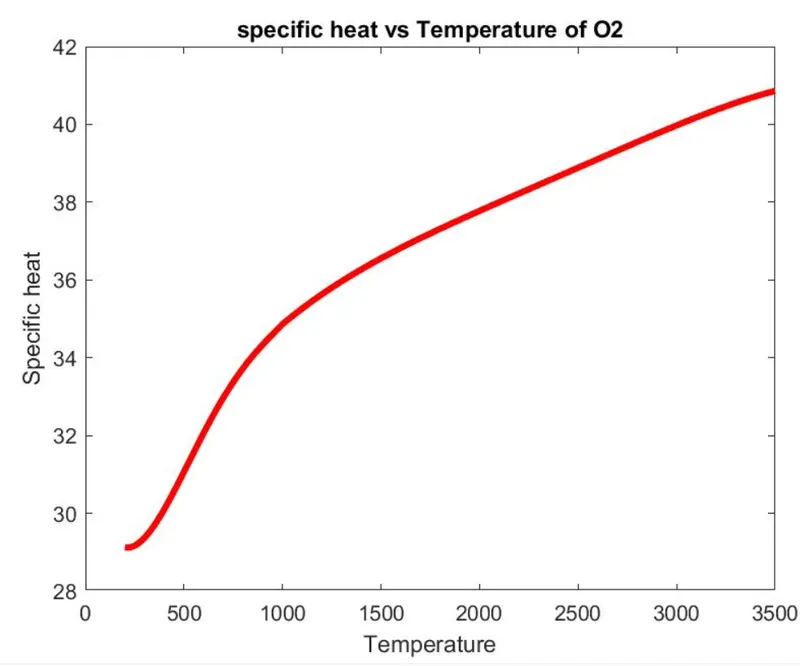
NO2:
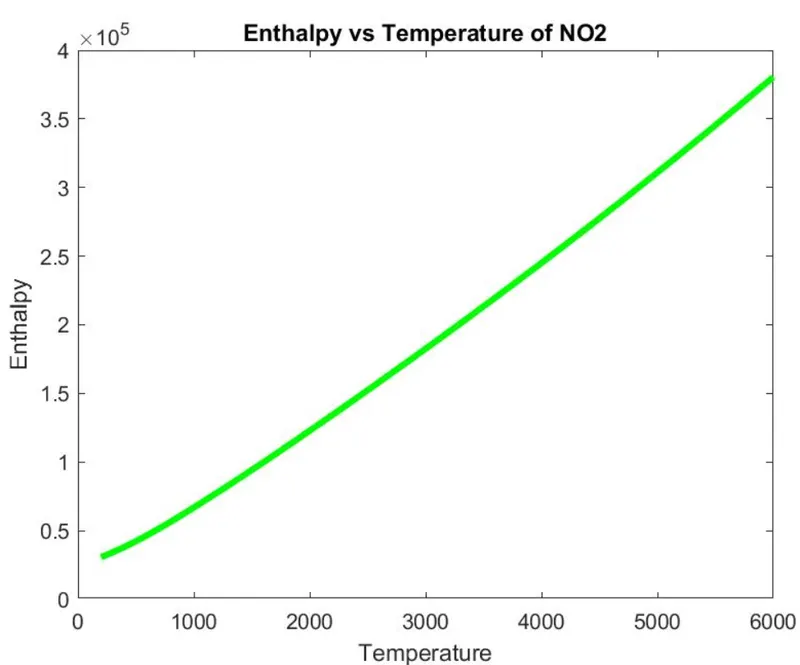
CO2:
OUTPUT AS REQUESTED ABOVE:
CONCLUSION:
With the data's in the given file the species data is displayed.