Project 1 - Parsing NASA thermodynamic data
AIM
To write a function that extracts the 14 co-efficients and calculates the Enthalpy, Entropy and Specific Heats for all the species in the data file using NASA THERMODYNAMIC DATA

- To calculate the molecular weight of each species and display it in the command window.
- To plot the Enthalpy, Entropy and Specific Heat for the local temperature range (low temperature: high temperature) specific for each species.
- To save the plots as images with appropriate names and dump them in separate folders for each species with suitable name. All these should be generated automatically.
- To generate Enthalpy, Entropy and Specific Heat plots using NASA THERMODYNAMIC DATA
PROCEDURE
FILE PARSING
File Parsing is a method used to read the information from a particular text file or any type of file and how we use the information in a computer program.
First thing we are going to do is read the given NASA THERMODYNAMIC DATA. To do so, Under Editor > Open a new script window > First we start with the basic flow. Now let us start with f1(File ID) equal to fopen(Stands for file open) and the file name as 'THERMO.dat' and the second argument we need to pass is the permission i.e ‘r’ to read the file. Now we have assigned this particular command to a variable called f1.
Now we access the Global Temperature. In order to access the temperature data from f1 we pass in the ‘fgetl’command. (‘fgetl’Read line from file, removing newline characters) And pass in the ’strsplit’ to split the temperature on ' '. (’strsplit’ Split string or character vector at specified delimiter). Then ‘convert the string (array) to number’ of the global_low_temp, global_mid_temp, global_high_temp using ‘str2num’ (Convert character array or string to numeric array) of T {1}, {2}, {3} respectively. {} braces is used to access the Temperature of a particular cell in a cell array.
Then we use this for loop command to skip the title from the given NASA THERMODYNAMIC DATA.
for i = 1:3
fgetl(f1);
end
Next thing we need to pass in the value of Universal Gas Constant ‘R = 8.3145’. Now Again we use the for loop command to read the 53 species from the given NASA THERMODYNAMIC DATA. We pass in the ‘fgetl’of f1 at line_1. And split the data of line_1 using ’strsplit’ at x. And write length of x is z.
Now we store the Temperature values as numbers. To do so, we use ‘str2double’to convert strings to double precision values as below
low_temp=str2double(x{z-3});
mid_temp=str2double(x{z-1});
high_temp=str2double(x{z-2});
species_name=x{1};
Here we access the Temperature data from line1 and we find the string from line1 temperature with the help of the input ‘E’. Then convert the value of the coefficient with the str2num command which converts the string (array) to number. So in line1 we calculate the thermodynamic properties of coefficients from a1 to a5. Similarly we do for line2 a6 to a10, Line3 a11 to a14.
Next we have to define the temperature range by using linspace command. Linspace of low_temp ,3500, 1000 at T. So now we have defined the temperature range upto 3500.
Now we write a function that extracts the 14 co-efficients and calculates the Enthalpy, Entropy and Specific Heats for all the species in the data file using NASA THERMODYNAMIC DATA.
Calculating Enthalpy, Entropy and Specific Heat by calling the below functions
H = Enthalpy(a1,a2,a3,a4,a5,a6,a8,a9,a10,a11,a12,a13,R,T,mid_temp)
S = Entropy(a1,a2,a3,a4,a5,a7,a8,a9,a10,a11,a12,a14,R,T,mid_temp)
Cp = Specific_Heat(a1,a2,a3,a4,a5,a8,a9,a10,a11,a12,R,T,mid_temp)
H – Enthalpy, S – Entropy and Cp – Specific Heat
CALLING THE ENTHALPY FUNCTION
function H = Enthalpy(a1,a2,a3,a4,a5,a6,a8,a9,a10,a11,a12,a13,R,T,mid_temp)
In H – Enthalpy the calculated thermodynamic properties of each speices a1,a2,a3,a4,a5,a6,a8,a9,a10,a11,a12,a13 along with the universal gas constant, temperature, mid_temp is used to extract the co-efficients.
if T < mid_temp
H=(a8+(a9.*T)/2+(a10.*T.^2)/3+(a11.*T.^3)/4+(a12.*T.^4)/5+(a13./T))*R.*T;
else
H=(a1+(a2.*T)/2+(a3.*T.^2)/3+(a4.*T.^3)/4+(a5.*T.^4)/5+(a6./T))*R.*T;
end
‘If’ statement is used to execute that the Temperature T is less than the mid_temp. So we pass in the first enthalpy as higher temperature along with the calculated thermodynamic properties and we use ‘else’ to pass in another expression of enthalpy as lower temperature and end the function with end command.
CALLING THE ENTROPY FUNCTION
function S = Entropy(a1,a2,a3,a4,a5,a7,a8,a9,a10,a11,a12,a14,R,T,mid_temp)
In S – Entropy the calculated thermodynamic properties of each speices a1,a2,a3,a4,a5,a7,a8,a9,a10,a11,a12,a14 along with the universal gas constant, temperature, mid_temp is used to extract the co-efficients.
if T < mid_temp
S= ((a8.*(log(T)))+(a9.*T)+(a10.*(T.^2)./2)+(a11.*(T.^3)./3)+(a12.*(T.^4)./4)+a14).*R;
else
S= ((a1.*(log(T)))+(a2.*T)+(a3.*(T.^2)./2)+(a4.*(T.^3)./3)+(a5.*(T.^4)./4)+a7).*R;
end
‘If’ statement is used to execute that the Temperature T is less than the mid_temp. So we pass in the first enthalpy as higher temperature along with the calculated thermodynamic properties and we use ‘else’ to pass in another expression of enthalpy as lower temperature and end the function with end command.
CALLING THE SPECIFIC HEAT FUNCTION
function Cp = Specific_Heat(a1,a2,a3,a4,a5,a8,a9,a10,a11,a12,R,T,mid_temp)
In Cp – Specific Heat the calculated thermodynamic properties of each speices a1,a2,a3,a4,a5,a8,a9,a10,a11,a12 along with the universal gas constant, temperature, mid_temp is used to extract the co-efficients.
if T< mid_temp
Cp=(a8+a9.*T+a10.*T.^2+a11.*T.^3+a12.*T.^4)*R;
else
Cp=(a1+a2.*T+a3.*T.^2+a4.*T.^3+a5.*T.^4)*R;
end
‘If’ statement is used to execute that the Temperature T is less than the mid_temp. So we pass in the first enthalpy as higher temperature along with the calculated thermodynamic properties and we use ‘else’ to pass in another expression of enthalpy as lower temperature and end the function with end command.
Now we create a new folder with species name to store its plots in current directory using ‘mkdir’ command.
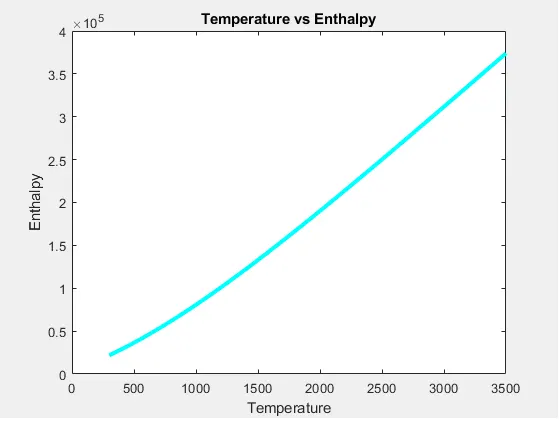
Next we are plotting ‘Temperature vs Enthalpy’ as figure(1) with plot command where x is T(temperature) and y is H(Enthalpy) with a linewidth of 3 and color as c(cyan). xlabel is set to Temperature and ylabel is set to Enthalpy. Title of the plot is set as ‘Temperature vs Enthalpy’.
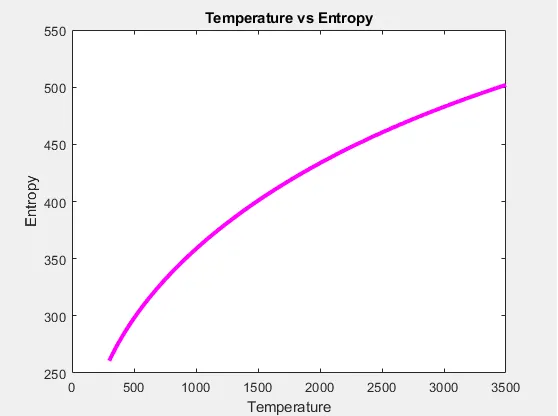
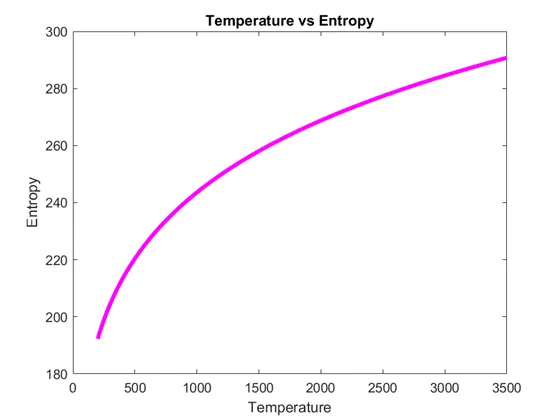
Similarly we are plotting for ‘Temperature vs Entropy’ as figure(2) with plot command where x is T(temperature) and y is S(Entropy) with a linewidth of 3 and color as m(magenta). xlabel is set to Temperature and ylabel is set to Entropy. Title of the plot is set as ‘Temperature vs Entropy’.
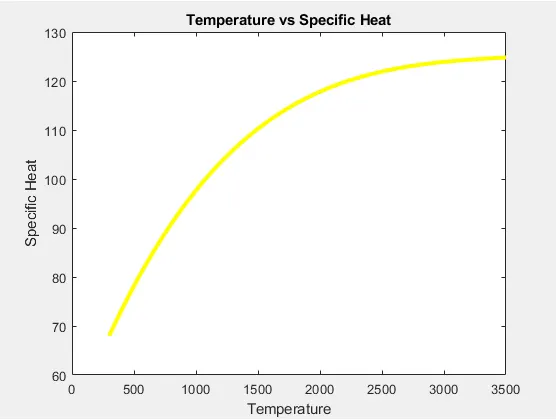
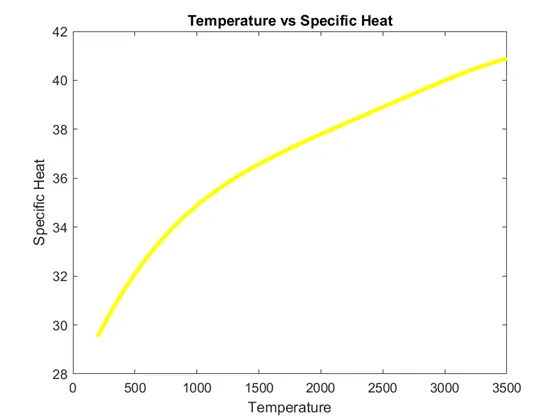
And plotting for ‘Temperature vs Specific Heat’ as figure(3) with plot command where x is T(temperature) and y is H(Specific Heat) with a linewidth of 3 and color as y(yellow). xlabel is set to Temperature and ylabel is set to Specific Heat. Title of the plot is set as ‘Temperature vs Specific Heat’
Now we use saveas command to save the plot graph .png file of Temperature vs Enthalpy, Entropy and Specific Heat in the current directory for each coefficients.
Calculating molecular weight by calling the function
mole_weight = molecular_weight(species_name)
CALLING THE MOLECULAR WEIGHT FUNCTION
function mole_weight = molecular_weight(species_name)
Define the function for mole_weight to molecular_weight of species_name. Then define the elements 'O','H','C','N','A' and their respective atomic weights 16,1,12,14,40 assign mole_weight as zero. Here by using for loop command we compare the elements to read the species_name.
for k = 1:length(species_name)
for l = 1:length(elements)
if strcmp(species_name(k),elements(l))
Now calculate the mole_weight to mole_weight plus atomic_weight(l). Then save the position to l and end the for loop with two end command.
Here n is equal to str2double of species_name of k. ‘If’ statement is used to execute n is greater than one. Now by adding atomic weight i.e mole_weight is equal to mole_weight plus atomic_weight of position multiplied by n minus one. Now end the function with three end commands.
Finally to display the molecular weight of each coefficients in the command window we pass in the command as mol equal to fprintf(formats data and displays the result in command window) 'Molecular Weight of %s: %f \n',species_name,mole_weight and end the loop with end command.
SCRIPT WINDOW
clear all
close all
clc


f1 = fopen('THERMO.dat','r')
first_line = fgetl(f1);

% Global Temperature

Temp = fgetl(f1);
T = strsplit(Temp,' ');

global_low_temp = str2num(T{1});
global_mid_temp = str2num(T{2});
global_high_temp = str2num(T{3});


for i = 1:3
 fgetl(f1);
end

% Universal Gas Constant

R = 8.3145;


for j = 1:53

 line_1=fgetl(f1);
 x=strsplit(line_1,' ');
 z=length(x);

 % Storing the temp values as numbers

 low_temp=str2double(x{z-3});
 mid_temp=str2double(x{z-1});
 high_temp=str2double(x{z-2});
 species_name=x{1};

% Line1

 tline1 = fgetl(f1);
 a = findstr(tline1,'E');

 a1 = tline1(1:a(1)+3);

 a1 = str2num(a1);

 a2 = tline1(a(1)+4:a(2)+3);

 a2 = str2num(a2);

 a3 = tline1(a(2)+4:a(3)+3);

 a3 = str2num(a3);

 a4 = tline1(a(3)+4:a(4)+3);

 a4 = str2num(a4);

 a5 = tline1(a(4)+4:a(5)+3);

 a5 = str2num(a5);

 % Line2

 tline2 = fgetl(f1);
 a = findstr(tline1,'E');


 a6 = tline2(1:a(1)+3);

 a6 = str2num(a6);

 a7 = tline2(a(1)+4:a(2)+3);

 a7 = str2num(a7);

 a8 = tline2(a(2)+4:a(3)+3);

 a8 = str2num(a8);

 a9 = tline2(a(3)+4:a(4)+3);

 a9 = str2num(a9);

 a10 = tline2(a(4)+4:a(5)+3);

 a10 = str2num(a10);


 % Line3

 tline3 = fgetl(f1);
 a = findstr(tline1,'E');


 a11 = tline3(1:a(1)+3);

 a11 = str2num(a11);

 a12 = tline3(a(1)+4:a(2)+3);

 a12 = str2num(a12);

 a13 = tline3(a(2)+4:a(3)+3);

 a13 = str2num(a13);

 a14 = tline3(a(3)+4:a(4)+3);

 a14 = str2num(a14);

% Defining Temperature Range

 T = linspace(low_temp,3500,1000);

% Calculating Enthalpy, Entropy and Specific Heat

 H = Enthalpy(a1,a2,a3,a4,a5,a6,a8,a9,a10,a11,a12,a13,R,T,mid_temp);

 S = Entropy(a1,a2,a3,a4,a5,a7,a8,a9,a10,a11,a12,a14,R,T,mid_temp);

 Cp = Specific_Heat(a1,a2,a3,a4,a5,a8,a9,a10,a11,a12,R,T,mid_temp);


%  % creaing a new folder with species name to store its plots
mkdir(species_name)
cd(species_name)
 %Plotting
 figure(1)
 plot(T,H,'linewidth',3,'color','c');
 xlabel('Temperature');
 ylabel('Enthalpy');
 title('Temperature vs Enthalpy')

 %Plotting
 figure(2)
 plot(T,S,'linewidth',3,'color','m');
 xlabel('Temperature');
 ylabel('Entropy');
 title('Temperature vs Entropy')

 %Plotting
 figure(3)
 plot(T,Cp,'linewidth',3,'color','y');
 xlabel('Temperature');
 ylabel('Specific Heat');
 title('Temperature vs Specific Heat')


    saveas(1,'Enthalpy.png')
    saveas(2,'Entropy.png')
    saveas(3,'Specific_Heat.png')
    cd  ..


  mole_weight = molecular_weight(species_name); %Function Calling Moleculat wt caclulcation

  % Display Molecular weight in command window


 mol=fprintf('Molecular Weight of %s: %f  \n',species_name,mole_weight);
end
SCRIPT WINDOW - CALL FUNCTION 'ENTHALPY'
function H = Enthalpy(a1,a2,a3,a4,a5,a6,a8,a9,a10,a11,a12,a13,R,T,mid_temp)

if T < mid_temp
  H=(a8+(a9.*T)/2+(a10.*T.^2)/3+(a11.*T.^3)/4+(a12.*T.^4)/5+(a13./T))*R.*T;
else
    H=(a1+(a2.*T)/2+(a3.*T.^2)/3+(a4.*T.^3)/4+(a5.*T.^4)/5+(a6./T))*R.*T;
end
SCRIPT WINDOW - CALL FUNCTION 'ENTROPY'
function S = Entropy(a1,a2,a3,a4,a5,a7,a8,a9,a10,a11,a12,a14,R,T,mid_temp)

if T < mid_temp
S= ((a8.*(log(T)))+(a9.*T)+(a10.*(T.^2)./2)+(a11.*(T.^3)./3)+(a12.*(T.^4)./4)+a14).*R;
else
S= ((a1.*(log(T)))+(a2.*T)+(a3.*(T.^2)./2)+(a4.*(T.^3)./3)+(a5.*(T.^4)./4)+a7).*R;
end
SCRIPT WINDOW - CALL FUNCTION 'SPECIFIC HEAT'
function Cp = Specific_Heat(a1,a2,a3,a4,a5,a8,a9,a10,a11,a12,R,T,mid_temp)

if T< mid_temp
Cp=(a8+a9.*T+a10.*T.^2+a11.*T.^3+a12.*T.^4)*R;

else
Cp=(a1+a2.*T+a3.*T.^2+a4.*T.^3+a5.*T.^4)*R;
end
SCRIPT WINDOW - CALL FUNCTION 'MOLECULAR WEIGHT'
function mole_weight = molecular_weight(species_name)
elements = ['O','H','C','N','A'];
atomic_weight = [16,1,12,14,40];
mole_weight = 0;
for k = 1:length(species_name)
   for l = 1:length(elements)
      if strcmp(species_name(k),elements(l))
        mole_weight = mole_weight + atomic_weight(l);
% Saving position
     positon = l;
      end
    end

 n = str2double(species_name(k));
 if n>1
% Adding Atomic weight
 mole_weight = mole_weight + (atomic_weight(positon))*(n-1);
 end
end


end
PLOT GRAPH – figure(1) ‘Temperature vs Enthalpy’
PLOT GRAPH – figure(2) ‘Temperature vs Entropy’
PLOT GRAPH – figure(3) ‘Temperature vs Specific Heat’
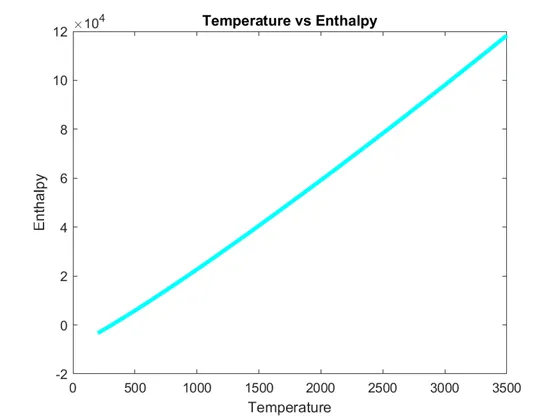
PLOT GRAPH OF O2
PLOT GRAPH OF N2
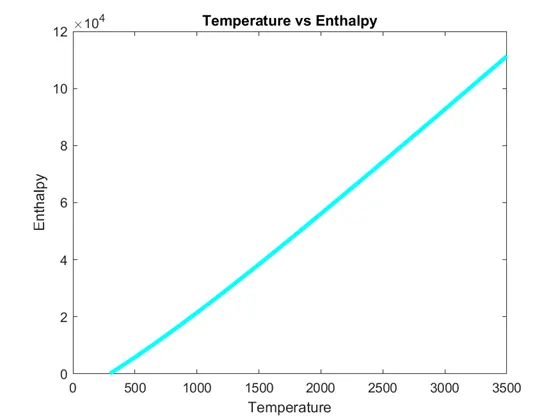
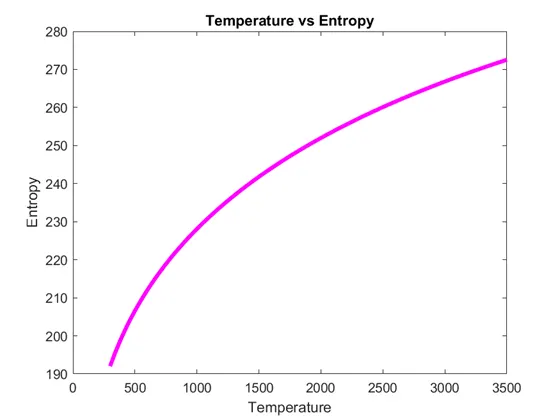
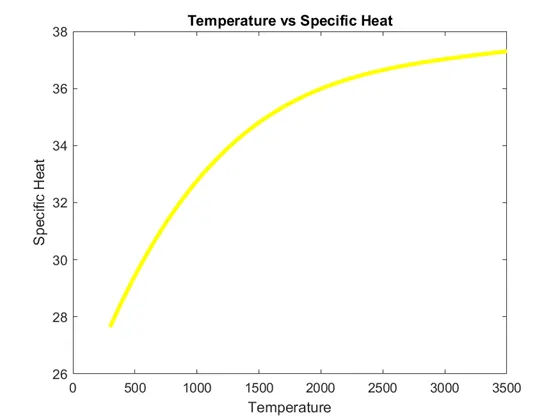
PLOT GRAPH OF CO2
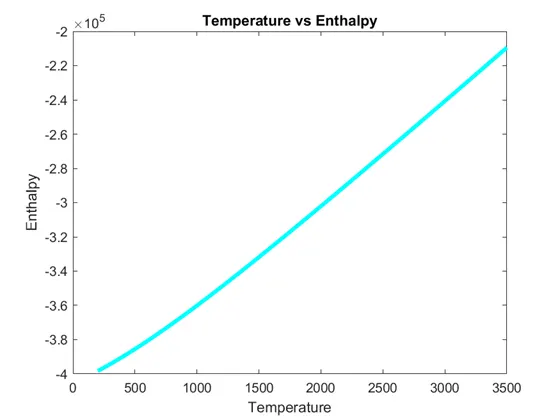
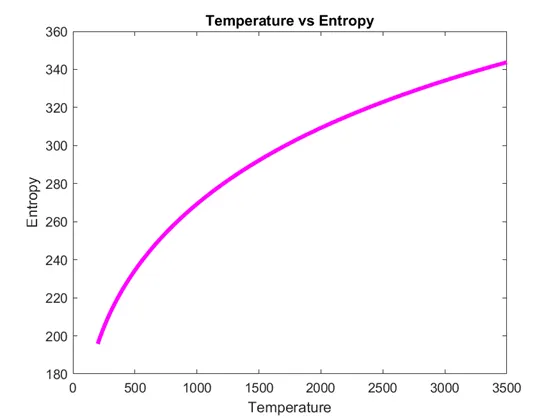
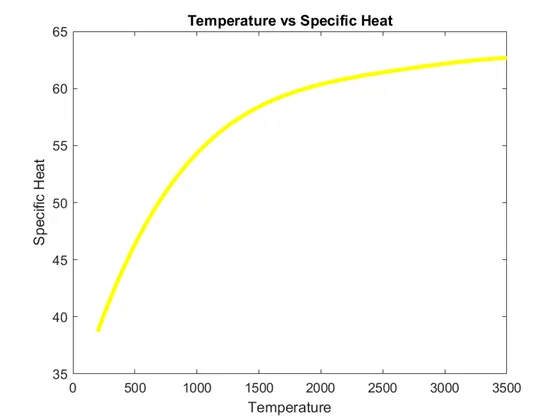
COMMAND WINDOW
f1 =

     7

Molecular Weight of O: 16.000000
Molecular Weight of O2: 32.000000
Molecular Weight of H: 1.000000
Molecular Weight of H2: 2.000000
Molecular Weight of OH: 17.000000
Molecular Weight of H2O: 18.000000
Molecular Weight of HO2: 33.000000
Molecular Weight of H2O2: 34.000000
Molecular Weight of C: 12.000000
Molecular Weight of CH: 13.000000
Molecular Weight of CH2: 14.000000
Molecular Weight of CH2(S): 14.000000
Molecular Weight of CH3: 15.000000
Molecular Weight of CH4: 16.000000
Molecular Weight of CO: 28.000000
Molecular Weight of CO2: 44.000000
Molecular Weight of HCO: 29.000000
Molecular Weight of CH2O: 30.000000
Molecular Weight of CH2OH: 31.000000
Molecular Weight of CH3O: 31.000000
Molecular Weight of CH3OH: 32.000000
Molecular Weight of C2H: 25.000000
Molecular Weight of C2H2: 26.000000
Molecular Weight of C2H3: 27.000000
Molecular Weight of C2H4: 28.000000
Molecular Weight of C2H5: 29.000000
Molecular Weight of C2H6: 30.000000
Molecular Weight of CH2CO: 42.000000
Molecular Weight of HCCO: 41.000000
Molecular Weight of HCCOH: 42.000000
Molecular Weight of H2CN: 28.000000
Molecular Weight of HCN: 27.000000
Molecular Weight of HNO: 31.000000
Molecular Weight of N: 14.000000
Molecular Weight of NNH: 29.000000
Molecular Weight of N2O: 44.000000
Molecular Weight of NH: 15.000000
Molecular Weight of NH2: 16.000000
Molecular Weight of NH3: 17.000000
Molecular Weight of NO: 30.000000
Molecular Weight of NO2: 46.000000
Molecular Weight of HCNO: 43.000000
Molecular Weight of HOCN: 43.000000
Molecular Weight of HNCO: 43.000000
Molecular Weight of NCO: 42.000000
Molecular Weight of CN: 26.000000
Molecular Weight of HCNN: 41.000000
Molecular Weight of N2: 28.000000
Molecular Weight of AR: 40.000000
Molecular Weight of C3H8: 44.000000
Molecular Weight of C3H7: 43.000000
Molecular Weight of CH3CHO: 44.000000
Molecular Weight of CH2CHO: 43.000000
>>
ERROR
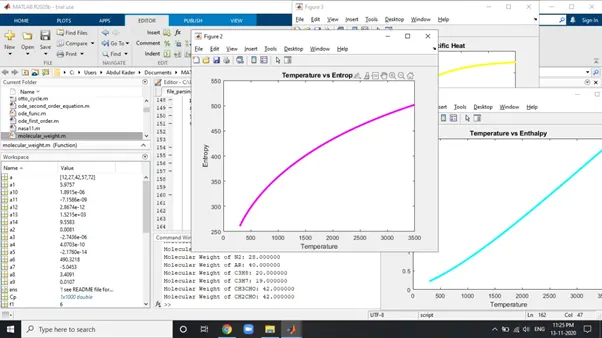
Molecular weight of some coefficients were calculated wrong. It happened because I’ve mentioned the coefficient element as Ar. And I have used three end command for two for loops. After changing coefficient element Ar to A and removal of the extra end command the program run successfully with exact molecular weight.