Project 1 - Parsing NASA thermodynamic data
Aim:To read nasa thermodynamic data and extract 14 coefficients and calculate enthalpy,entropy and specific heat for all the species in the data file.
Code explanation:
1.We obtain the thermodynamic data from the nasa file by using the fopen command.Data obtained from file using fgetl is retrieved and read.
2.Retrieved data is in the form of a string and will have to be split by using strsplit.Now we convert string to number(str2double) and find the position of the coeffiecients so that the necessary calculations can be done.
3.For loop is used to obtain the necessary data of all the species in the file.
4.With the species in hand, we write function codes for enthalpy,entropy and specific heat for all species found in the file.Formula for each is as follows:
Enthalpy: CP/R=a1+a2+a3^2+a4t^3+a5t^4
Entropy:H/RT=a1+a2t/2+a3t^2/3+a4t^3/4+a5t^4/5+a6/t
Specific heat: S/R=a1 1nt+a2t+a3t^2/2+a4t^3/3+a5t^4/4+a7
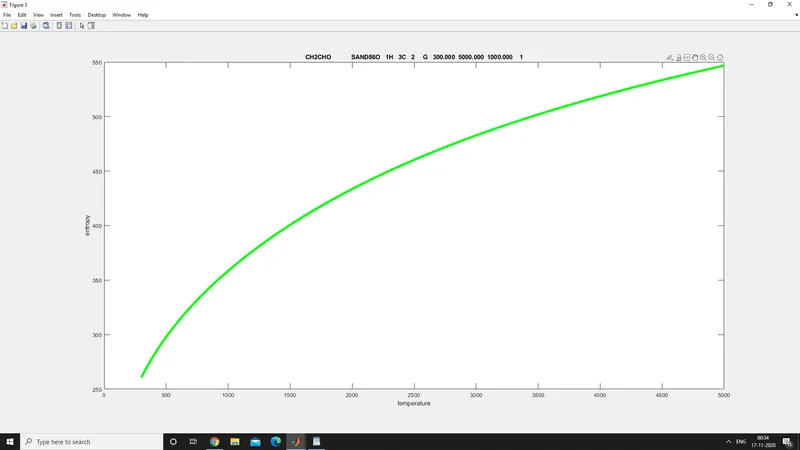
5.Once the values are calculated, output graphs are obtained and the molecular weight for each species is calculated.
6.The average mass of a molecule of a compound is 1/12th the mass of carbon 12 and is calculated as the sum of atomic weights of the constituent atoms.
7. Directory was created to store the plots of the graphs using cd,save as,mkdir.
MAIN CODE:
clear all
close all
clc
r=8.314;
f1 = fopen('THERMO.dat','r');
l1=fgetl(f1);
l2=fgetl(f1);
t=strsplit(l2);
global_low=str2num(t{2});
global_mid=str2num(t{3});
global_high=str2num(t{4});
temp=linspace(global_low,global_high,400);
%extracting the coefficients
for i=1:3
fgetl(f1);
end
for i= 1:53
line_1 = fgetl(f1);
A=strsplit(line_1,'');
species_name=(A{1});
line_2=fgetl(f1);
line_3=fgetl(f1);
line_4=fgetl(f1);
a=strfind(line_2,'E');
b=strfind(line_3,'E');
c=strfind(line_4,'E');
a1=str2double(line_2(1:a(1)+3));
a2=str2double(line_2(a(1)+4:a(2)+3));
a3=str2double(line_2(a(2)+4:a(3)+3));
a4=str2double(line_2(a(3)+4:a(4)+3));
a5=str2double(line_2(a(4)+4:a(5)+3));
a6=str2double(line_3(1:b(1)+3));
a7=str2double(line_3(b(1)+4:b(2)+3));
b1=str2double(line_3((b(2)+4:b(3)+3)));
b2=str2double(line_3(b(3)+4:b(4)+3));
b3=str2double(line_3(b(4)+4:b(5)+3));
b4=str2double(line_4(1:c(1)+3));
b5=str2double(line_4(c(1)+4:c(2)+3));
b6=str2double(line_4(c(2)+4:c(3)+3));
b7=str2double(line_4(c(3)+4:c(4)+3));
s=entropy(a1,a2,a3,a4,a5,a7,b1,b2,b3,b4,b5,b7,r,temp,global_mid);
h=enthalpy(a1,a2,a3,a4,a5,a6,b1,b2,b3,b4,b5,b6,r,temp,global_mid);
c_p=spec_heat(a1,a2,a3,a4,a5,b1,b2,b3,b4,b5,r,temp,global_mid);
figure(1)
plot(temp,c_p,'linewidth',3,'color','r');
title(species_name)
xlabel("temperature")
ylabel("specific heat")
figure(2)
plot(temp,h,'linewidth',4,'color','b');
title(species_name)
xlabel("temperature")
ylabel("enthalpy")
figure(3)
plot(temp,s,'linewidth',4,'color','g');
title(species_name)
xlabel("temperature")
ylabel("entropy")
cd(pwd);
dir_name=species_name;
mkdir(['C:\Users\Vishnu\Documents\MATLAB\New folder']);
cd(['C:\Users\Vishnu\Documents\MATLAB\New folder'])
saveas(1,'c_p.jpeg')
saveas(2,'h.jpeg')
saveas(3,'s.jpeg')
cd
f=molecular_weight(species_name);
fprintf('mw%f',species_name,f);
end
Calculating enthalpy:
function [h]=enthalpy(a1,a2,a3,a4,a5,a6,b1,b2,b3,b4,b5,b6,r,temp,global_mid)
if temp <= global_mid
h=r.*temp.*(b1+b2(temp./2))+(b3.*(temp./3))+(b4.*(temp./4))+(b5.*(temp./5))+(b6./temp);
else
h=r.*temp.*(a1+(a2.*(temp./2))+(a3.*(temp./3))+(a4.*(temp./4))+(a5.*(temp./5))+(a6./temp));
end
Calculating entropy:
function [s]=entropy(a1,a2,a3,a4,a5,a7,b1,b2,b3,b4,b5,b7,r,temp,global_mid)
if temp<=global_mid
s=r.*(b1.*log(temp)+(b2.*temp)+(b3.*(temp).^2./2))+(b4.*(((temp).^3)./3))+(b5.*(((temp).^4))+b7);
else
s=r*(a1.*log(temp)+(a2.*temp)+(a3.*(((temp).^2)./2))+(a4.*(((temp).^3)./3))+(a5.*(((temp).^4)./4))+a7);
end
Calculating specific heat:
function [c_p]=spec_heat(a1,a2,a3,a4,a5,b1,b2,b3,b4,b5,r,temp,global_mid)
if temp <= global_mid
c_p=r*(b1+(b2*temp)+(b3*temp.^2)+(b4*(temp).^3)+(b5*(temp).^4));
else
c_p=r*(a1+(a2*temp)+(a3*(temp).^2)+(a4*(temp).^3)+(a5*(temp).^4));
end
Calculating molecular weight:
function [mw]=molecular_weight(species_name)
species=(species_name)
element={'H' 'C' 'N' 'O' 'Ar'};
atomic_weight=[1 12 14 16 20];
mw=0;
for i=1:length(species_name)
for j=1:length(element)
if strcmp(species_name(i),element(j))
mw=mw+atomic_weight(j);
x=j;
n=str2double(species_name(i));
if n>1
mw=(mw+(atomic_weight)*(x)*(n-1));
end
end
end
end
end
Output plots:
Figure 1: Specific heat vs temperature
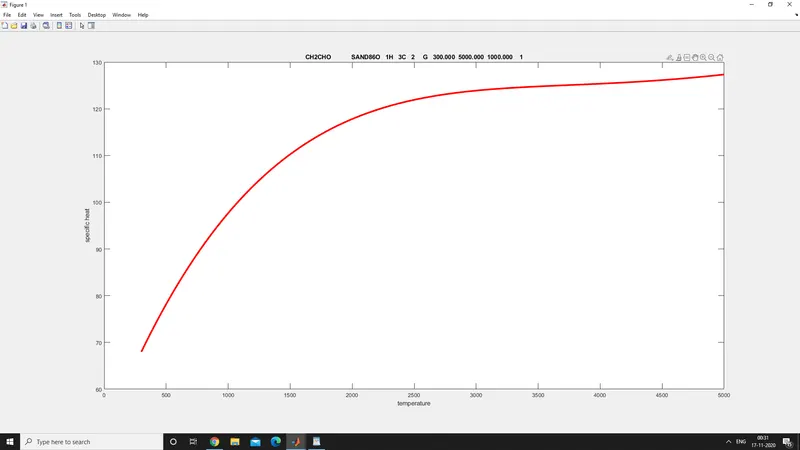
Figure 2: Enthalpy vs temperature
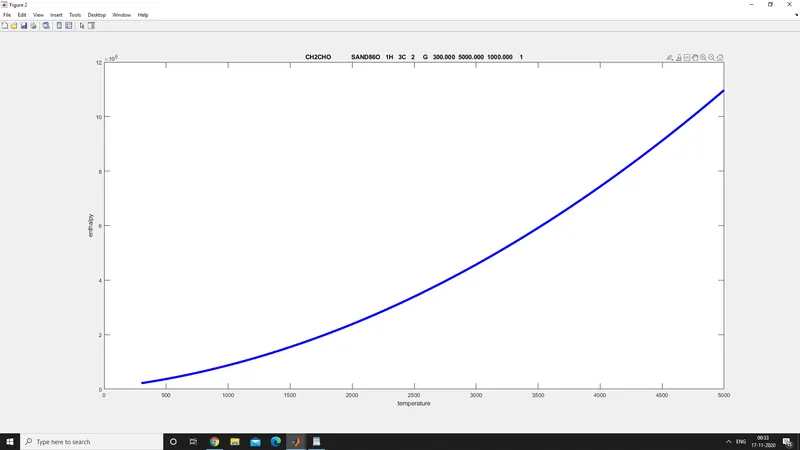
Figure 3: Entropy vs temperature
Molecular weight of the species:
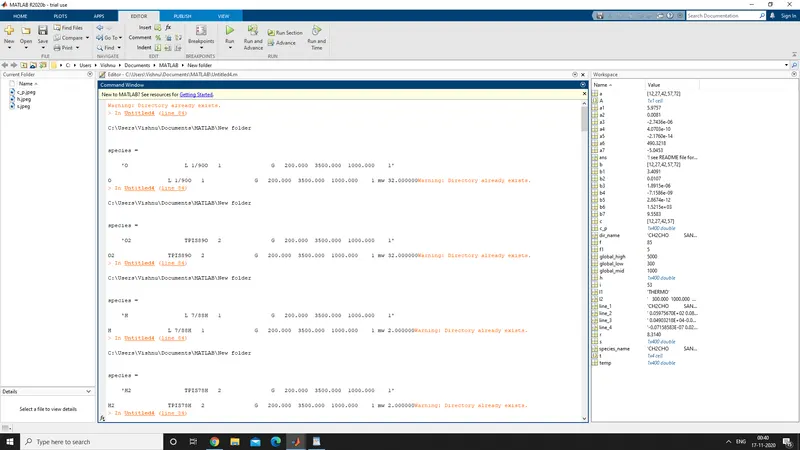
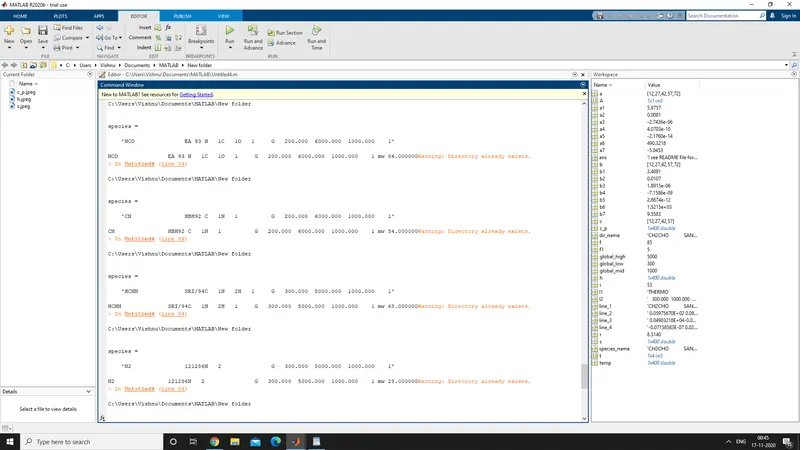
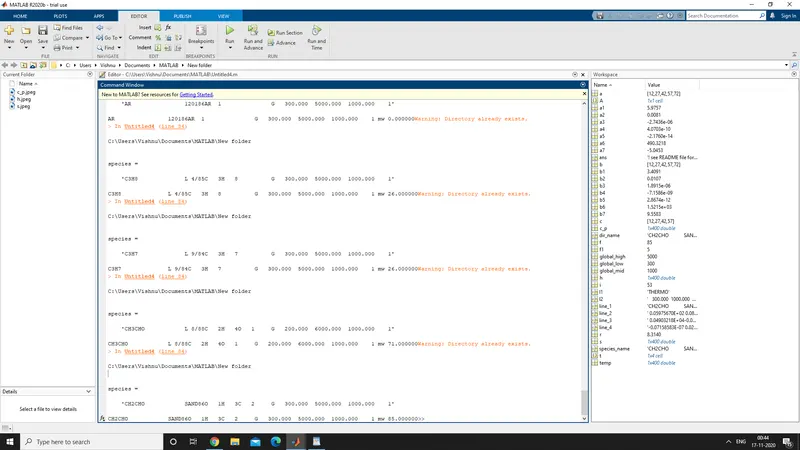
The molecular weight calculations were done and values were obtained for each of the 53 species.
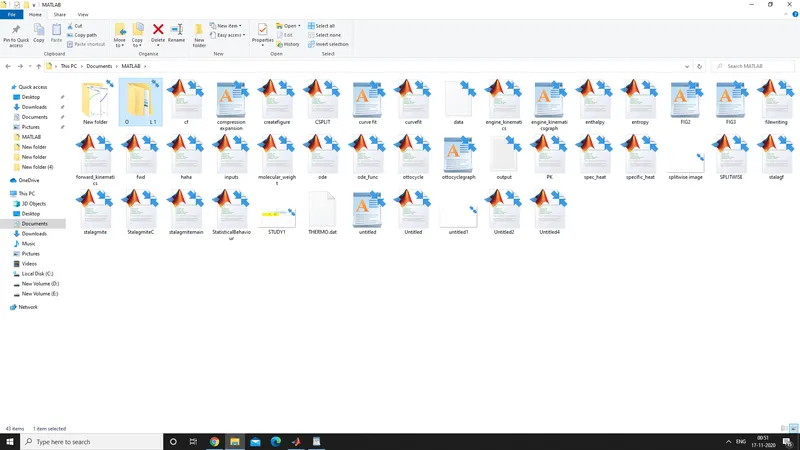
Plots: Plots of the calculations were stored in the directory created(new folder).
Errors faced:
1.Error was obtained for molecular weight calculations due to missing parantheses and different function names.
2.Directory path errors were found which was later corrected by deleting existing folders.
3.Array indices must be positive error was corrected by changing the name of function used.
Conclusion:
Nasa thermodynamic data was read and the specific heat,enthalpy and entropy were calculated and graphs were plotted.These plots were stored in a directory. The molecular weight of each species was calculated and reported.
References:
1.Mathworks website for making directory.