Project 1 - Parsing NASA thermodynamic data
Aim:
To read and write Matlab code to extract and calculate the enthalpy, entropy, and specific heat of the various gas species from the given NASA thermodynamic data.
Objectives:
- To write a code for extracting 14 coefficients and to calculate the thermodynamic properties of the various gas species.
- To calculate and display the molecular weight of each species.
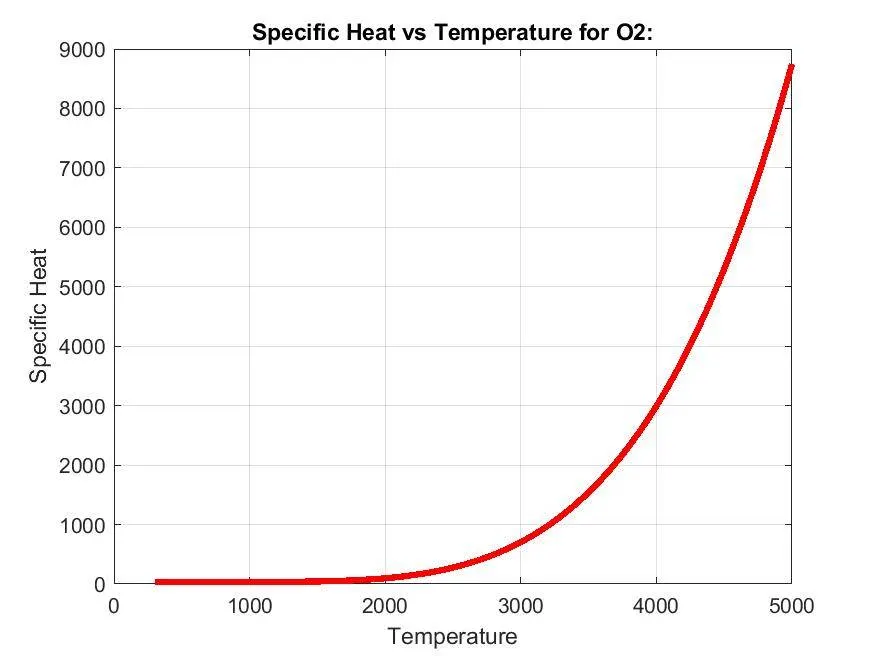
- To plot specific heat, enthalpy, and entropy curves for each species.
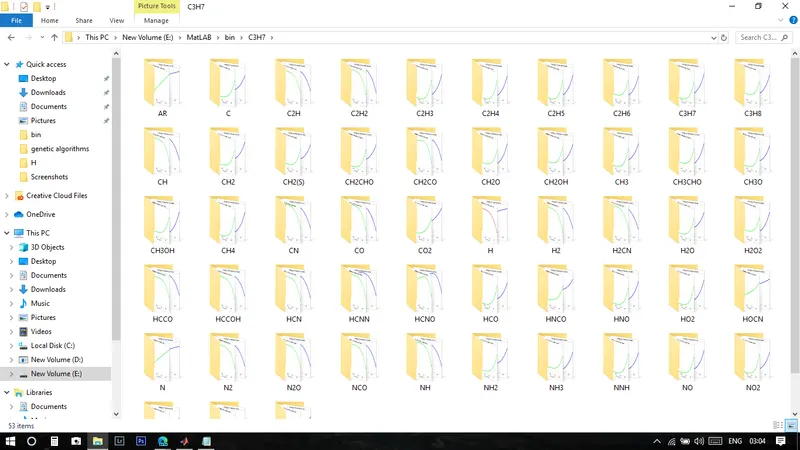
- To save the plot images in separate folders for each species.
Theory:
Parsing in computer languages refers to the syntactic analysis of the input code/file into its components parts in order to facilitate the writing of compilers and interpreters. It can be used to describe split or separation. Here, we read data from the 'THERMO.dat' file issued by NASA which contains data about the gas elements.
To calculate the specific heat, enthalpy, and entropy from the given data's below formulas have been used,
`(Cp)/R = a1+a2*T+a3*T^2+a4*T^3+a5*T^4`
`H/(RT)=a1+(a2*T)/2+(a3*T^2)/3+(a4*T^3)/4+(a5*T^4)/5+(a6)/T`
`S/R=a1*lnT+a2*T+(a3*T)/2+(a4*T^3)/3+(a5*T^4)/4+a7`
where
Cp = specific heat
H = enthalpy
S = entrophy
R = universal gas constant
T = temperature
Program:
The functional codes to be used in the main program is given below, These codes are used to calculate the molecular mass, Cp, H and S.
function [MW] = molecular_weight(name)
    s = {'H' 'C' 'N' 'O' 'R'};
    fprintf('Molecular Weight of ');
    fprintf(name);
    fprintf(' : ');

    %atomic weight of each indivisuals
    atomicweight = [1 12 14 16 40];
    MW = 0;
    for i = 1:length(name)
        for j = 1:length(s)
            if strcmp(name(i), s(j))
                MW = MW + atomicweight(j);
                %Storing the position of matched element
                position = j;
            end
        end
        n = str2num(name(i));
        if n > 1
            MW = MW + atomicweight(position)*(n-1);
        end
    end
    fprintf('%d',MW);
    disp(' ');
end
function cp=specific_heat(a1,a2,a3,a4,a5,b1,b2,b3,b4,b5,t,R,global_mid_temp)
if t<=global_mid_temp
cp=R*(a1+a2.*(t)+a3.*(t.^2)+a4.*(t.^3)+a5.*(t.^4));
else
cp=R*(b1+b2.*(t)+b3.*(t.^2)+b4.*(t.^3)+b5.*(t.^4));
endfunction h=enthalpy(a1,a2,a3,a4,a5,a6,b1,b2,b3,b4,b5,b6,t,R,global_mid_temp)
if t<=global_mid_temp
h=R*(a1.*t+a2.*(t.^2)./2+a3.*(t.^3)./3+a4.*(t.^4)./4+a5.*(t.^5)./5+a6);
else
h=R*(b1.*t+b2.*(t.^2)./2+b3.*(t.^3)./3+b4.*(t.^4)./4+b5.*(t.^5)./5+b6);
endfunction s=entropy(a1,a2,a3,a4,a5,a7,b1,b2,b3,b4,b5,b7,t,R,global_mid_temp)
if t<=global_mid_temp
s=R*(a1.*log(t)+a2.*t+a3.*(t.^2)./2+a4.*(t.^3)./3+a5.*(t.^4)./4+a7);
else
s=R*(b1.*log(t)+b2.*t+b3.*(t.^2)./2+b4.*(t.^3)./3+b5.*(t.^4)./4+b7);
endThe main program,
close all
clear all
clc

%inputs
R=8.314; % universal gas constant

%reading the dat file
f=fopen('THERMO.dat','r');

%reading header
fileheader=fgetl(f);

%getting the global maximum,minimum,mid temperature
temp_range=fgetl(f);
global_temp=strsplit(temp_range,' ');
global_min_temp=str2num(global_temp{2});
global_mid_temp=str2num(global_temp{3});
global_max_temp=str2num(global_temp{4});

%defining working temperature range
t=linspace(global_min_temp,global_max_temp,500);

%skipping the three comments
for i=1:3
    skip=fgetl(f);
end


%running loop for each species
for i=1:53

    line0=fgetl(f);

    %reading the name of the species
    name=strtok(line0);

    %reading the three lines which contains 7 high temp coeff & 7 low temp
    line1=fgetl(f);
    line2=fgetl(f);
    line3=fgetl(f);

    %finding the position of E so that we can locate the coefficients
    a=strfind(line1,'E');
    b=strfind(line2,'E');
    c=strfind(line3,'E');

    %extracting high temp coefficients
    a1=str2num(line1(1:a(1)+3));
    a2=str2num(line1(a(1)+3:a(2)+3));
    a3=str2num(line1(a(2)+4:a(3)+3));
    a4=str2num(line1(a(3)+4:a(4)+3));
    a5=str2num(line1(a(4)+4:a(5)+3));
    a6=str2num(line2(1:b(1)+3));
    a7=str2num(line2(b(1)+4:b(2)+3));

    %extracting low temp coefficients
    b1=str2num(line2(b(2)+4:b(3)+3));
    b2=str2num(line2(b(3)+4:b(4)+3));
    b3=str2num(line2(b(4)+4:b(5)+3));
    b4=str2num(line3(1:c(1)+3));
    b5=str2num(line3(c(1)+4:c(2)+3));
    b6=str2num(line3(c(2)+4:c(3)+3));
    b7=str2num(line3(c(3)+4:c(4)+3));

    %calculating specific heat
    cp=specific_heat(a1,a2,a3,a4,a5,b1,b2,b3,b4,b5,t,R,global_mid_temp);

    %calculating enthalpy
    h=enthalpy(a1,a2,a3,a4,a5,a6,b1,b2,b3,b4,b5,b6,t,R,global_mid_temp);

    %calculating entropy
    s=entropy(a1,a2,a3,a4,a5,a7,b1,b2,b3,b4,b5,b7,t,R,global_mid_temp);

    %plotting
    cd(pwd)
    dir_name=name;
    mkdir(dir_name);
    figure(1)
    plot(t,cp,'linewidth',3,'color','r')
    title(sprintf('Specific Heat vs Temperature for %s:',name))
    xlabel('Temperature')
    ylabel('Specific Heat')
    grid on;

    figure(2)
    plot(t,h,'linewidth',3,'color','g')
    title(sprintf('Enthalpy vs Temperature for %s:',name))
    xlabel('Temperature')
    ylabel('Enthalpy')
    grid on;

    figure(3)
    plot(t,s,'linewidth',3,'color','b')
    title(sprintf('Entropy vs Temperature for %s:',name))
    xlabel('Temperature')
    ylabel('Entropy')
    grid on;
    cd(dir_name)

    saveas(1,'cp_vs_t.jpg')
    saveas(2,'h_vs_t.jpg')
    saveas(3,'s_vs_t.jpg')

    cd ..

    %calculating molecular weight of each species
    Molecular_Weight(i) = molecular_weight(name);
end
Explanation:
As usual, the program is started using clear all, alose all, and clc commands. Universal Gas constant (R) is given as input. NASA THERMO file is opened using fopen command in read mode f=fopen('THERMO.dat', 'r'); Now, fgetl command is used to read the lines ie, header.
For getting the global min, mid, and max temperatures strsplit and str2num commands are used. strsplit(temp_range,' ') is used to split each term from inputs with respect to space in between the terms. str2num(global_temp{2}) is used to assign the second column values to the global min temperature. As the same, global mid and max temperatures are assigned the third and fourth columns. Then linspace command is used for defining the working temperature ranges.
New for loop is started to read the data till the end of the file. strtok command is used in reading the name of the species. Again, fgetl is used to read the first three lines and strfind command is used to extract the coefficients from the first three lines.a=strfind(line1,'E') note that strfind is case sensitive and throw errors when miss spelling the finding string. The coefficients are extracted and given a variable from a1 to a7 and b1 to b7. Here, a1 to a7 are low-temperature coefficients, and b1 to b7 are high-temperature coefficients. Now as we have read all our input data and sorted out everything, the next step is to calculate the Cp, H, and S.
To calculate the specific heat, a new function program is opened called specific_heat and all the required inputs are read. As the formula to calculate the Cp, H, and S changes for different temperature ranges, we compare the input temp with the global mid temperature. If the temp is less than the global temp we use the global min coefficients otherwise we use global max coefficients. The formula for calculating the Cp, H, and S is given in the theory section. Now that the values are calculated we need to plot the values for the elements.
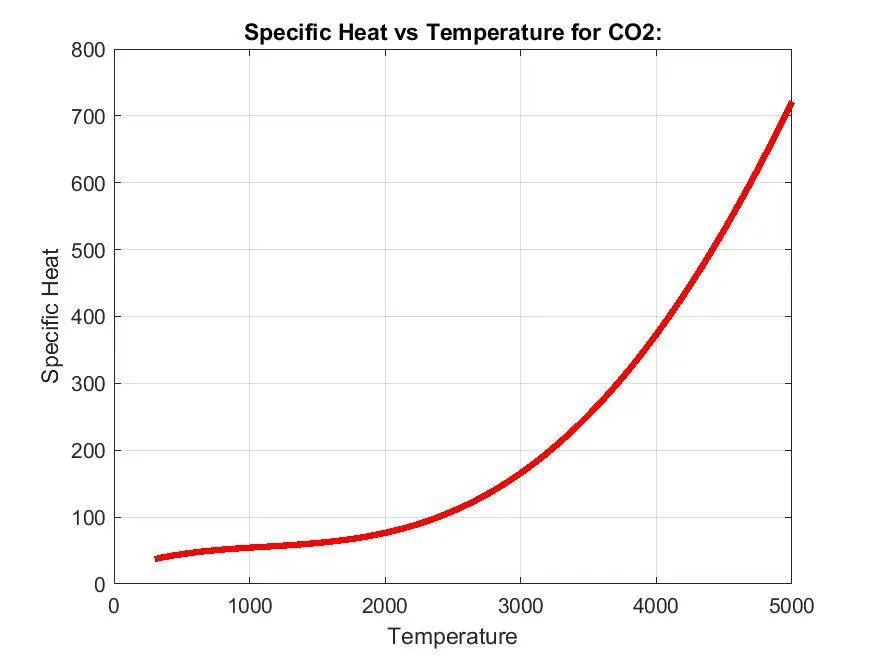
For each species, we can create a separate file to store its own data. This can be done using the mkdir command. The folder name contains the specific species name. In figure(1) plot command is used to make a graph with respect to the specific heat and the temperature. xlabel, ylabel, and title of the graphs are given.
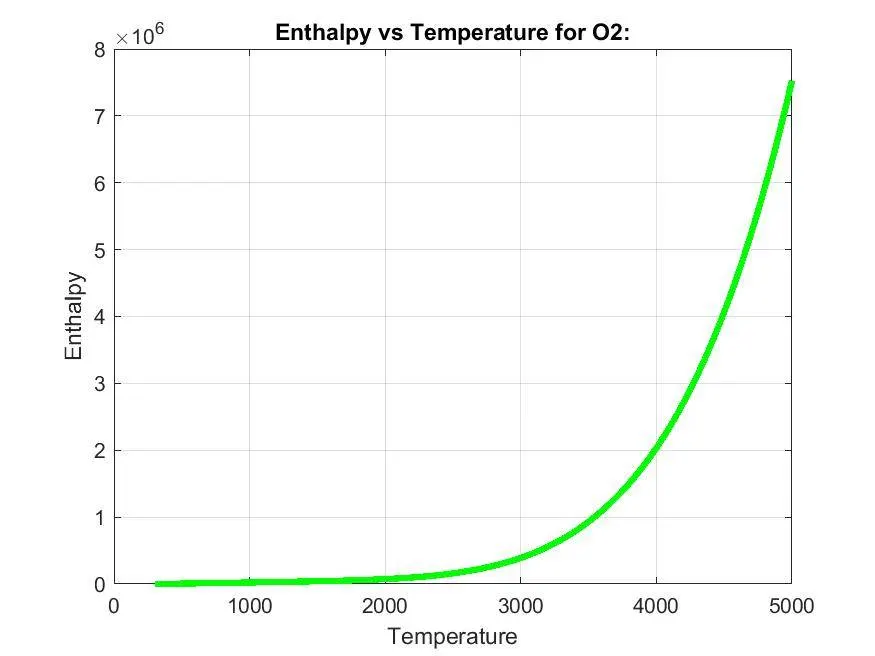
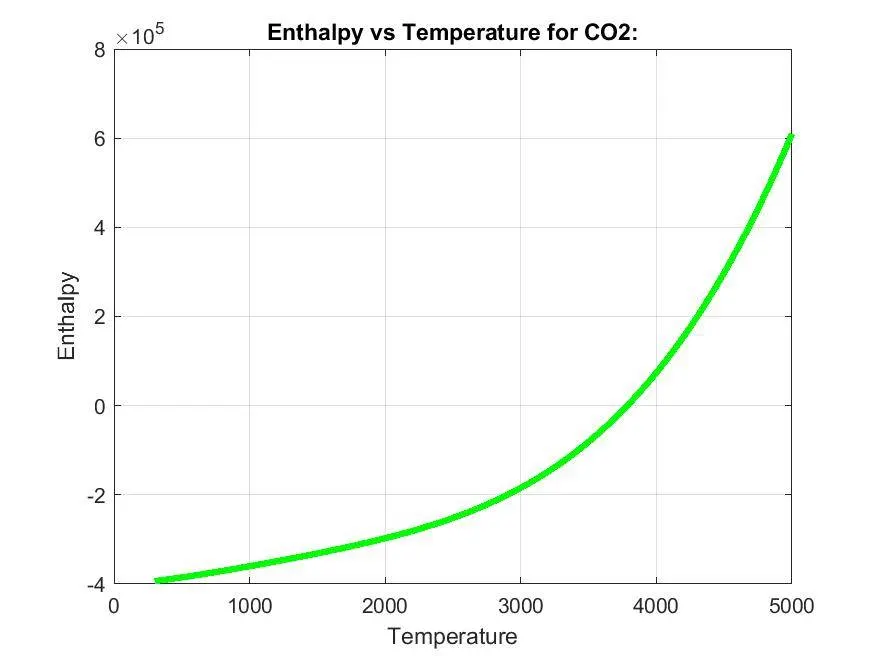
In figure(2) plot command is used to make a graph with respect to the enthalpy and the temperature. xlabel, ylabel, and title of the graphs are given.
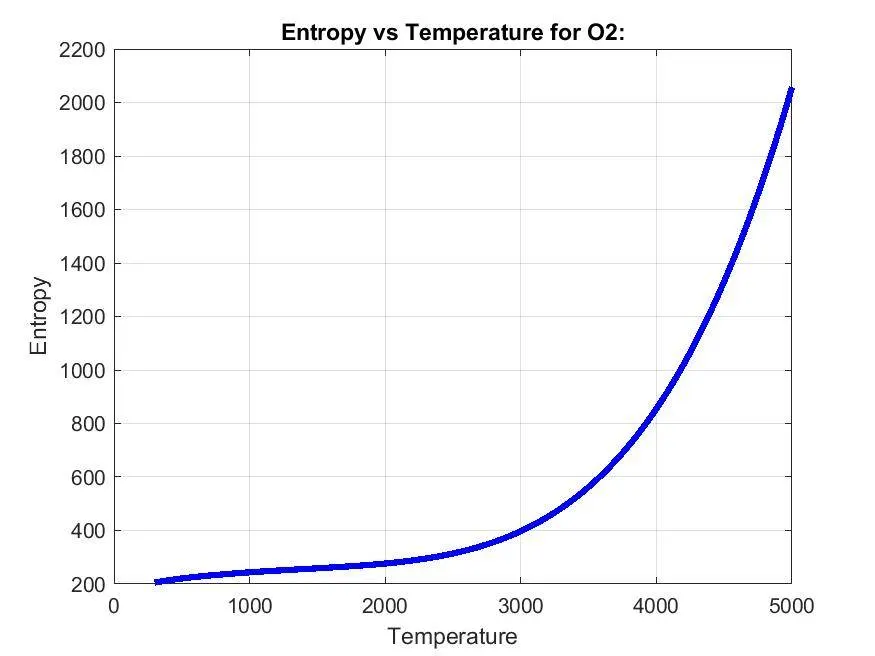
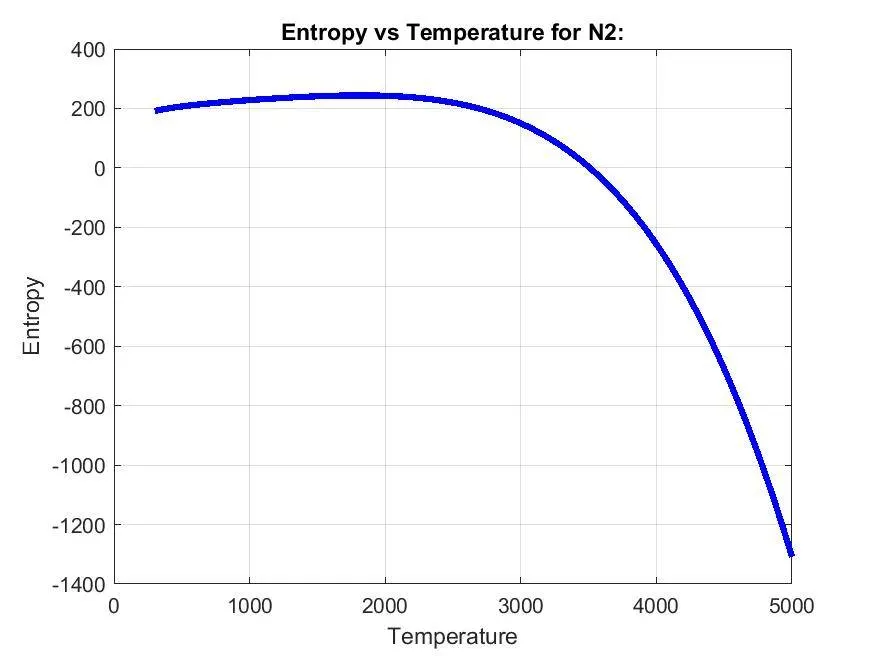
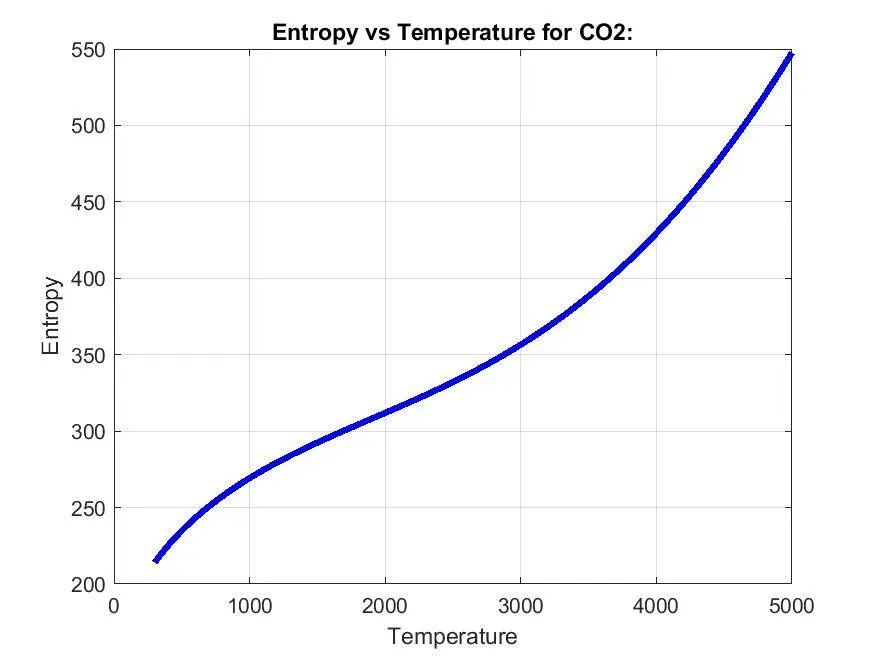
In figure(3) plot command is used to make a graph with respect to the entropy and the temperature. xlabel, ylabel, and title of the graphs are given.
Saveas command is used to save each graph in its respective folder.
The molecular weight of each species is calculated in another function called molecular_weight. As we can see that all the atoms in the molecule are one of H,C,N,O,A,S we make an array of their names as atoms and their corresponding atomic weights as an aw array. We initialize MW=0; Now we need to run a for loop to check each element of the molecule, if the element matches then it's the corresponding atomicweight is added to the MW.
but for elements like O2, N2 where we need to consider the mass of the element twice we use an if command. we convert the character into a double and check if it is >1. If the condition is true we add the atomicweight of that specific element. fprintf is used to print the molecular weight of each element in the command window.
Outputs:
The calculated molecular weight of each element,
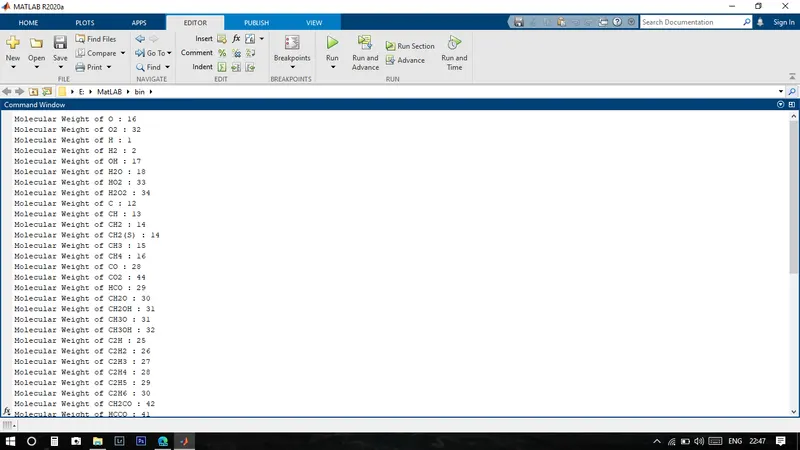
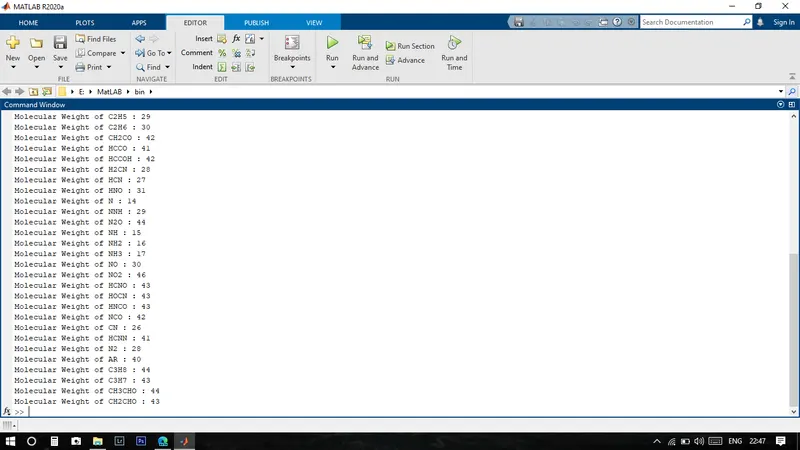
Screenshot of the folders created for each element,
Specific heat, Enthalpy, and Entropy graphs for O2, N2, and CO2
O2:
N2:
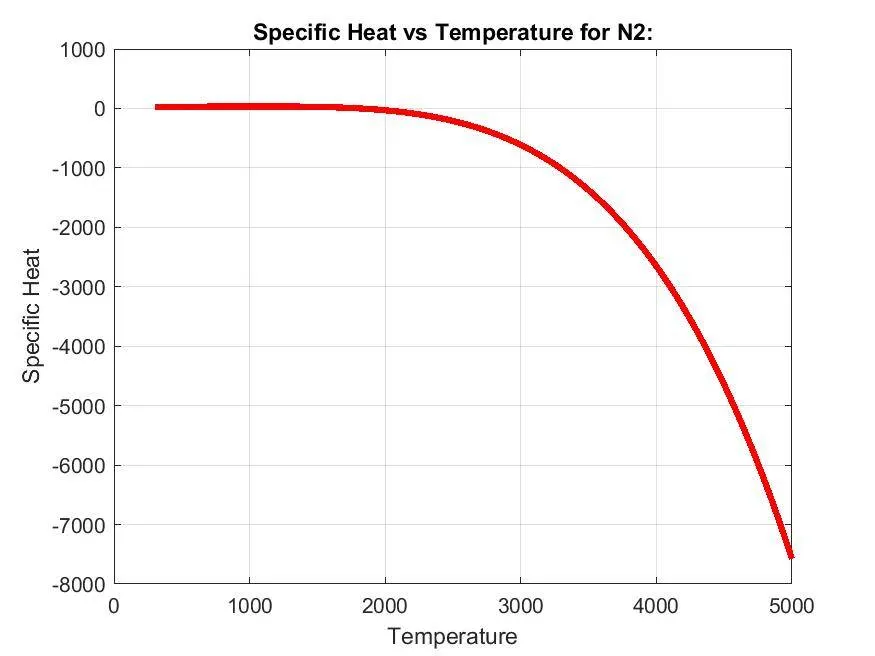
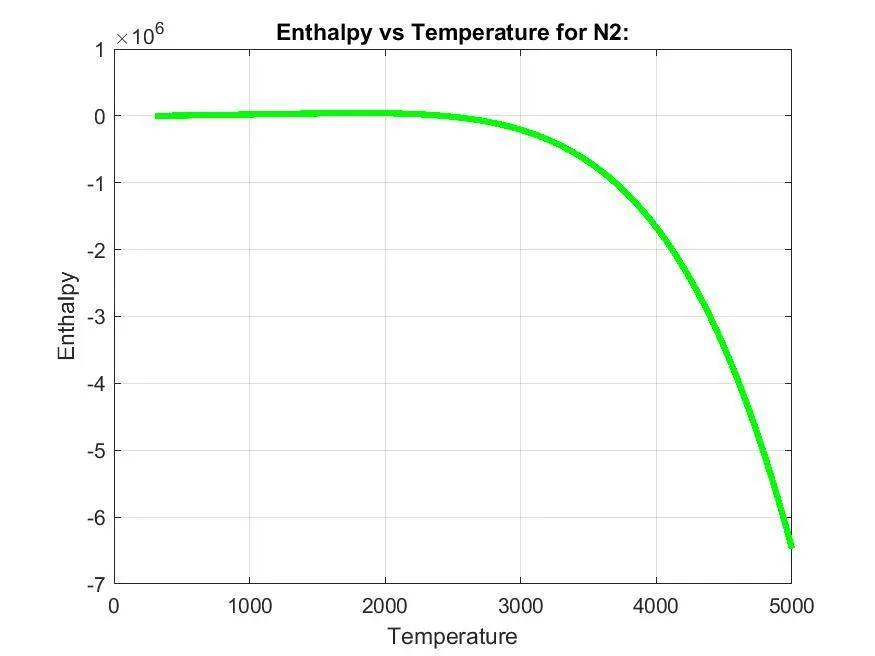
CO2:
Errors faced during the program:
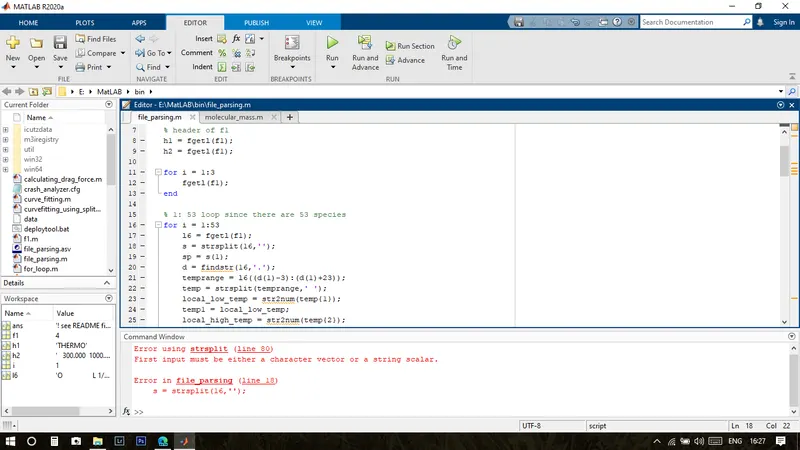
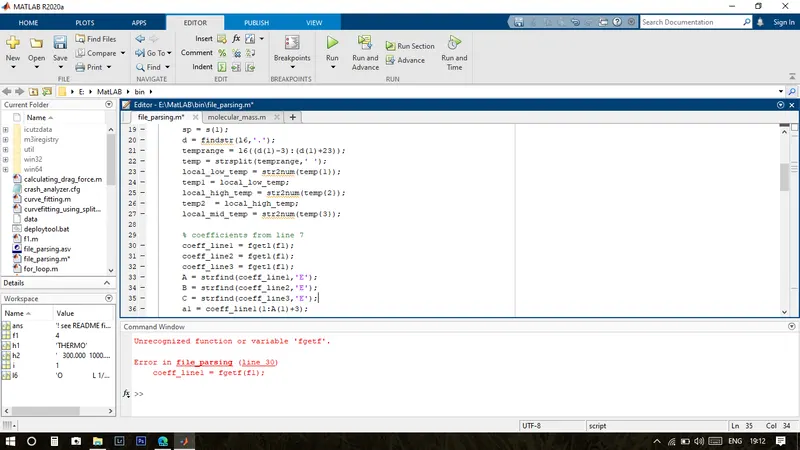
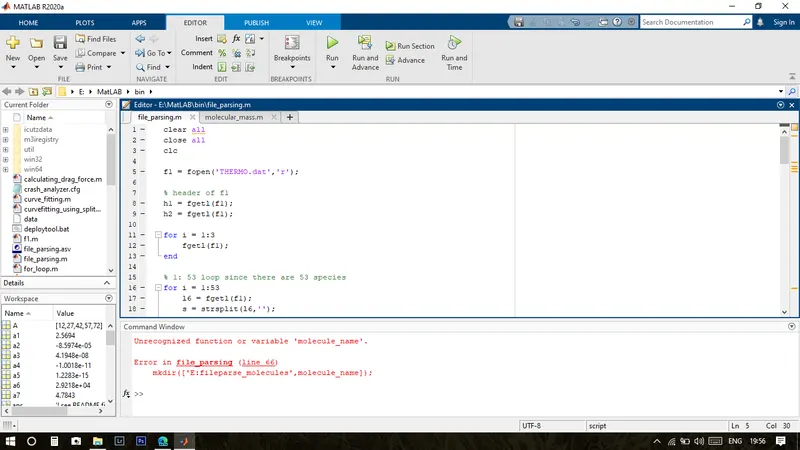
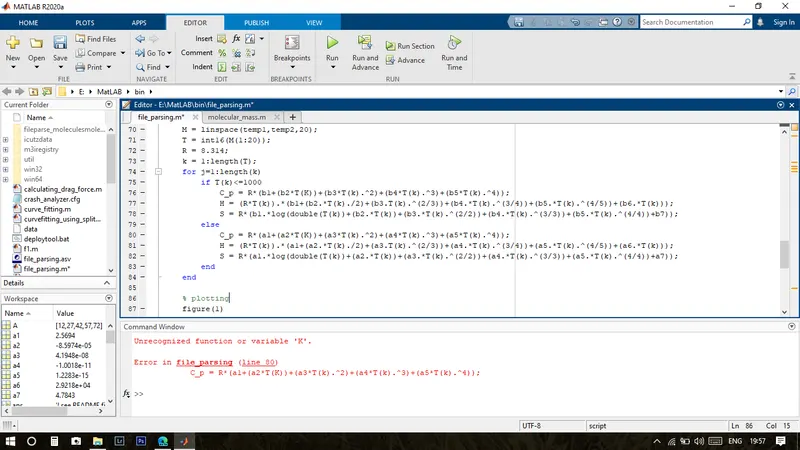
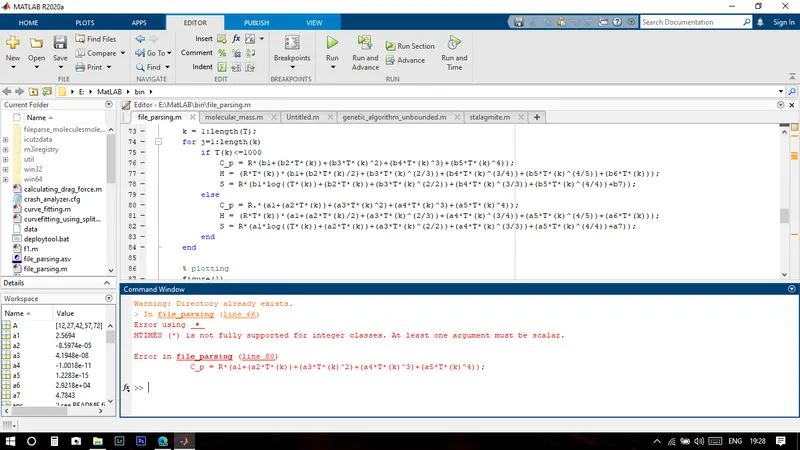
The above screenshots describe some of the errors faced during the programming. To overcome those errors some slight changes in the program is done. And As a major change, each calculations are separated into individual functions, for easy checking and writing the codes.
Conclusion:
Thus a matlab code is written to read the given data and the thermodynamical properties of each gas element are calculated.
References:
https://www.tutorialspoint.com/matlab/matlab_data_import.htm