Parsing NASA Thermodynamic Data
File Parsing of NASA Thermodynamic data
Aim: Creating a program in MATLAB to parse the Thermodynamic Data file of NASA.
Objective:
- Determining the value of Specific Heat(Cp), Enthalpy(H), Entropy(S).
- To plot, Cp, H and S for the local temperature range specific for each species.
- To calculate the molecular weight of each species.
Methodology:
Theory
1. Specific Heat (Cp): In thermodynamic, the specific heat of a substance is the heat capacity of a sample of the substance divided by the mass of the sample. Informally, it is the amount of energy that must be added, in the form of heat, to one unit of mass of the substance in order to cause an increase of one unit in temperature.
2. Enthalpy(H): Enthalpy is a property of a thermodynamic system, defined as the sum of the system's internal energy and the product of its pressure and volume.
3. Entropy(S): Entropy is the loss of energy available to do work. Second law of thermodynamics states that the total entropy of a system either increases or remains constant; it never decreases. Entropy is zero in a reversible process; it increases in an irreversible process.
The relation of Specific Heat, Enthalpy and Entropy with temperature co-efficients are as follow;

4. Molecular Weight: Molecular Weight is the total weight of all the atom of the molecule
Eg; For CO2, the weight of carbon is 12 and oxygen is 16. So the molecular weight is;
Molecular Weight of CO2 = 12 + 16*2 = 44
Program
The program to parse the data from file, as well as determine Cp, H, S and molecular weight of every species is:
%Program to Parse the Thermodynamic Data of NASA
clear all
close all
clc

%Assigning Global Temperature
f1 = fopen('THERMO.dat','r');
fgetl(f1);
x = fgetl(f1);
global_temp = str2num(x);
global_lowtemp = global_temp(1);
global_midtemp = global_temp(2);
global_hightemp = global_temp(3);
R = 8.3145;

%Species counter
frewind(f1)
ct = 0;
q = ' ';
while true
   if strcmp(q,'END')
       break
   else
       q = fgetl(f1);
       ct = ct+1;
   end
end
species_count = (ct-6)/4;

%Extracting Data
frewind(f1)
for i = 1:5
    fgetl(f1);
end
fprintf('RESULT OF MOLECULAR WEIGHTn')    %Header for the result in command window
for i = 1:species_count
z = fgetl(f1);
A = strsplit(z,' ');
a = length(A);
species_name = A{1};
local_midtemp= A{a-1};
local_hightemp= A{a-2};
local_lowtemp= A{a-3};
local_midtemp= str2num(A{a-1});
local_hightemp= str2num(A{a-2});
local_lowtemp= str2num(A{a-3});
t = linspace(local_lowtemp,local_hightemp,100);
l = fgetl(f1);
m = fgetl(f1);
n = fgetl(f1);
X = findstr(l,'E');
Y = findstr(m,'E');
Z = findstr(n,'E');

%Assigning the temperature coefficient.
a1 = l(1:X(1)+3);
a2 = l(X(1)+4:X(2)+3);
a3 = l(X(2)+4:X(3)+3);
a4 = l(X(3)+4:X(4)+3);
a5 = l(X(4)+4:X(5)+3);
a6 = m(1:Y(1)+3);
a7 = m(Y(1)+4:Y(2)+3);
a8 = m(Y(2)+4:Y(3)+3);
a9 = m(Y(3)+4:Y(4)+3);
a10 = m(Y(4)+4:Y(5)+3);
a11 = n(1:Z(1)+3);
a12 = n(Z(1)+4:Z(2)+3);
a13 = n(Z(2)+4:Z(3)+3);
a14 = n(Z(3)+4:Z(4)+3);

%Determining values of temperature of co-efficient
a1 = str2num(a1);
a2 = str2num(a2);
a3 = str2num(a3);
a4 = str2num(a4);
a5 = str2num(a5);
a6 = str2num(a6);
a7 = str2num(a7);
a8 = str2num(a8);
a9 = str2num(a9);
a10 = str2num(a10);
a11 = str2num(a11);
a12 = str2num(a12);
a13 = str2num(a13);
a14 = str2num(a14);

%Deteremining cp,h and s at the particular temperature co-efficient
for  i = 1:length(t)
    if t(i) > local_midtemp
        cp(i) = (a1+ a2*t(i) + a3*(t(i)^2) + a4*(t(i)^3) +a5*(t(i)^4))*R;
        h(i) = (a1 + a2*t(i)/2 + a3*(t(i)^2)/3 +a4*(t(i)^3)/4 + a5*(t(i)^4)/5 + a6/t(i))*(R*t(i));
        s(i) = (a1*log(t(i))+ a2*t(i) + a3*(t(i)^2)/2 + a4*(t(i)^3)/3 + ((a5*t(i)^4)/4) +a7)*R;
    else
        cp(i) = (a8+ a9*t(i) + a10*((t(i))^2) + a11*((t(i))^3) +a12*((t(i))^4))*R;
        h(i) = (a8 + ((a9*t(i))/2) + ((a10*t(i)^2)/3) +((a11*t(i)^3)/4) + ((a12*t(i)^4)/5) + ((a13/t(i))))*(R*t(i));
        s(i) = (a8*log(t(i))+ a9*t(i) + a10*((t(i))^2/2) + a11*((t(i))^3/3) + ((a12*(t(i))^4)/4) +a14)*R;
    end
end

%Plotting Temperature v/s Specific Heat
figure(1)
plot(t,cp,'Linewidth',2,'color','r');
xlabel('Temperature(K)')
ylabel('Specific Heat(J/kgK)')
title(species_name)

%Plotting Temperature v/s Enthalpy
figure(2)
plot(t,h,'Linewidth',2,'color','b');
xlabel('Temperature(K)')
ylabel('Enthalpy(kJ/mol)')
title(species_name)

%Plotting Temperature v/s Entropy
figure(3)
plot(t,s,'Linewidth',2,'color','g');
xlabel('Temperature(K)')
ylabel('Entropy(J/K)')
title(species_name)

%Saving plots of all species
mkdir(['D:Sandeep ProgramNASA',species_name])
cd (['D:Sandeep ProgramNASA',species_name])
saveas(1,'T vs Cp.jpg')
saveas(2,'T vs H.jpg')
saveas(3,'T vs S.jpg')

%Molecular Weight
species = species_name;
atom = ['C' 'H' 'N' 'O' 'AR'];
at_we = [12 1 14 16 40];
mm = 0;
for i = 1:length(species)
    for j = 1:length(at_we)
        if strcmp(species(i),atom(j))
            mm = mm+at_we(j);
            x = j;
        end
    end
    n =str2double(species(i));
    if n>1
        mm = mm +(at_we(x)*(n-1));
    end
end
fprintf('The molecular weight of %s is = %fn',species_name,mm)
end
At first, we begin with clearing our window space and command window.
We, are given with the file named 'Thermo.dat'. The file should be in the same folder as the MATLAB program for parsing data.
Then to extract the data, we will read the file. To open the file and read it, we use the synatx;
fileID = fopen(filename,permission)
The file ID in our program is f1. The name of the file is THERMO.dat, with the permission to only read the file.
The command that takes us to the next line is fgetl; its syntax is:
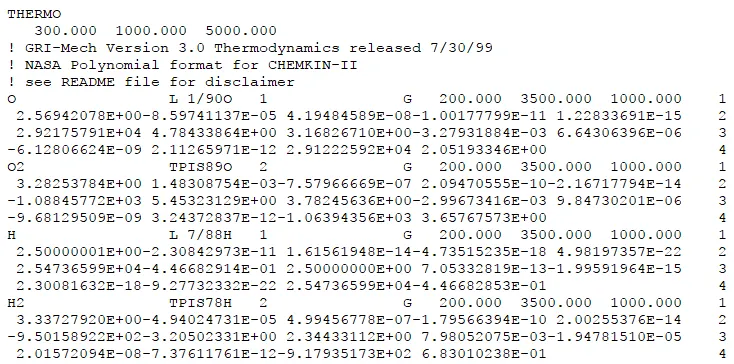
Fig: Part of the NASA Thermodynamic Data
tline = fgetl(fileID)
fgetl takes the file name f1, and takes the program to the next line to read its data. We can store this data in a variable. Using fgetl, takes program to line '300.000 1000.000 5000.000'
The command to convert string to number is str2num, its syntax is;
X = str2num(chr)
The character stored in f1 in the form of string is converted to number, using this command and in our program it is stored in variable x. The number is stored in the form of array. Our result for second line is stored in global_temp variable
So, the values stored in X are 300.00, 1000.00 and 5000.00. The first value is Global low temperature which is stored in variable global_lowtemp. The second value is Global mid temperature which is stored in variable global_midtemp. The third value is Global high temperature which is stored in variable global_hightemp.
The value of Universal Gas Constant is stored in R as 8.3145.
By using frewind(f1) we go to the first line of the text.
Using fgetl under for loop, which will iterate for five times, we will skip first five line. The result of the 6th line is stored in variable z. We need to split the string stored values. To do that, we will use; strsplit(str) command. In our case the values are in the form of single string. We split the values where '_' was available, that is the blank space. The values extracted are stored in the variable A. We can make out the second last number is the one where we have local mid temperature, we will store it in local_midtemp, the third last is local high temperature which is stored in local_hightemp. The fourth last is the one where we have local low temperature, we will store its value in loal_lowtemp.
But these are character, hence we will convert this into number using str2num command.
To store the temperature co-efficient we first stored next three lines in l,m,n. Then by using findstr(char) and character as 'E' we actually store five E in X and Y and four in Z. Then by using the position of it and adding some points before and after it we can find the temperature coeffeicient. We will store these in variables a1, a2, a3, a4, a5, a6, a7, a8, a9, a10, a11, a12, a13, a14. But again these values are in the form of the string, so by using str2num we can convert this into a number. The first 7 values are high temperature co-efficient and the next 7 values are low temperature co-efficient.
We will use around 200 values of temperture between low temperature and high temperature and find the respective Cp, H and S using the above equations. The 200 values are split using linspace.
Under for loop for this 200 values we find Cp, H and S. If else condition is used because whenever temperature surpasses the mid temperature point, the the high temperature coefficient will be used to calculate the CP, H and S. in regular case, the first 7 values of temperature, that is the low temperature coefficient are used.
We will use create 3 plots. The first is temperature against Specific Heat, second is temperature against Enthalpy and then temperature against Entropy.
For better illustration, we have given the title of species, xlablel and ylabel. Using Linewidth the colour for width is set. And using color we set the color to r,b and g.
But, we need to use this same code for as many the species are there in the text. To achieve that, we will create a line counter. The first five and last line is minus and the result is divided by 4, as every species takes up 4 lines. To do this we have used the while loop.
In while loop, if else conditonal operator is used. The last word in END. Whenever this word matches the program comes out of the loop. Whenever the statement is true the program comes out of the loop and proceed with the code ahead. Under else the counter is used to count the line. Initially the counet is set to 0.
In if the string comparision is done between the line and word END. The syntax for string comparision is;
tf = strcmp(s1,s2)
In our case s1 is the line and matching word is END. q is the s1. In q the line comes up every time. Initially we save nothing in it. Then using fgetl of f1 we use next line under every iteration until the condition is true. When the condition becomes true, we get total line count in varaible called ct. The species count is saved in species_count variable. It is total line minus 6, divide by 4. The first 6 lines are deducted and 4 is line consumed by every species. We use for loop now to run this code for the number of species count time. Here it is 53 counts. If we take a boader look, the for loop brings us to the first line of the every species. So while we made the split to assign local temperature, the first word was the species name. Here we saved the first position of A in variable called species_name. In this way, after every iteration, we get the species name needed to calculate Molecular weight.
Now,to calculate the molecular weight, we will again use the for loop; the logic of which is as follow;
%Molecular Weight
species = species_name;
atom = ['C' 'H' 'N' 'O' 'AR'];
at_we = [12 1 14 16 40];
mm = 0;
for i = 1:length(species)
    for j = 1:length(at_we)
        if strcmp(species(i),atom(j))
            mm = mm+at_we(j);
            x = j;
        end
    end
    n =str2double(species(i));
    if n>1
        mm = mm +(at_we(x)*(n-1));
    end
end
At first we store species name in variable species. A closer look to file gives us the total number of elements used. Species are made of element of Carbon(C), Nitrogen(N), Hydrogen(H), Oxygen(O) and Argon(AR). The atomic weight are 12, 14, 1, 16, 40; respectively. We will store this values in an array form in variable ataom and at_we; respectively. The moecular weight is initially set at 0. Under for loop, the first for loop will run for length of species that is 1 cyle. Under first for loop, will be nested for loop, where the length of at_we is used. It will run until all words are checked. To comapre, under if we compare the alphabet character of atom is compared with every alphabet character of species name. The word that matches will add up the molecular wieght counter with their respective atomic weight. In case, there are more than one molecules of atom, we use the position of that character that is j and store it in x variable. We store that avlue in another variable in n, but we need the numbet in numerical form to do the correct calculation. Hence we use command str2double, the syntax of str2double is;
X = str2double(str)
In this manner the values is stored in n. We used logic in a way where we calculated the atomic number of the previous number and multiplied that by (n-1), that is added to already existing mm. For the rest of character the loop runs to calculate the atomic weight.
Eg: Lets say we have a species CO2H'
Here the counter will compare and add the first two atomic weight, i.e 28, but on spotting 2, it will send the number to variable n and position to x. So the total atomic weight will be weight calculated to this point 28, the the value of that particular atom in previous position 16 multiply by (2-1). To this point the atomic weight is 44. Now after this the value get to the loop and H value i.e 1 is added to get Molecular Weight. The result in this case is 45.
The value is printed using fprintf, after the ouput is stored once the program comes out of the loop.
In this way, the result of molecular weight of all species is determined.
Result:
Below is the folder that has all the plots;

Fig: Saved Folders of Plots
1. The plot of Temperature against Cp, H and S for O2 is;
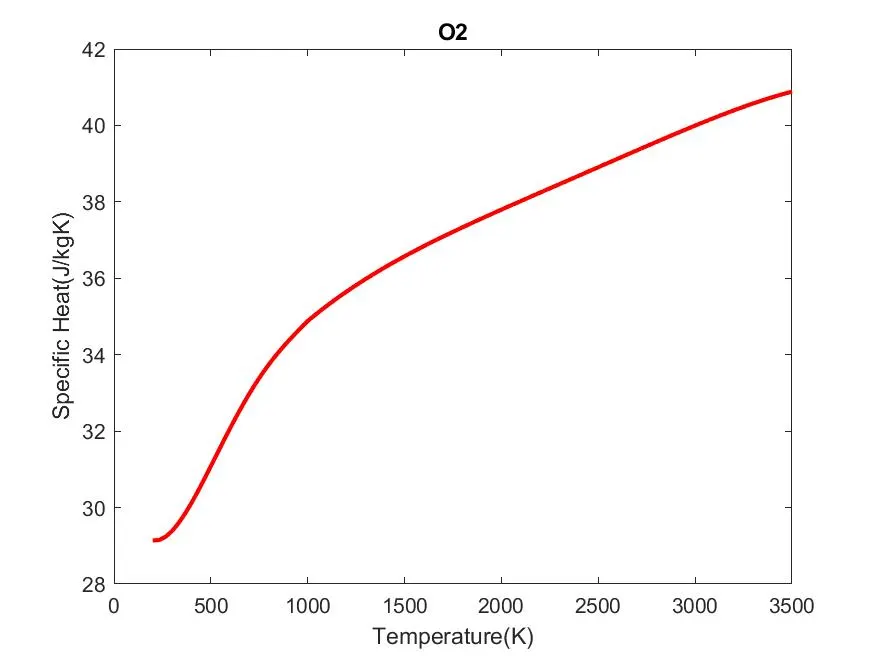
Fig: Temperature against Cp for O2
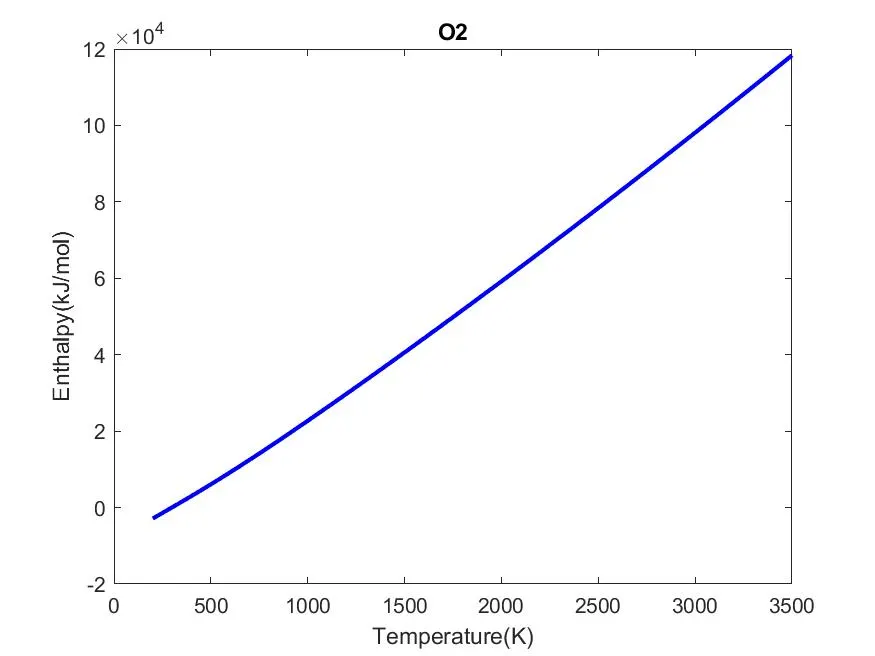
Fig: Temperature against H for O2
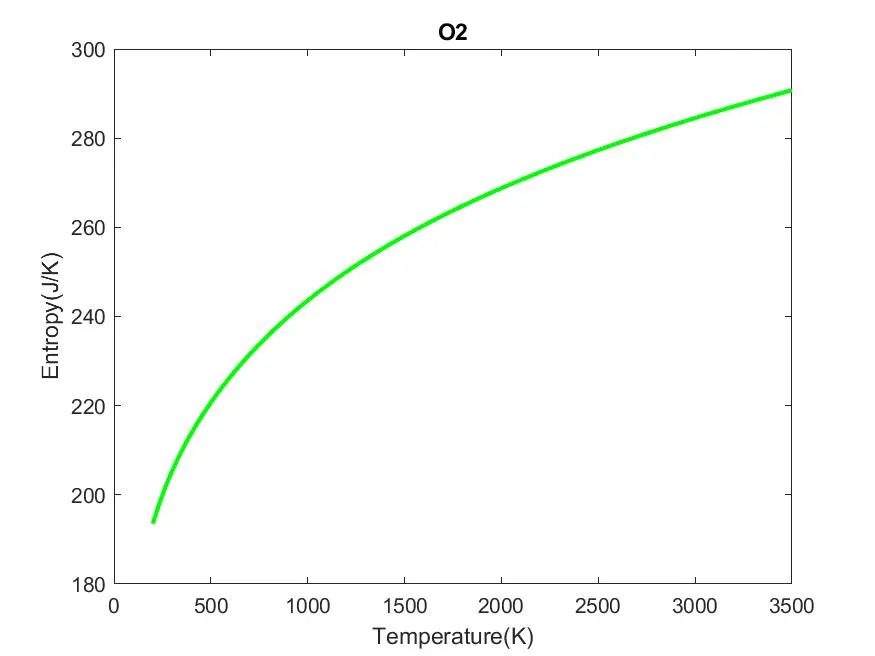
Fig: Temperature against S for O2
2. The plot of Temperature against Cp, H and S for N2 is;
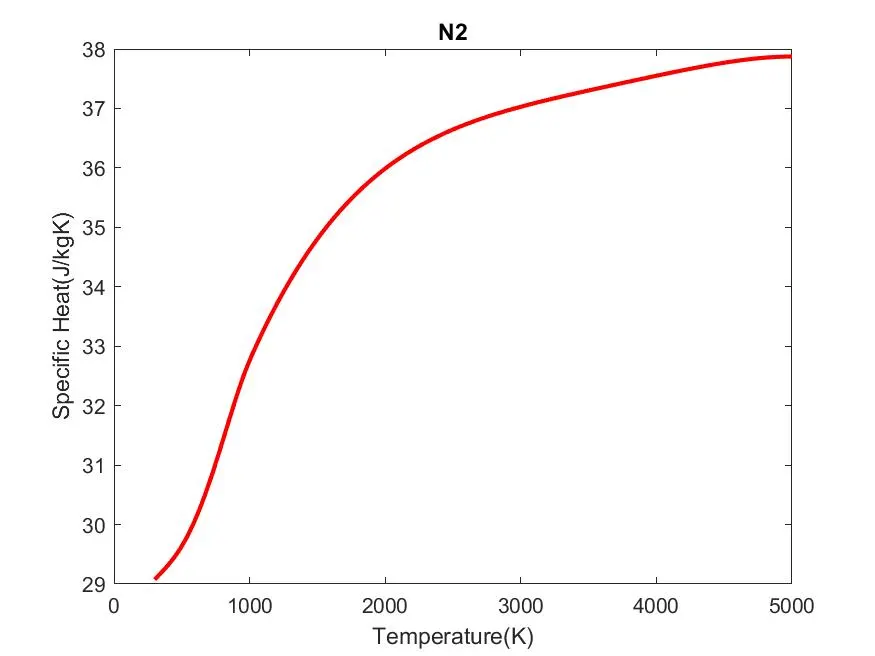
Fig: Temperature against Cp for N2
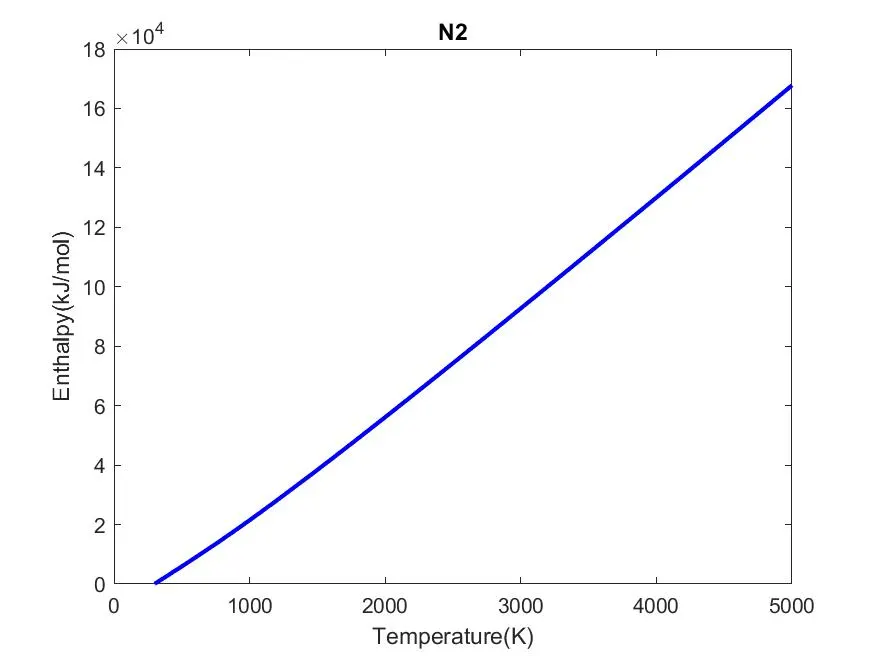
Fig: Temperature against H for N2
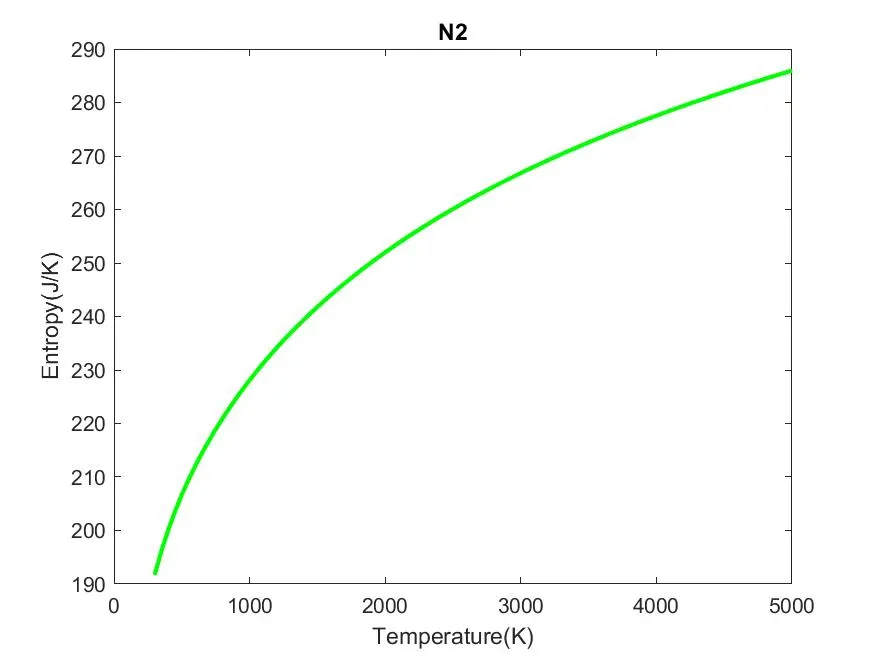
Fig: Temperature against S for N2
3. The plot of Temperature against Cp, H and S for CO2 is;
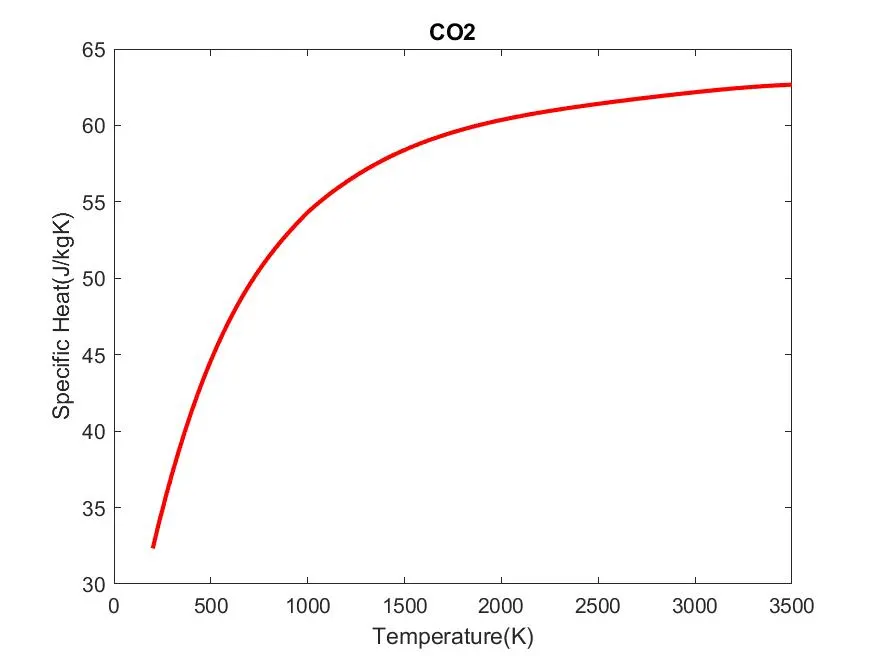
Fig: Temperature against Cp for CO2
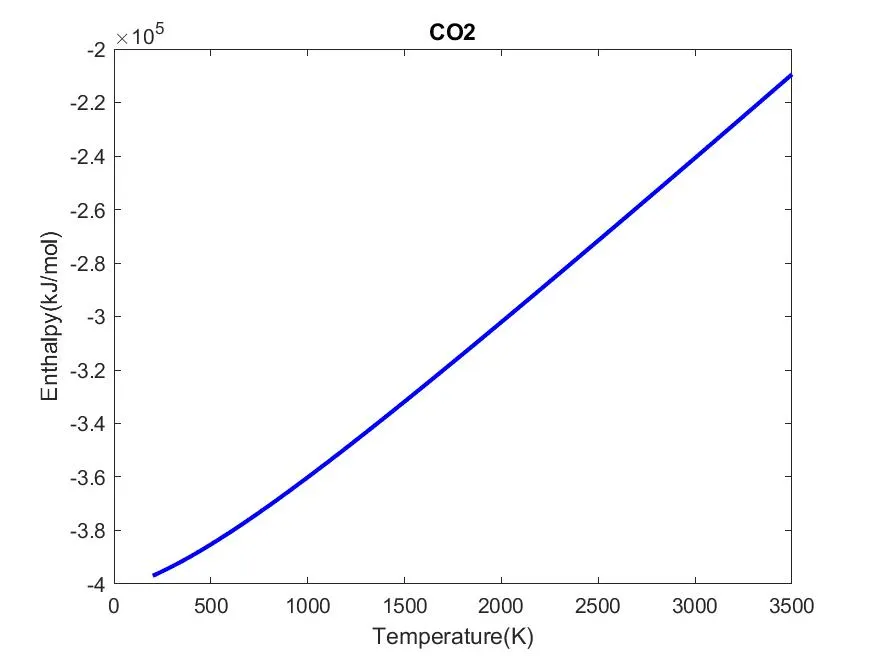
Fig: Temperature against H for CO2
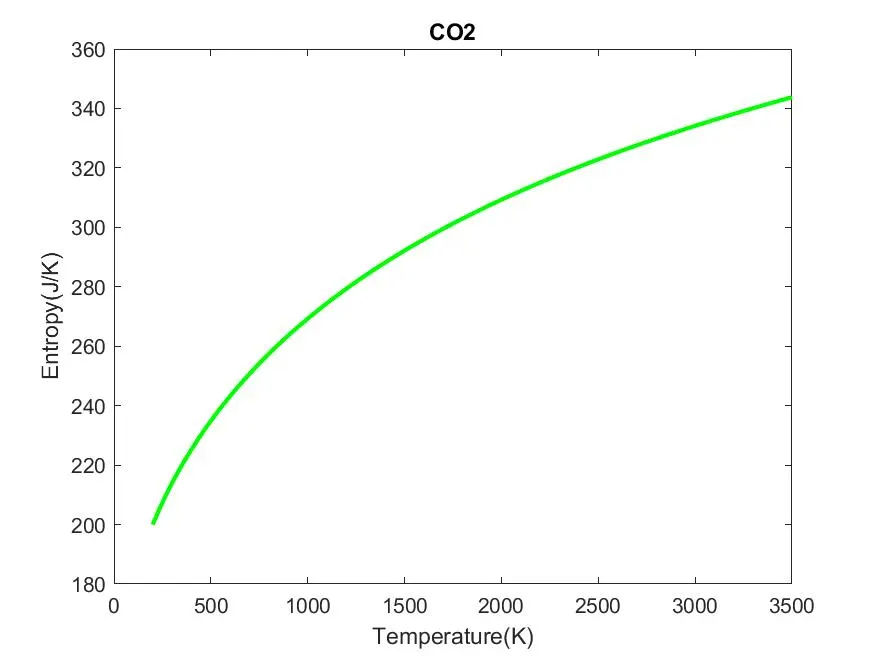
Fig: Temperature against S for CO2
The Molecular Weight of Species are;
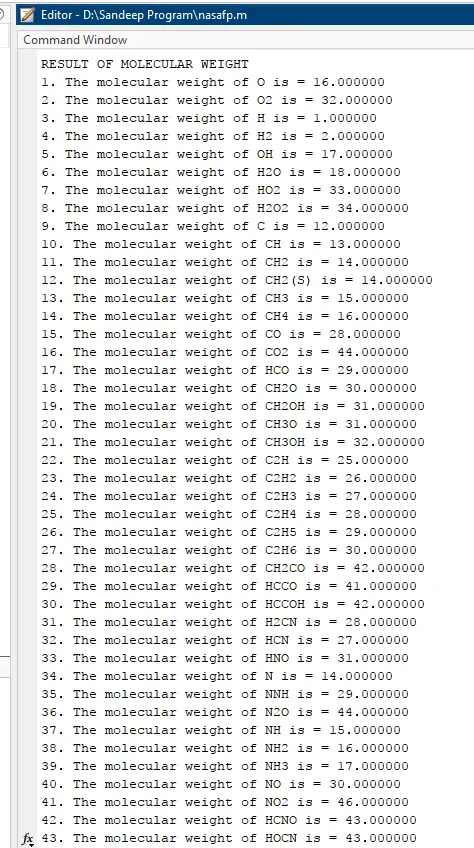
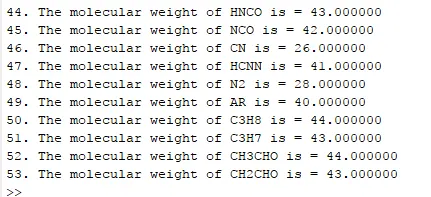
Fig: Molecular Weight of all species on Command Window
Learning Outcome:
- Understood the concept of File Parsing.
- Learned commands to read the file.
- Learned commands to convert string to number.
- Learned Plotting of multiple graphs.
- Implemented File Parsing on extracting the Thermodynamic data of NASA.
Conclusion:
Created a program to parse the Thermodynamic data file of NASA. Also created the plot of Temperature against Specific Heat, Enthalpy, Entropy for every species and determined their respective Molecular Weight.