Parsing NASA thermodynamic data
Parsing of NASA Thermodynamic data:
Parsing in MATLAB is to read a text data and convert them into workable inputs.
INPUTS:
Below is the polynomial equations given by NASA containing the variables Cp, H & S, 
Also provided the text file containing coefficients, FIRST seven are high temperature coefficients and LAST seven are low temperature coefficients.
Code Explaination:
1. fopen command is used to open the given data file.
2. fgetl command is used to read the data file line by line.
3. First line contains the global temperature values which are read usind fgetl command.
4. These read string values are converted to numbers using str2num command.
5. Next 3 lines are comments and are skipped using fgetl.
6. Coefficients of 53 species are given. Hence a for loop is created to run 53 times.
7. fgetl, str2double commands are used in nested for loops to read all the coefficients of all species.
8. if and else commands are used to calculate Cp, H & S using given polynomials for high & low temperature ranges and plots created.
9. mkdir and cd commands are used to create plots folders for each species and navigate to the folder for saving images.
OUTPUT:
1. Window where all plot folders are saved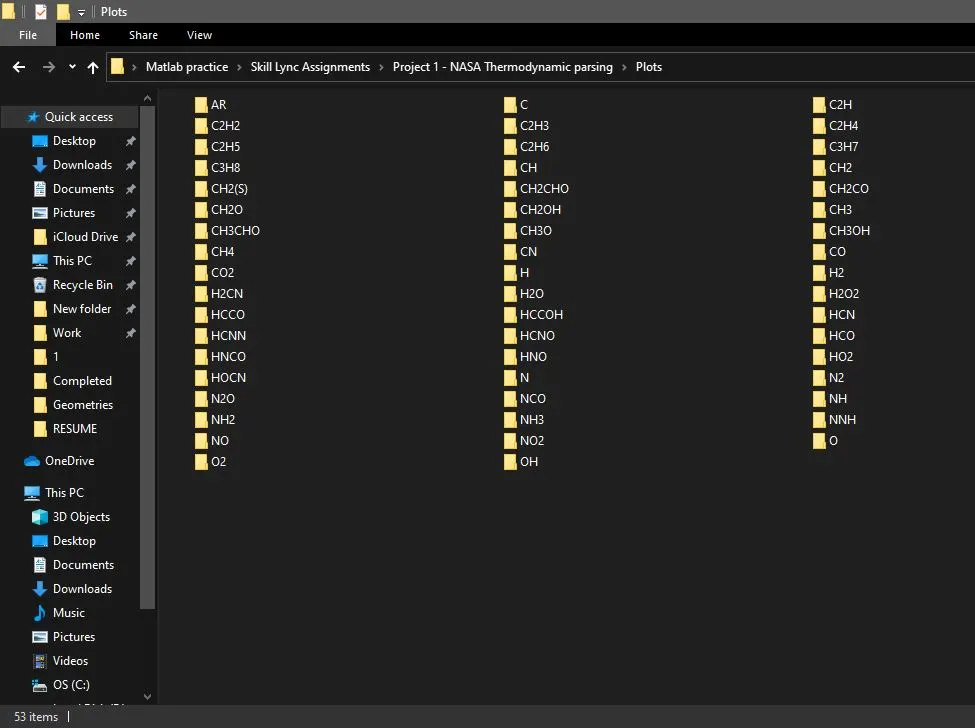
2. Display of Molecular weights of species in comand window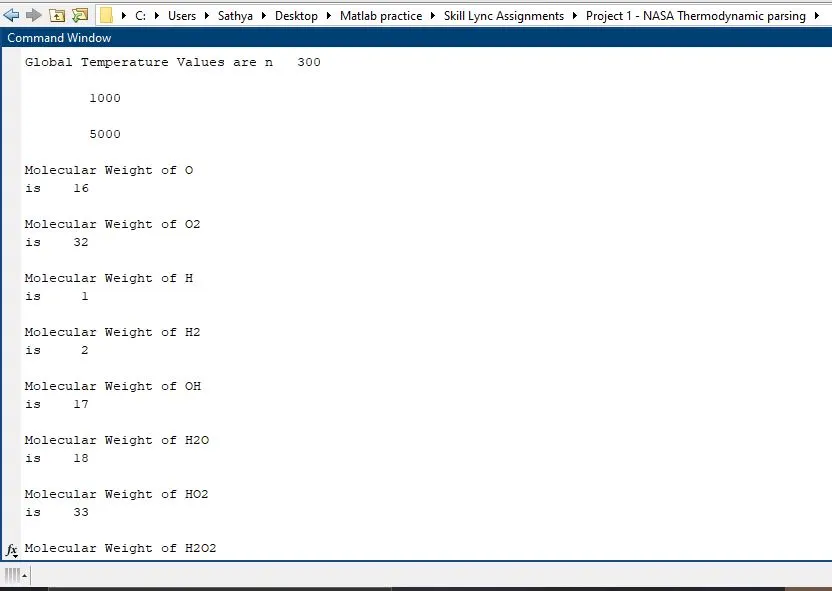
3. Plots for O2:
Enthalpy vs Temperature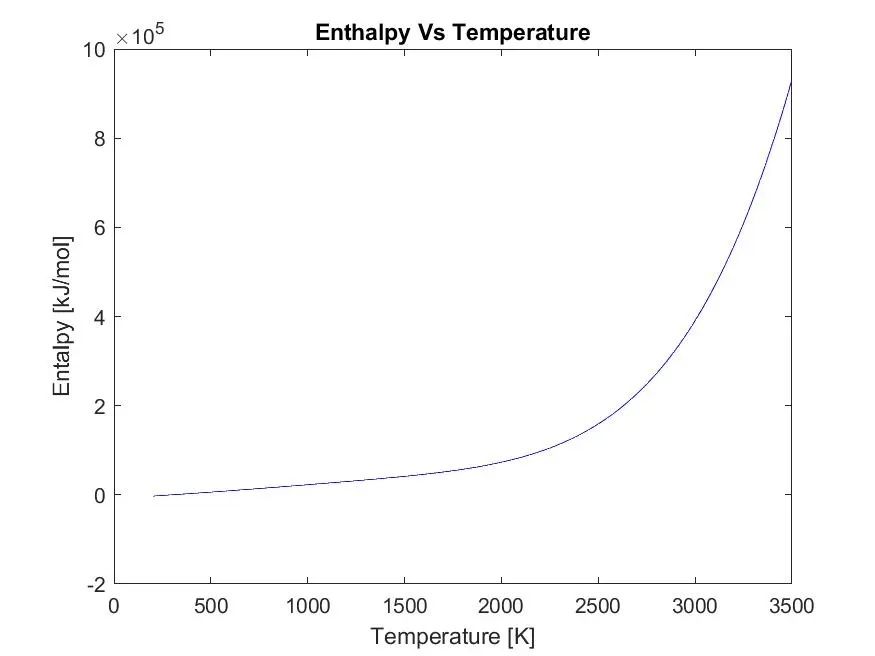
Entropy vs Temperature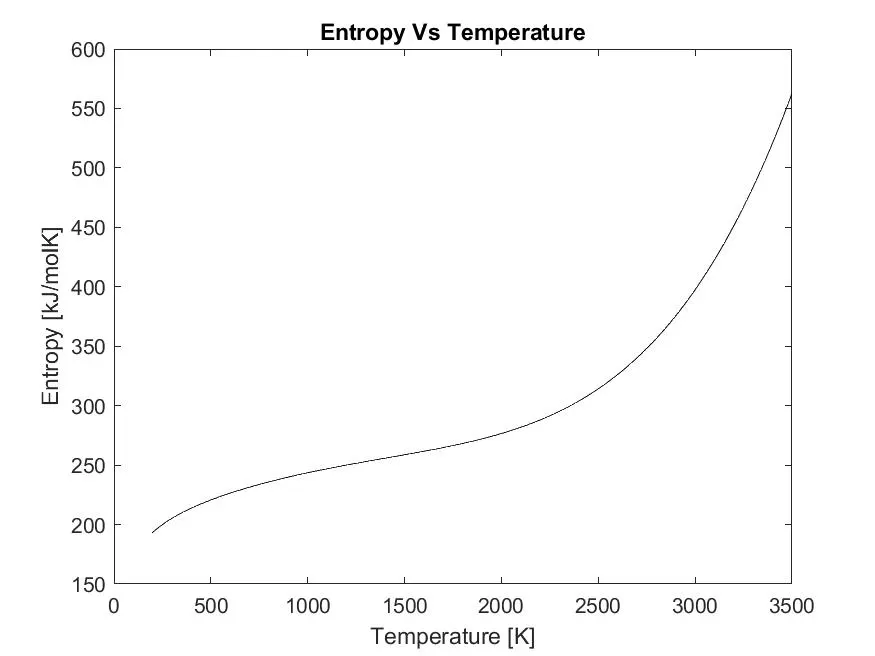
Specific Heat vs Temperature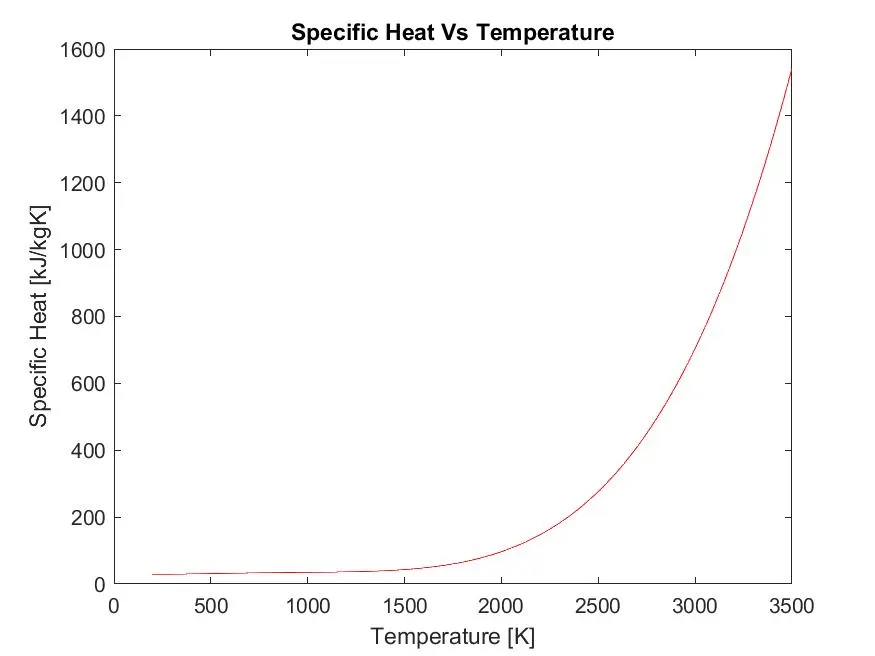
4. Plots for N2:
Enthalpy vs Temperature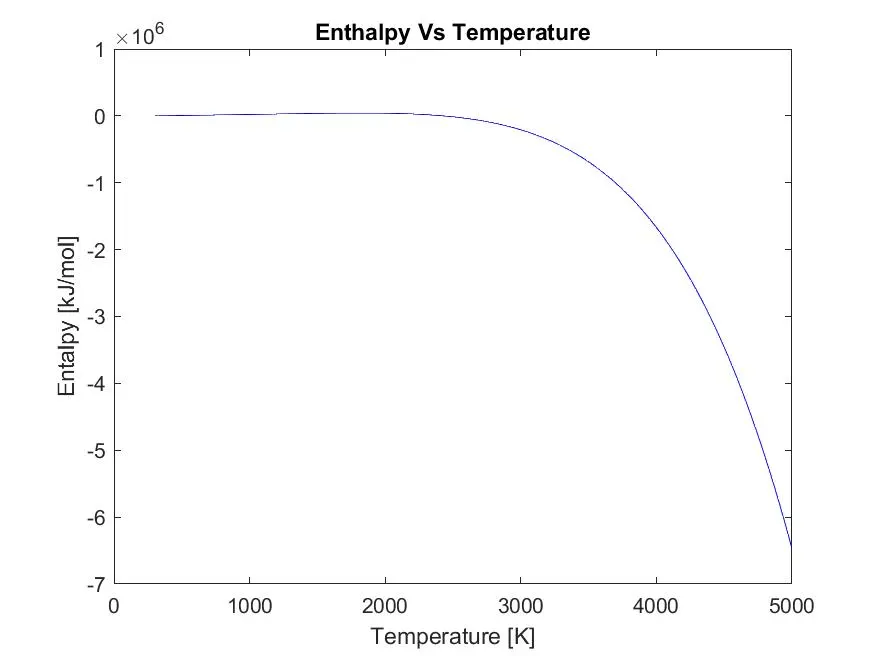
Entropy vs Temperature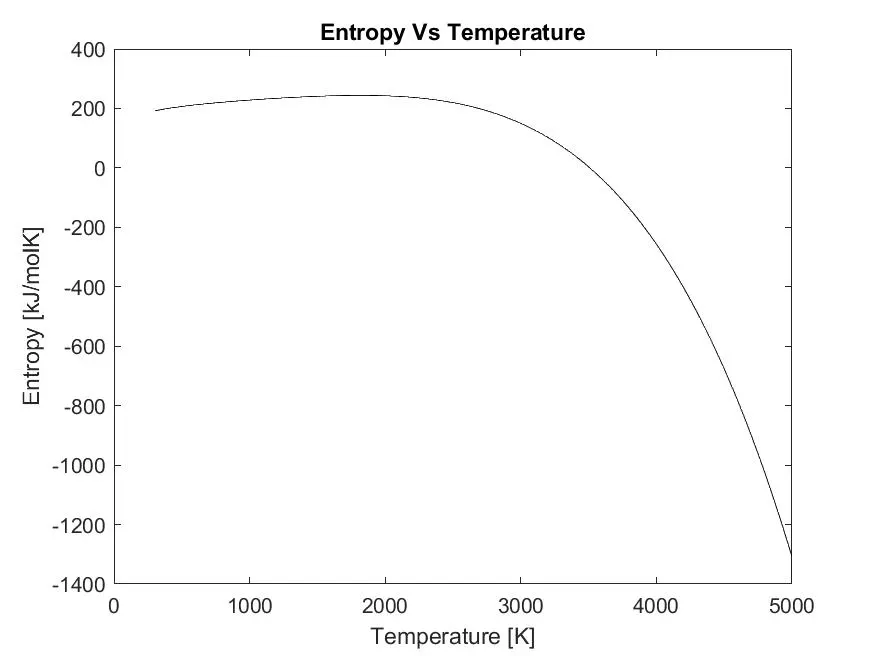
Specific Heat vs Temperature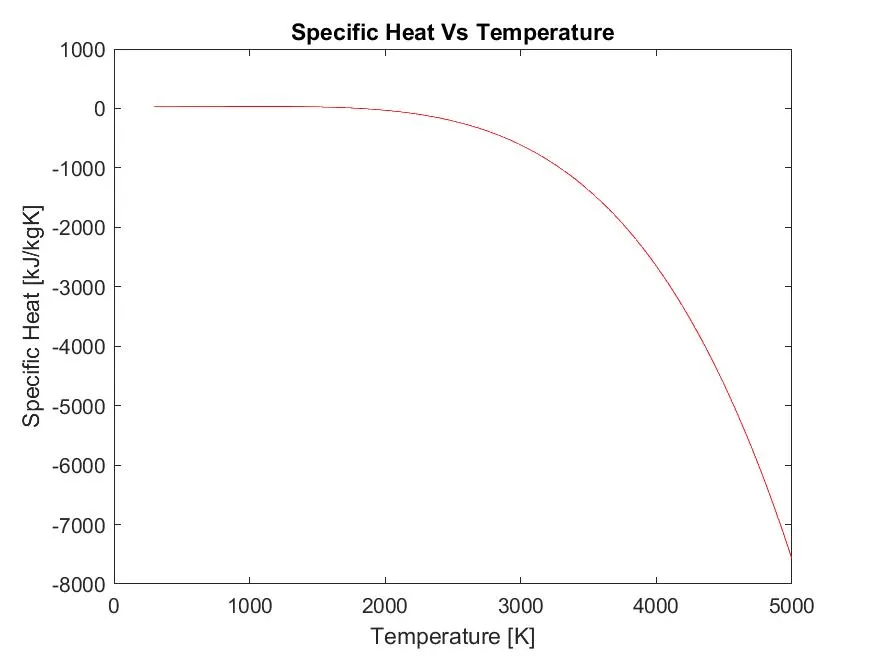
4. Plots for CO2:
Enthalpy vs Temperature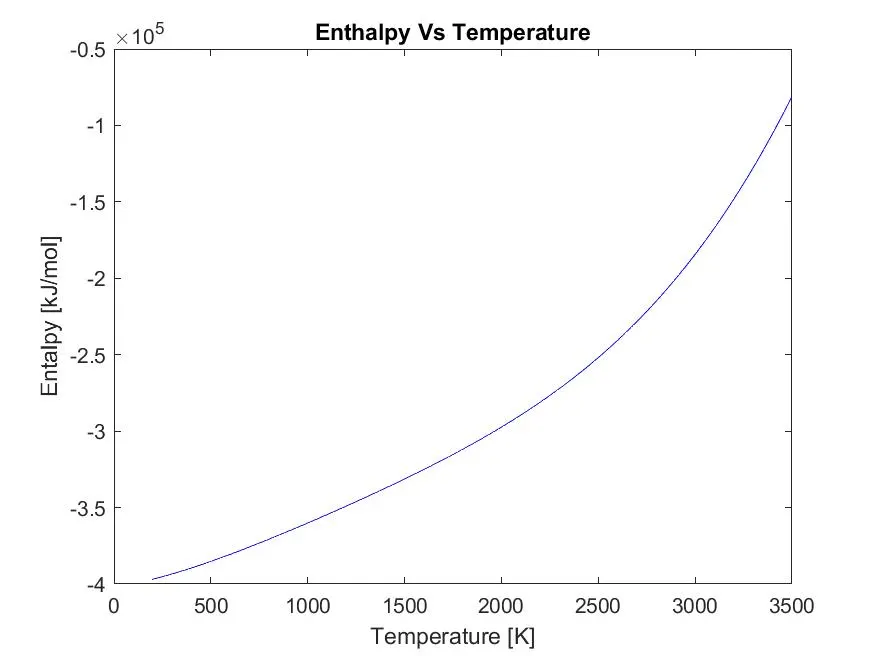
Entropy vs Temperature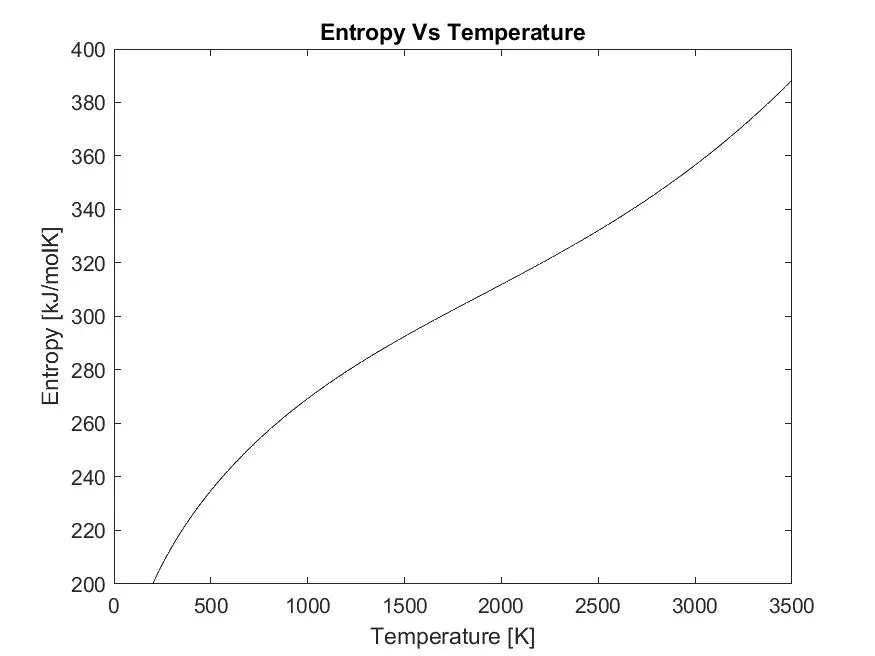
Specific Heat vs Temperature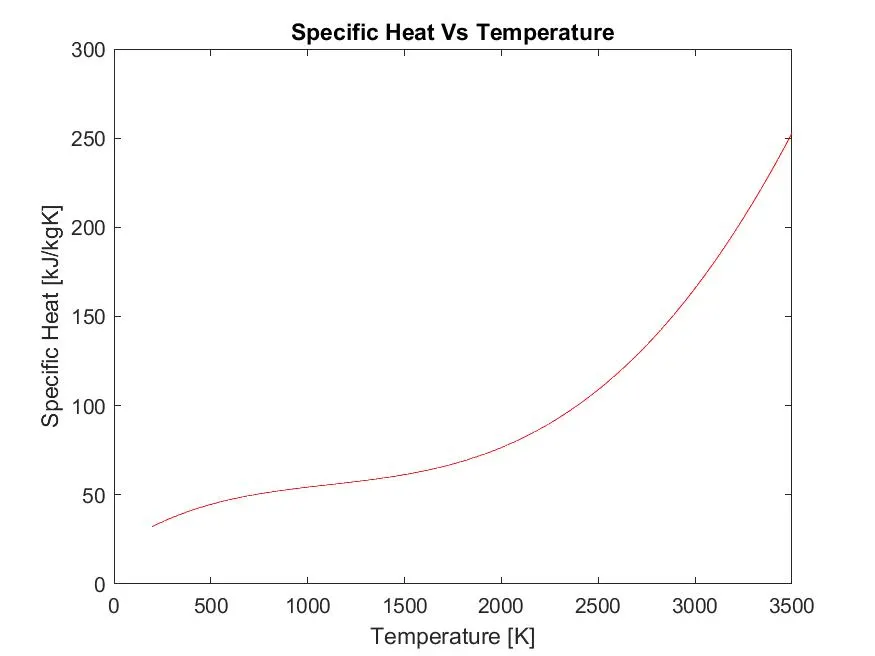
5. MATLAB Code:
clear all
close all
clc

%Opening THERMO.dat file
f1=fopen('THERMO.dat','r');
fgetl(f1);

%Get Global temperatures
temp_global=fgetl(f1);
G=strsplit(temp_global,' ');

%Converting Strings to numbers
Globaltemp_low=str2num(G{2});
Globaltemp_medium=str2num(G{3});
Globaltemp_high=str2num(G{4});

%Displaying the global temperature values in command window
head='Global Temperature Values are ';
fprintf('%sn',head);
disp(Globaltemp_low);
disp(Globaltemp_medium);
disp(Globaltemp_high);

%Ignoring next 3 lines
fgetl(f1);
fgetl(f1);
fgetl(f1);

%Reading the coefficients of each species
for i=1:53

    Species=fgetl(f1);
    sp_name=Species(1:9);

    %Obtaining Local Temperatures for Species
    temp_low=Species(49:55);
    temp_high=Species(58:65);
    temp_avg=Species(68:75);

    temp_l=str2num(temp_low);
    temp_h=str2num(temp_high);
    temp_a=str2num(temp_avg);

    %Obtaining High Temperature Coefficients for Individual Species

    line_1=fgetl(f1);
    A=strfind(line_1,'E');
    a1=str2double(line_1(1:A(1)+3));
    a2=str2double(line_1(A(1)+4:A(2)+3));
    a3=str2double(line_1(A(2)+4:A(3)+3));
    a4=str2double(line_1(A(3)+4:A(4)+3));
    a5=str2double(line_1(A(4)+4:A(5)+3));

    line_2=fgetl(f1);
    a6=str2double(line_2(1:A(1)+3));
    a7=str2double(line_2(A(1)+4:A(2)+3));
    a8=str2double(line_2(A(2)+4:A(3)+3));
    a9=str2double(line_2(A(3)+4:A(4)+3));
    a10=str2double(line_2(A(4)+4:A(5)+3));

    line_3=fgetl(f1);
    a11=str2double(line_3(1:A(1)+3));
    a12=str2double(line_3(A(1)+4:A(2)+3));
    a13=str2double(line_3(A(2)+4:A(3)+3));
    a14=str2double(line_3(A(3)+4:A(4)+3));

    R=8.314;
    t=linspace(temp_l,temp_h,500);

    %Calculate Values of Cp, H & S from given equations
     for j=1:500

         if  t>temp_a

            cp=(a1+a2.*t+(a3.*t.^2)+(a4.*t.^3)+(a5.*t.^4)).*R;
            h=(a1+(a2.*t./2)+(a3.*(t.^2)./3)+(a4.*(t.^3)./4)+(a5.*(t.^4)./5)+(a6./t)).*R.*t;
            s=(a1*log(t)+a2.*t+(a3.*(t.^2)./2)+(a4.*(t.^3)./3)+(a5.*(t.^4)./4)+a7).*R;

         else
            cp=(a8+a9.*t+(a10.*t.^2)+(a11.*t.^3)+(a12.*t.^4)).*R;
            h=(a8+(a9.*t./2)+(a10.*(t.^2)./3)+(a11.*(t.^3)./4)+(a12.*(t.^4)./5)+(a13./t)).*R.*t;
            s=(a8*log(t)+a9.*t+(a10.*(t.^2)./2)+(a11.*(t.^3)./3)+(a12.*(t.^4)./4)+a14).*R;
         end
     end

     %Calculate Molecular mass for each species
     sp_n=deblank(sp_name);
     element={'C';'H';'O';'N';'A'};
     weight=[12,1,16,14,40];
     M=0;
     for i=1:length(sp_name)
        for j=1:(length(element))

            if strcmp(sp_name(i),element(j))
                M=M+weight(j);
                a=j;
            end
        end

        b=str2num(sp_name(i));
        if b>1
             M=M+weight(a)*(b-1);
        end
     end

     %Print molecular mass of species in command window
     fprintf('Molecular Weight of ')
     disp(sp_name)
     fprintf('is')
     disp(M);

     Working_dir=pwd;

     %Creating New Directory
     mkdir('Plots', sp_name);
     cd('Plots');
     cd(sp_name);

     %Plotting Specific HEat, Enthalpy & Entropy Vs Temperature
     figure(1)
     plot(t,cp,'color','r');
     xlabel('Temperature [K]');
     ylabel('Specific Heat [kJ/kgK]');
     title('Specific Heat Vs Temperature');

     figure(2)
     plot(t,h,'color','b');
     xlabel('Temperature [K]');
     ylabel('Entalpy [kJ/mol]');
     title('Enthalpy Vs Temperature');

     figure(3)
     plot(t,s,'color','k');
     xlabel('Temperature [K]');
     ylabel('Entropy [kJ/molK]');
     title('Entropy Vs Temperature');

     %Save images of plots for each species
     saveas(1, 'Specific Heat.jpg');
     saveas(2, 'Enthalpy.jpg');
     saveas(3, 'Entropy.jpg');

     %Back to working directory
     cd(Working_dir);

end

fclose(f1);