Parsing NASA thermodynamic data using MATLAB
Aim:
The main aim is as follows:
- Write a function that extracts the 14 coefficients and calculates the enthalpy, entropy, and specific heats for all the species in the data file.
- Calculate the molecular weight of each species and display it in the command window.
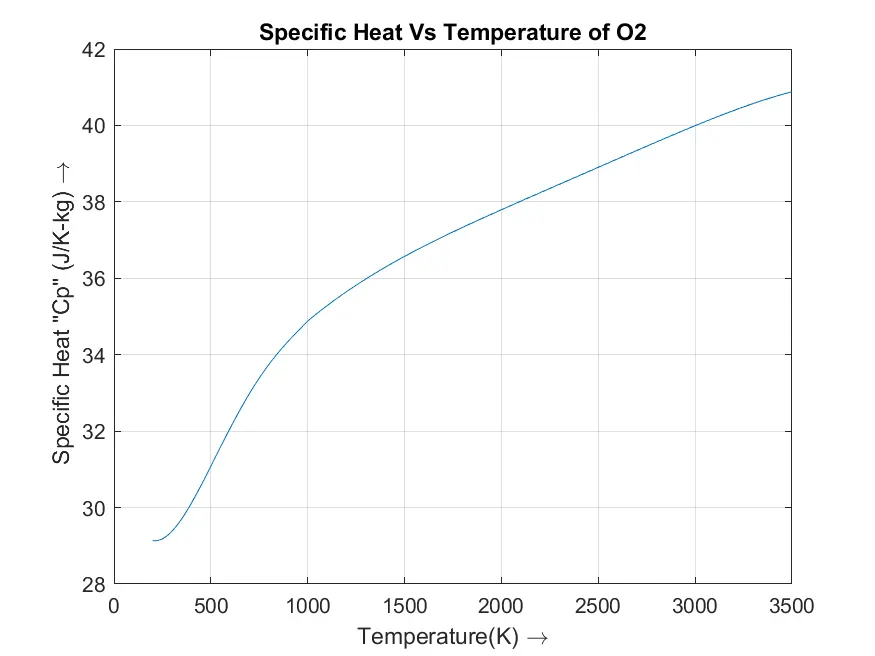
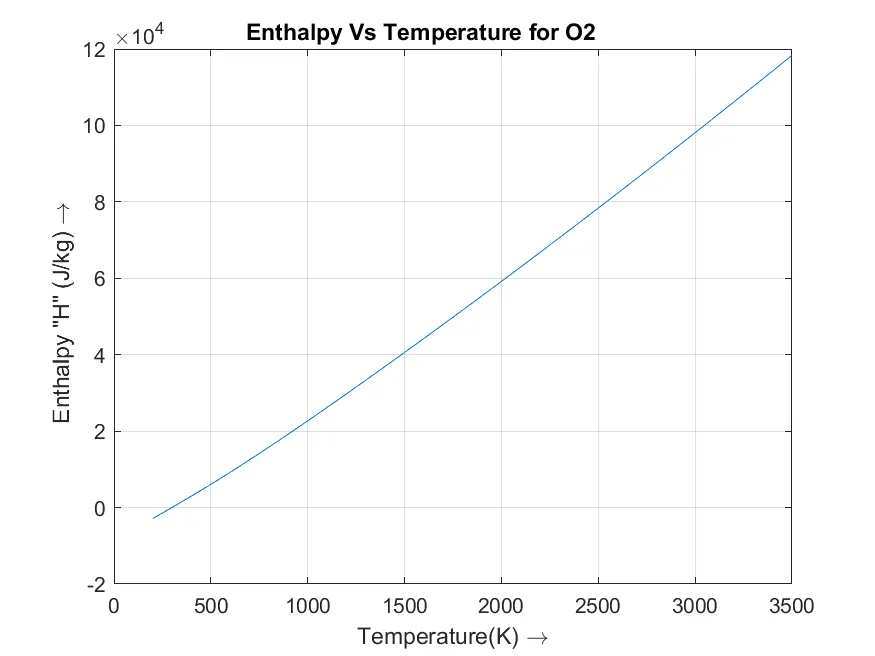
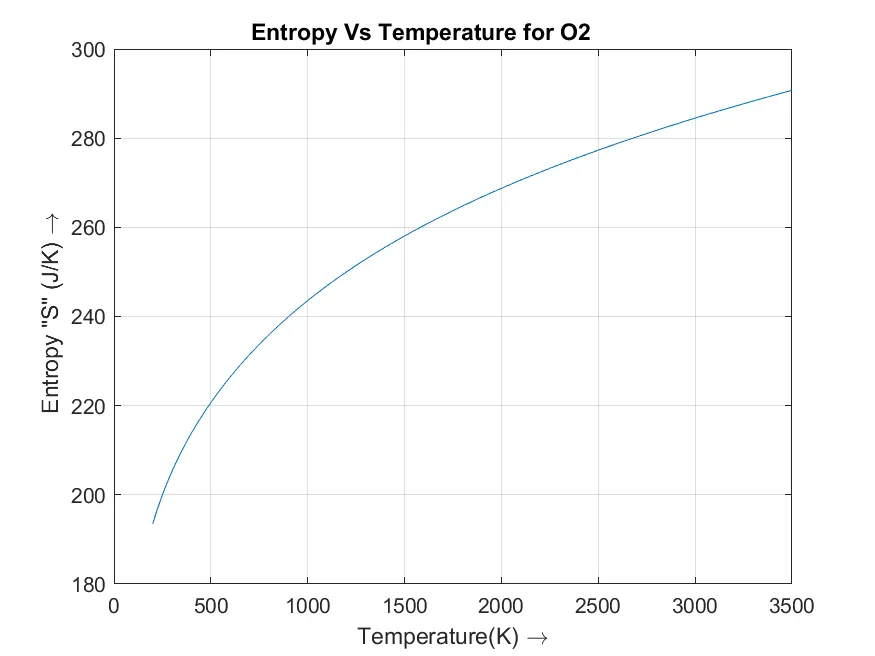
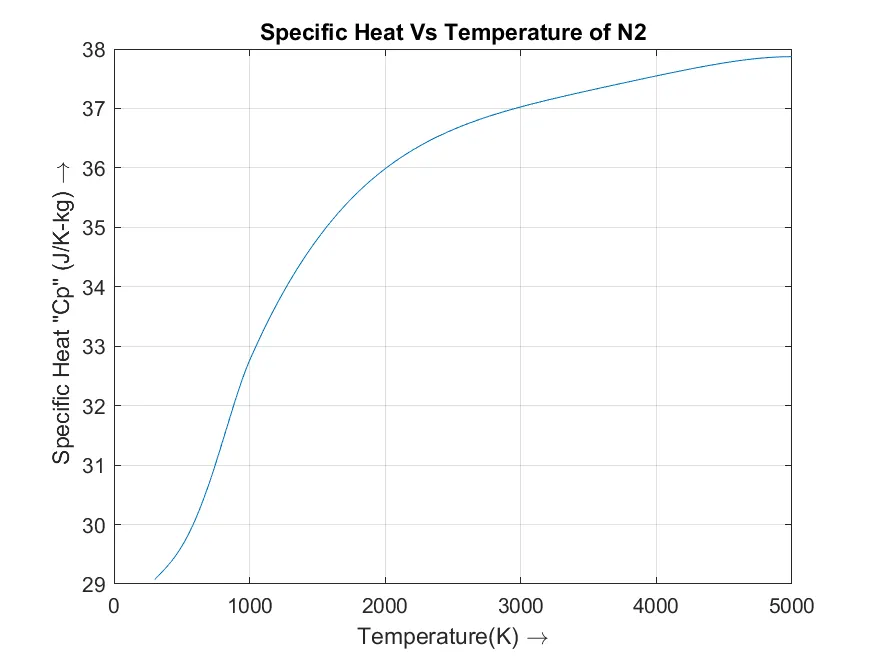
- Plot the Cp, Enthalpy, and Entropy for the local temperature range (low temperature: high temperature) specific for each species.
- Save the plots as images with appropriate names and dump them in separate folders for each species with a suitable name. All these should be generated automatically.
Equation Used:
Specific Heat:
`C_P=R×(a_1+(a_2×T)+(a_3×T^2)+(a_4×T^3)+(a_5×T^4))`
Entropy:
`S=R×(a_1 lnT+(a_2×T)+(a_3×T^2/2)+(a_4×T^3/3)+(a_5×T^4/4)+a_7)`
Enthalpy:
`H=R×T×(a_1+(a_2×T/2)+(a_3×T^2/3)+(a_4×T^3/4)+(a_5×T^4/5)+a_6/T)`
Where R is the Universal Gas Constant
T is the Temperature
`a_1, a_2, a_3......a_14` is the coefficients
Procedure:
- The Code starts with the clear, close, and clc.
- The Next thing to do is to open the file by using the ‘fopen’ function.
% Reading the NASA Thermodynamic data file using 'fopen' function
data_file = fopen('THERMO.dat','r');
- To read the data in the file ‘fgetl’ function is used. The 1st five lines are considered as comments
for m = 1:5
    string_1 = fgetl(data_file);
end
- The 2nd line consists of the Global temperature ranges with low mid and high-temperature ranges.
- A temperature range is calculated by using the ‘strfind’ option.
% getting the first line of the data
for i= 1:53
    string_1 = fgetl(data_file);
    string_2 = strfind(string_1, '.');
- Low temperature is calculated with the low and mid-temperature ranges.
- High temperature is calculated with the mid and high-temperature ranges.
 % To find the temperature ranges, the Data file is checked. 1st
    % Temperature is low Temperature, middle one being the High Temperature
    % and the last one is the mid Temperature.
    temperature_range = zeros(1,3);
    for l= 1:length(string_2)
        % The String_2(1)-4 takes '.' as base and go to the 4th position
        % before the '.' to the 3 positions after the '.'
        temperature_range(l) = str2double(string_1(string_2(l)-4 : string_2(l)+3));
    end

    % Low-Temperature range at each Species is calculated by subtracting 1st and 3rd
    % range in temperature.
    % High Temperature range at each species is calculated by subtracting 3rd and
    % 2st.
    low_temperature = linspace(temperature_range(1),temperature_range(3), 1000); % Low Temperature is calculated from the temperature 1 to temperature 3 (Which are Low and Mid Temperatures)
    high_temperature= linspace(temperature_range(3),temperature_range(2), 1000); % High Temperature is calculated from the Temperature range 3 to Temperature range 2 ( Which are the mid Temperature to High Temperature)
Temperature = [low_temperature high_temperature];- For the 14 different constants values, a nested for loop is written to extract it.
    int = 0;

    %Thermodynamic coefficients
    a = zeros(1,14);
    for j=1:3
        read_1 = fgetl(data_file);

        c = strfind(read_1, 'E');
        for k=1:5
            a(k+int) =str2double(read_1(c(k)-11:c(k)+3));
            if j==3 && k==4
                break
            end
        end
        int = int+5;
end- The code is written for the Calculation of Specific Heat, Entropy, and Enthalpy for High and low temperatures. The values are then stored in each array.
% Thermodynamic Properties
    Cp_high = R*(a(1) +a(2).*high_temperature + a(3).*high_temperature.^2 + a(4).*high_temperature.^3 +a(5).*high_temperature.^4);
    H_high = R.*high_temperature.*(a(1) + a(2).*high_temperature./2 + a(3).*high_temperature.^2./3 + a(4).*high_temperature.^3./4 +a(5).*high_temperature.^4./5 +a(6)./high_temperature);
    S_high = R* (a(1).*log(high_temperature) + a(2).*high_temperature + a(3).*high_temperature.^2./2 + a(4).*high_temperature.^3./3 +a(5).*high_temperature.^4./4 + a(7));


    Cp_low = R*(a(8) +a(9).*low_temperature + a(10).*low_temperature.^2 + a(11).*low_temperature.^3 +a(12).*low_temperature.^4);
    H_low = R.*low_temperature.*(a(8) + a(9).*low_temperature./2 + a(10).*low_temperature.^2./3 + a(11).*low_temperature.^3./4 +a(12).*low_temperature.^4./5 +a(13)./low_temperature);
    S_low = R* (a(8).*log(low_temperature) + a(9).*low_temperature + a(10).*low_temperature.^2./2 + a(11).*low_temperature.^3./3 +a(12).*low_temperature.^4./4 + a(14));

    Cp = [Cp_low Cp_high];
    H = [H_low H_high];
S = [S_low S_high];- Creating an individual folder for each file.
    % For creating a folder with species name, string with only specie's
    % name is required with no blank space.

    specie = string_1(1:12);
    specie = specie(~isspace(string_1(1:12)));


mkdir(specie)- Molecular weight is calculated by writing a function for it.
function Mol = molecular_wt(species_name)

%Defining atoms and their respective atomic weights
Atoms = ['H','C', 'N', 'O','Ar'];
Atomic_weight = [1,12,14,16,40];
Mol=0;

for i = 1:length(species_name)
    for j = 1:length(Atoms)
        if strcmp(species_name(i),Atoms(j))
            Mol= Mol+ Atomic_weight(j);
            apply = j;
        end
    end
    n = str2num(species_name(i));
    if(n>1)
        Mol= Mol +Atomic_weight(apply)*(n-1);
    end
end

fprintf('Molecular Weight of %s: ', species_name);
fprintf('%f',Mol);
disp(' ')
end- Plotting of graphs is done for Specific Heat Vs Temperature, Enthalpy Vs Temperature, and Entropy Vs Temperature.
%plotting the graph
    figure(1)
    plot(Temperature, Cp);
    title(sprintf('Specific Heat Vs Temperature of %s',specie))
    xlabel('Temperature(K) rightarrow')
    ylabel(' Specific Heat "Cp" (J/K-kg) rightarrow')
    file = fullfile('E:My FilesMATLABMATLAB for MechData Parsing',specie,'Specific Heat Vs Temperature.png');
    grid on
    saveas(1, file);

    figure(2)
    plot(Temperature, H);
    title(sprintf('Enthalpy Vs Temperature for %s',string_1(1:12)))
    xlabel('Temperature(K) rightarrow')
    ylabel(' Enthalpy "H" (J/kg) rightarrow')
    file = fullfile('E:My FilesMATLABMATLAB for MechData Parsing',specie,'Enthalpy Vs Temperature.png');
    grid on
    saveas(2, file);

    figure(3)
    plot(Temperature, S);
    title(sprintf('Entropy Vs Temperature for %s',string_1(1:12)))
    xlabel('Temperature(K) rightarrow')
    ylabel(' Entropy "S" (J/K) rightarrow')
    file = fullfile('E:My FilesMATLABMATLAB for MechData Parsing',specie,'Entropy Vs Temperature.png');
    grid on
    saveas(3, file);
Code:
For Main Code:
clear
close
clc

% Reading the NASA Thermodynamic data file using 'fopen' function
data_file = fopen('THERMO.dat','r');

%'fgetl' is used to read the data file line by line.
% First 5 lines are generally considered as comments.
for m = 1:5
    string_1 = fgetl(data_file);
end

% getting the first line of the data
for i= 1:53
    string_1 = fgetl(data_file);
    string_2 = strfind(string_1, '.');
    string_3 = strsplit(string_1, ' ');  % For Molecular weight calculation the string is split at " " and therefore the term value is split for every 'Letter' before the space.
    species = (string_3{1}); % Selecting the string for letters

    % To find the temperature ranges, the Data file is checked. 1st
    % Temperature is low Temperature, middle one being the High Temperature
    % and the last one is the mid Temperature.
    temperature_range = zeros(1,3);
    for l= 1:length(string_2)
        % The String_2(1)-4 takes '.' as base and go to the 4th position
        % before the '.' to the 3 positions after the '.'
        temperature_range(l) = str2double(string_1(string_2(l)-4 : string_2(l)+3));
    end

    % Low-Temperature range at each Species is calculated by subtracting 1st and 3rd
    % range in temperature.
    % High Temperature range at each species is calculated by subtracting 3rd and
    % 2st.
    low_temperature = linspace(temperature_range(1),temperature_range(3), 1000); % Low Temperature is calculated from the temperature 1 to temperature 3 (Which are Low and Mid Temperatures)
    high_temperature= linspace(temperature_range(3),temperature_range(2), 1000); % High Temperature is calculated from the Temperature range 3 to Temperature range 2 ( Which are the mid Temperature to High Temperature)
    Temperature = [low_temperature high_temperature];

    int = 0;

    %Thermodynamic coefficients
    a = zeros(1,14);
    for j=1:3
        read_1 = fgetl(data_file);

        c = strfind(read_1, 'E');
        for k=1:5
            a(k+int) =str2double(read_1(c(k)-11:c(k)+3));
            if j==3 && k==4
                break
            end
        end
        int = int+5;
    end

    % Gas constant and Local Temperature range
    R = 8.314;

    % Thermodynamic Properties
    Cp_high = R*(a(1) +a(2).*high_temperature + a(3).*high_temperature.^2 + a(4).*high_temperature.^3 +a(5).*high_temperature.^4);
    H_high = R.*high_temperature.*(a(1) + a(2).*high_temperature./2 + a(3).*high_temperature.^2./3 + a(4).*high_temperature.^3./4 +a(5).*high_temperature.^4./5 +a(6)./high_temperature);
    S_high = R* (a(1).*log(high_temperature) + a(2).*high_temperature + a(3).*high_temperature.^2./2 + a(4).*high_temperature.^3./3 +a(5).*high_temperature.^4./4 + a(7));


    Cp_low = R*(a(8) +a(9).*low_temperature + a(10).*low_temperature.^2 + a(11).*low_temperature.^3 +a(12).*low_temperature.^4);
    H_low = R.*low_temperature.*(a(8) + a(9).*low_temperature./2 + a(10).*low_temperature.^2./3 + a(11).*low_temperature.^3./4 +a(12).*low_temperature.^4./5 +a(13)./low_temperature);
    S_low = R* (a(8).*log(low_temperature) + a(9).*low_temperature + a(10).*low_temperature.^2./2 + a(11).*low_temperature.^3./3 +a(12).*low_temperature.^4./4 + a(14));

    Cp = [Cp_low Cp_high];
    H = [H_low H_high];
    S = [S_low S_high];

    % For creating a folder with species name, string with only specie's
    % name is required with no blank space.

    specie = string_1(1:12);
    specie = specie(~isspace(string_1(1:12)));


    mkdir(specie)

    Mol = molecular_wt(species);

    M_file = fopen('Molecular Weight.txt','w');
    fprintf(M_file,'Molecular Weight of %s is %d', species,Mol);
    fclose(M_file);


    %plotting the graph
    figure(1)
    plot(Temperature, Cp);
    title(sprintf('Specific Heat Vs Temperature of %s',specie))
    xlabel('Temperature(K) rightarrow')
    ylabel(' Specific Heat "Cp" (J/K-kg) rightarrow')
    file = fullfile('E:My FilesMATLABMATLAB for MechData Parsing',specie,'Specific Heat Vs Temperature.png');
    grid on
    saveas(1, file);

    figure(2)
    plot(Temperature, H);
    title(sprintf('Enthalpy Vs Temperature for %s',string_1(1:12)))
    xlabel('Temperature(K) rightarrow')
    ylabel(' Enthalpy "H" (J/kg) rightarrow')
    file = fullfile('E:My FilesMATLABMATLAB for MechData Parsing',specie,'Enthalpy Vs Temperature.png');
    grid on
    saveas(2, file);

    figure(3)
    plot(Temperature, S);
    title(sprintf('Entropy Vs Temperature for %s',string_1(1:12)))
    xlabel('Temperature(K) rightarrow')
    ylabel(' Entropy "S" (J/K) rightarrow')
    file = fullfile('E:My FilesMATLABMATLAB for MechData Parsing',specie,'Entropy Vs Temperature.png');
    grid on
    saveas(3, file);


end
For Molecular Weight Function:
function Mol = molecular_wt(species_name)

%Defining atoms and their respective atomic weights
Atoms = ['H','C', 'N', 'O','Ar'];
Atomic_weight = [1,12,14,16,40];
Mol=0;

for i = 1:length(species_name)
    for j = 1:length(Atoms)
        if strcmp(species_name(i),Atoms(j))
            Mol= Mol+ Atomic_weight(j);
            apply = j;
        end
    end
    n = str2num(species_name(i));
    if(n>1)
        Mol= Mol +Atomic_weight(apply)*(n-1);
    end
end

fprintf('Molecular Weight of %s: ', species_name);
fprintf('%f',Mol);
disp(' ')
end
Result:
The code is written for the NASA Thermodynamic Data. The Molecular Weight is calculated for all the Species.
For `O_2`:
Specific Heat Vs Temperature:
Enthalpy Vs Temperature:
Entropy Vs Temperature:
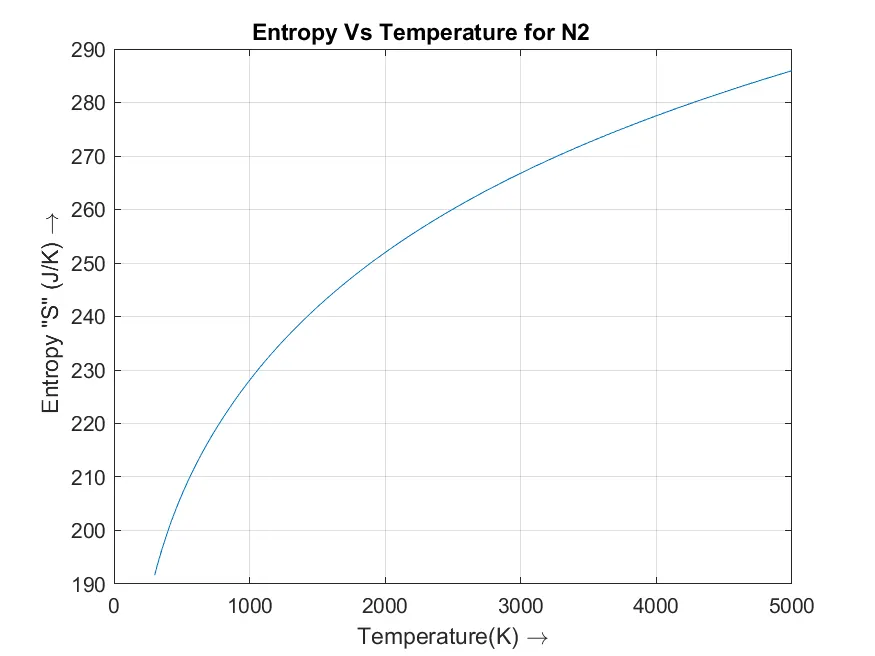
For `N_2`:
Specific Heat Vs Temperature:
Enthalpy Vs Temperature:
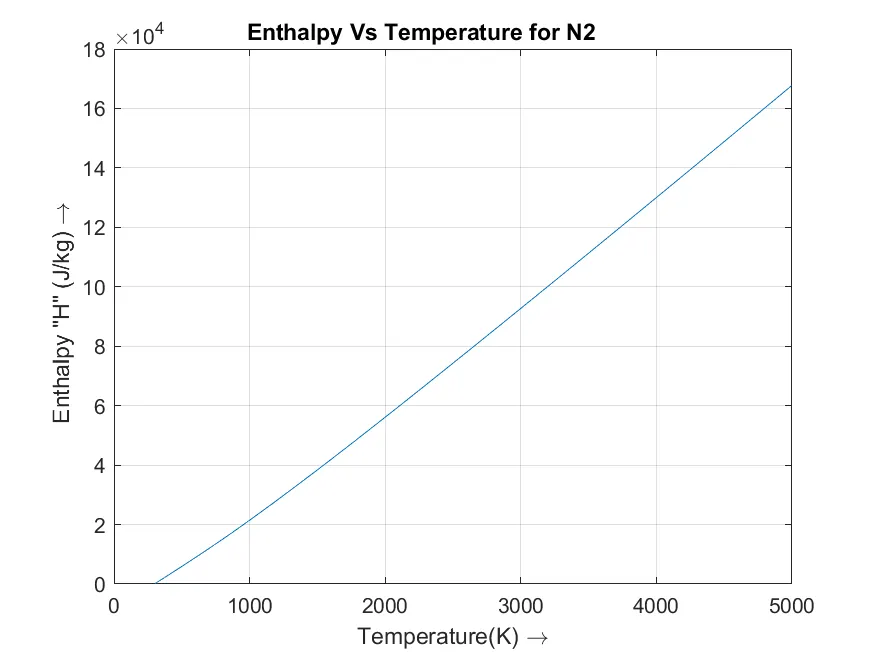
Entropy Vs Temperature:
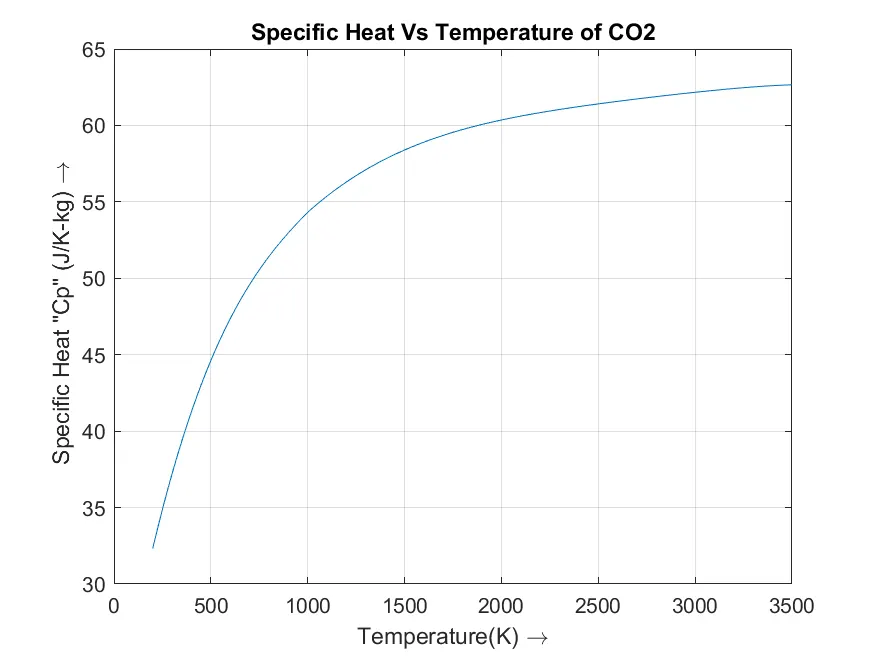
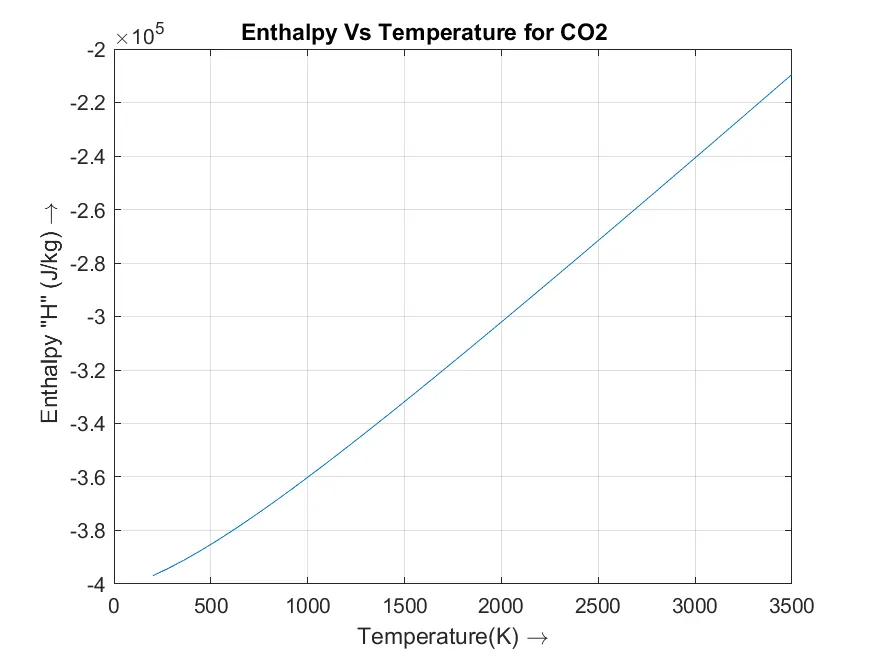
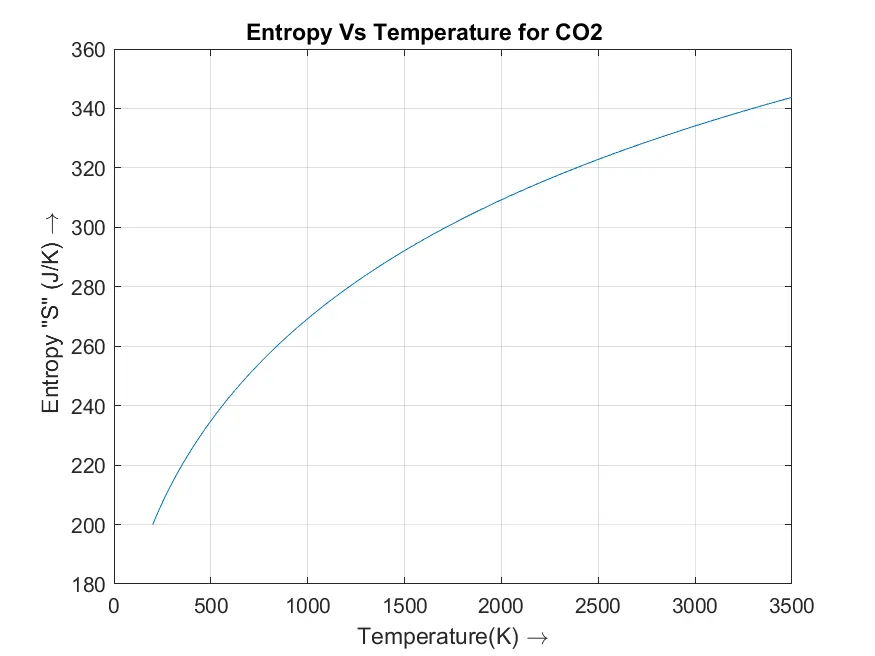
For `CO_2`:
Specific Heat Vs Temperature:
Enthalpy Vs Temperature:
Entropy Vs Temperature:
Errors:
The errors made were mostly syntax errors and some errors were fixed during the initial stages of coding. The main problem arises when writing the code for the molecular weight, the weights are to be learned and the code is should be written for the species name and the Atoms with the respective atomic weights in a nested for loop. Initially, I tried to take a single for loop and tried to include the species with atoms and atomic weights but the code didn’t show the desired output. Therefore, the code is made using a nested loop.
Links: