Data analysis For the IC Engine using Python
Objective:
The main objective is to create a Data Analysis code of the Engine using Python.
Rules:
There was a set of rules given which should be used to create the code perfectly. The main rule is to save the file in the same folder as the code.
Data visualizer:
- The script should take column numbers as the input and plot the respective columns as separate images
- Each file should be saved by the name of the column
- The plot labels should be extracted from the file. If requested for a plot between column 1 (crank angle) and column 8(volume), then the label information should automatically be extracted and must appear as labels in the plots automatically.
Compatibility check:
- The code should exit gracefully if a non-compatible file is provided as an input. It should return the value as "File not recognized. Please provide a valid CONVERGE output file"
Basic performance calculation:
- Calculate the area under the P-V diagram. P is in column 2 and V is in column 8.
- Calculate the power output of this engine. Assume that RPM is 1500
- This engine consumed 20 micrograms of fuel (per 1 stroke cycle). Calculate its specific fuel consumption.
Theory:
Initially, to get the basic idea of the rules, the Data Visualizer part needs to take inputs of the columns which are required to make a plot, and then the plot should be saved in the name of the column.
The Compatibility Check rule depends on the file which is given to extract the data. If the data isn’t present, the code returns that the file isn’t recognized.
The Last set of rules states the basic performance calculation of the engine. The Area, Power output, and Specific fuel Consumption are needed to be calculated.
Equations Used:
The area under p-V Cycle:
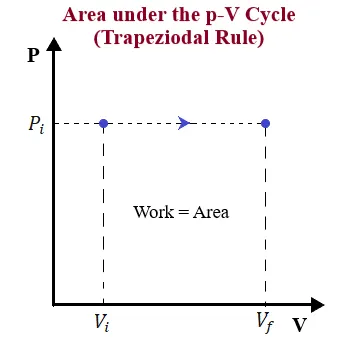
The Area under the p-V cycle is basically the Work done during the Thermodynamic Process.
`W=FΔx=PAΔx=P(AΔx)=PΔV`
Where W= Work Done
P= Pressure
V= Volume
`ΔV` = Change in Volume
A = Area under the p-V curve
Here, `PΔV` is generally the height and width of the rectangle. For curved surfaces, the area breaks into an infinite amount of infinitesimally thin rectangles. It follows the Trapezoidal rule for integrating discrete function. The trapezoidal rule works by approximating the region under the graph of the function f(x) as a trapezoid and calculating its area. This can be done by using the NumPy module.
Power Output of the Engine:
The power output of the engine is generally the Work done with the number of strokes in it.
Power = Work done (W) `×` No. of Strokes per second (n)
Where,
No. of Strokes per second (n) = `(RPM)/(2×60)`
Specific Fuel Consumption:
Specific Fuel Consumption = `f_s/P`
Where,
`f_s`= Amount of fuel consumed = `f×N`
f = Fuel consumed per stroke
N= Number of Strokes.
Procedure:
The procedure for the code is as follows
- Initially, the Libraries are imported from the database.
#Importing the Libraries
import math
import matplotlib.pyplot as plt
import numpy as np
- Checking the Compatibility of the data file. try and except blocks are used here. ‘try’ tests the files for errors and ‘except’ handles the error. Once the compilation is completed it returns the output as either ‘file ran successfully’ or ‘File not recognized. Please provide a valid CONVERGE output file’.
try:
   file= open('engine_data.out')
   print('File opened successfully n')

except FileNotFoundError:
    print('File not recognized. Please provide a valid CONVERGE output filen')
- Parameters are displayed as per the data file.
#To Display the parameters to be selected
   print('The Parameter for the plot and the number associated to it n')
   print(' 1-Crankn 2-Pressuren 3-Maximum Pressuren 4-Minimum Pressuren 5-Mean Temperaturen 6-Maximum Temperaturen 7-Min Temperaturen 8-Volumen 9-Massn'
          +' 10-densityn 11-integrated Heat Rejectionn 12-Heat Rejection Raten 13-Cpn 14-Cvn 15-Gamman 16-kinectic Viscocityn 17-Dynamic Viscocityn')
- Creating the code to take column inputs. First, to take input of how many columns are needed to plot.
counter =1             #Assigning an Counter variable for the Loop to run
   Column = None          # Initially Assigning the Column variable as None
   while Column is None:

     input_value = input('Choose the number of column to be calculated(maximum of 2 column are allowed: ')
     try:
       Column = int(input_value)
     except:
       print("{input} is not a number, Please enter a number".format(input=input_value))
     else:
       break
- If selected zero ‘0’, it returns the output as “Column can’t be 0. Please select number in range (1,2)
    if Column == 0:
       print("Column can't be 0. Please Select number in range (1,2)")
       break
- If an input is given as ‘1’, it compiles the program and requires the input to get the column number which is to be plotted.
if Column == 1:
       column = input("Choose Column Number from parameters 1 to 17: ")
       column = int(column)
break- If an input is given as ‘2’, it compiles the program and the inputs are taken. Then the program checks if both the numbers are given are the same or not. If they are the same, then it returns the output as “Numbers are the same. Please choose Different Numbers.”
if Column ==2:
       column_1 = input('Choose column 1 from the parameters 1 to 17: ' )
       column_2 = input("Choose column 2 (Different from Column 1) from parameters 1 to 17: ")
       column_1= int(column_1)
       column_2= int(column_2)

       counter = counter -1

       if (column_1== column_2):
         print("numbers are same please choose a different number:")
         counter = counter +1
       else:
break- If the input is given as ‘3 or more ’, it returns the output as “The Number is more than required. Please run the code again.”
else:
print("The Number is more than required. Please run the code again.")- Plotting of graph for the column selected as ‘1’. A ‘While’ Loop is created to plot the graphs i.e. the while column =1 then the code runs inside the loop. First, some inputs are given in the code to get the code running. These are like the basic parameters which are required to fulfill the needs of the code. A ‘for’ loop is created to open the data file and check if the data is sufficient then the lines between the file is split into the proper columns names and if the data has some ‘#’ in it then the code shows the value of the column i.e. the values assigned at that column.
# For 1 Column
   while Column == 1:
      column = int(column)
      column_value = []

      for line in open('engine_data.out'):
       if line_count == 3:
         column_name = line.split()[column]
       if '#' not in line:
         column_value.append(float(line.split()[column -1]))

       line_count+=1

      plt.plot(column_value)
      plt.ylabel(column_name)
      plt.savefig('{}'.format(column_name))
      plt.show()
break- Plotting of graph for the column selected as ‘2’. This is similar to that of the above procedure for column value as ‘1’ but the only difference is in this situation the arguments are passed twice because it contains two column values.
# For 2 Column
   while Column ==2:
      column_1= int(column_1)
      column_2= int(column_2)
      value_of_column_1=[]
      value_of_column_2=[]

      for line in open('engine_data.out'):
          if line_count == 3:
              column_name_1=line.split()[column_1]
              column_name_2=line.split()[column_2]
          if '#' not in line:
              value_of_column_1.append(float(line.split()[column_1-1]))
              value_of_column_2.append(float(line.split()[column_2-1]))

          line_count+=1
      plt.plot(value_of_column_2,value_of_column_1)
      plt.xlabel(column_name_1)
      plt.ylabel(column_name_2)
      plt.savefig('{} Vs{}'.format(column_name_1,column_name_2))
      plt.show()
break- The Data Visualization is completed.
- The basic Performance of the Engine code is written as below. It takes the various inputs as given in Rules. The code runs by assigning the values to the data array and storing it in it. Then parameters are stored in the parameters array. Initial pressure and volume arrays are assigned which is an empty array. The formulas are given as per the ‘Equations Used’
#Area under curve that is work done
   ct =1
   data_array=[]
   print("--------------------------------------------------------n")
   print("Performance of the Enginen")
   with open('engine_data.out') as f:
     for line in f:
       if '#' not in line:
         data_array.append([float(i) for i in line.split()])
   parameters=[]
   with open('engine_data.out') as l:
     for line in l:
       if '#' in line:
         for i in range(3,5):
           if ct is i:
             #print(line.split())
             parameters.append([str(k) for k in line.split()])
         ct = ct + 1
   pressure=[]
   volume=[]
   for r in range(0,2):
     del(parameters[r][0])
   for num in range(0,len(data_array)):
     pressure.append(data_array[num][1])
     volume.append(data_array[num][7])

   xvalues = []
   yvalues = []
   xvalues = volume
   yvalues = pressure

   Area = np.trapz(yvalues,xvalues)
   massflowrate = 20     #grams/stroke cycle
   no_of_strokes = 4     #Number of Strokes - 2 revolutions of the crank shaft per 4 strokes (1 Cycle)
   RPM = 1500            #Revolutions per Minute
   mfr = (massflowrate*no_of_strokes*60*60)/np.power(10,9)   #Fuel Consumption kg/hr
   Work = Area *np.power(10,6)
   power = Work * (RPM/2*60)
   Power = power/1000
   SFC = mfr / Power
   print(' Area under the PV cycle i.e. work done per Cycle= {} Jn '.format(Work))
   print(' Power Output of the Engine at {} RPM = {} kW.n'.format(RPM,Power))
print(' Specific Fuel Consumption =' , SFC, 'g/kWh.')- The code ends with printing the values of the Area, Power, and the Specific Fuel Consumption of an Engine.
The complete code is given below.
#Data Analysis using File Parsing for an Engine

#Importing the Libraries
import math
import matplotlib.pyplot as plt
import numpy as np


line_count=1
#Checking Compatibility of the Data File
try:
   file= open('engine_data.out')
   print('File opened successfully n')

   #To Display the parameters to be selected
   print('The Parameter for the plot and the number associated to it n')
   print(' 1-Crankn 2-Pressuren 3-Maximum Pressuren 4-Minimum Pressuren 5-Mean Temperaturen 6-Maximum Temperaturen 7-Min Temperaturen 8-Volumen 9-Massn'
          +' 10-densityn 11-integrated Heat Rejectionn 12-Heat Rejection Raten 13-Cpn 14-Cvn 15-Gamman 16-kinectic Viscocityn 17-Dynamic Viscocityn')


   counter =1             #Assigning an Counter variable for the Loop to run
   Column = None          # Initially Assigning the Column variable as None
   while Column is None:

     input_value = input('Choose the number of column to be calculated(maximum of 2 column are allowed: ')
     try:
       Column = int(input_value)
     except:
       print("{input} is not a number, Please enter a number".format(input=input_value))
     else:
       break

   while Column <=2:
     if Column == 0:
       print("Column can't be 0. Please Select number in range (1,2)")
       break
     if Column == 1:
       column = input("Choose Column Number from parameters 1 to 17: ")
       column = int(column)
       break
     if Column ==2:
       column_1 = input('Choose column 1 from the parameters 1 to 17: ' )
       column_2 = input("Choose column 2 (Different from Column 1) from parameters 1 to 17: ")
       column_1= int(column_1)
       column_2= int(column_2)

       counter = counter -1

       if (column_1== column_2):
         print("numbers are same please choose a different number:")
         counter = counter +1
       else:
         break

   else:
     print("The Number is more than required. Please run the code again.")

   # For Plotting of Graph

   # For 1 Column
   while Column == 1:
      column = int(column)
      column_value = []

      for line in open('engine_data.out'):
       if line_count == 3:
         column_name = line.split()[column]
       if '#' not in line:
         column_value.append(float(line.split()[column -1]))

       line_count+=1

      plt.plot(column_value)
      plt.ylabel(column_name)
      plt.savefig('{}'.format(column_name))
      plt.show()
      break

   # For 2 Column
   while Column ==2:
      column_1= int(column_1)
      column_2= int(column_2)
      value_of_column_1=[]
      value_of_column_2=[]

      for line in open('engine_data.out'):
          if line_count == 3:
              column_name_1=line.split()[column_1]
              column_name_2=line.split()[column_2]
          if '#' not in line:
              value_of_column_1.append(float(line.split()[column_1-1]))
              value_of_column_2.append(float(line.split()[column_2-1]))

          line_count+=1
      plt.plot(value_of_column_2,value_of_column_1)
      plt.xlabel(column_name_1)
      plt.ylabel(column_name_2)
      plt.savefig('{} Vs{}'.format(column_name_1,column_name_2))
      plt.show()
      break

   #Area under curve that is work done
   ct =1
   data_array=[]
   print("--------------------------------------------------------n")
   print("Performance of the Enginen")
   with open('engine_data.out') as f:
     for line in f:
       if '#' not in line:
         data_array.append([float(i) for i in line.split()])
   parameters=[]
   with open('engine_data.out') as l:
     for line in l:
       if '#' in line:
         for i in range(3,5):
           if ct is i:
             #print(line.split())
             parameters.append([str(k) for k in line.split()])
         ct = ct + 1
   pressure=[]
   volume=[]
   for r in range(0,2):
     del(parameters[r][0])
   for num in range(0,len(data_array)):
     pressure.append(data_array[num][1])
     volume.append(data_array[num][7])

   xvalues = []
   yvalues = []
   xvalues = volume
   yvalues = pressure

   Area = np.trapz(yvalues,xvalues)
   massflowrate = 20     #grams/stroke cycle
   no_of_strokes = 4     #Number of Strokes - 2 revolutions of the crank shaft per 4 strokes (1 Cycle)
   RPM = 1500            #Revolutions per Minute
   mfr = (massflowrate*no_of_strokes*60*60)/np.power(10,9)   #Fuel Consumption kg/hr
   Work = Area *np.power(10,6)
   power = Work * (RPM/2*60)
   Power = power/1000
   SFC = mfr / Power
   print(' Area under the PV cycle i.e. work done per Cycle= {} Jn '.format(Work))
   print(' Power Output of the Engine at {} RPM = {} kW.n'.format(RPM,Power))
   print(' Specific Fuel Consumption =' , SFC, 'g/kWh.')

except FileNotFoundError:
    print('File not recognized. Please provide a valid CONVERGE output filen')
Output:
There are different Outputs for different parameters selected. It is as below. For every output, it returns the value for the Basic Performance of the Engine.
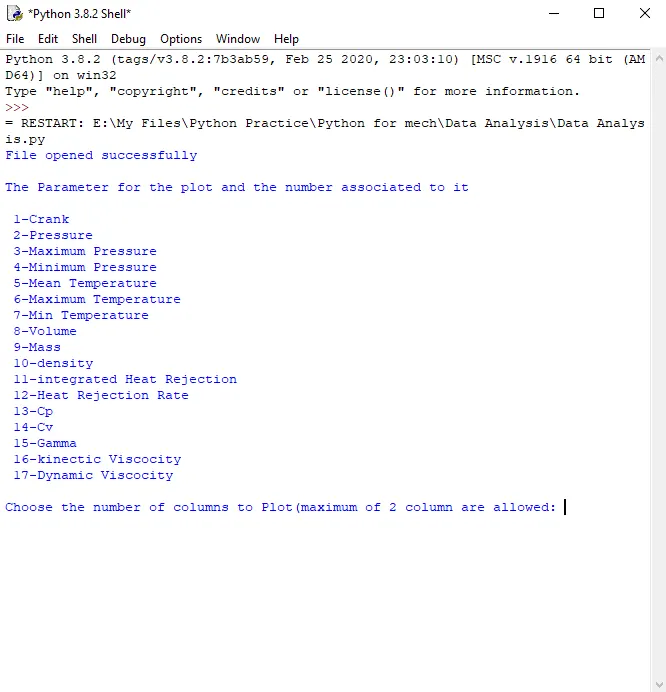
- For Opening the File.
a) If the File is successfully opened. The output is as follows.
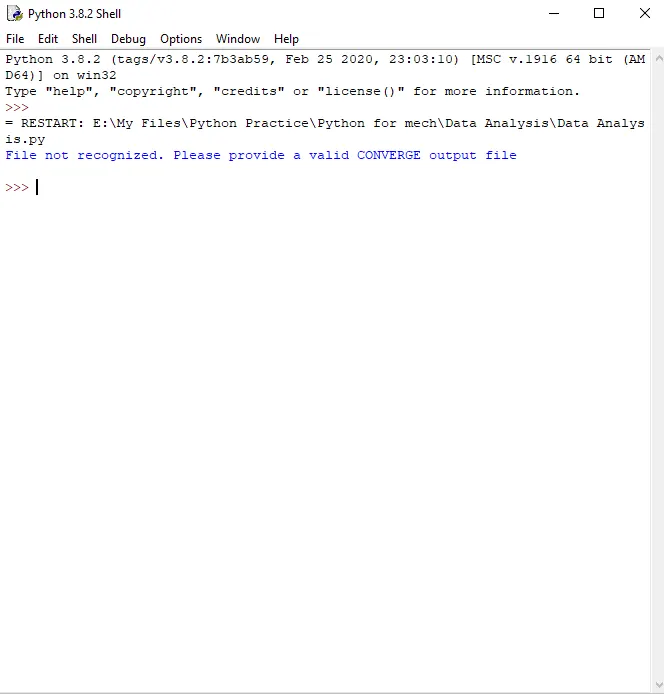
b) If the File is not opened successfully. The output is as follows.
- For taking the Inputs for the Column:
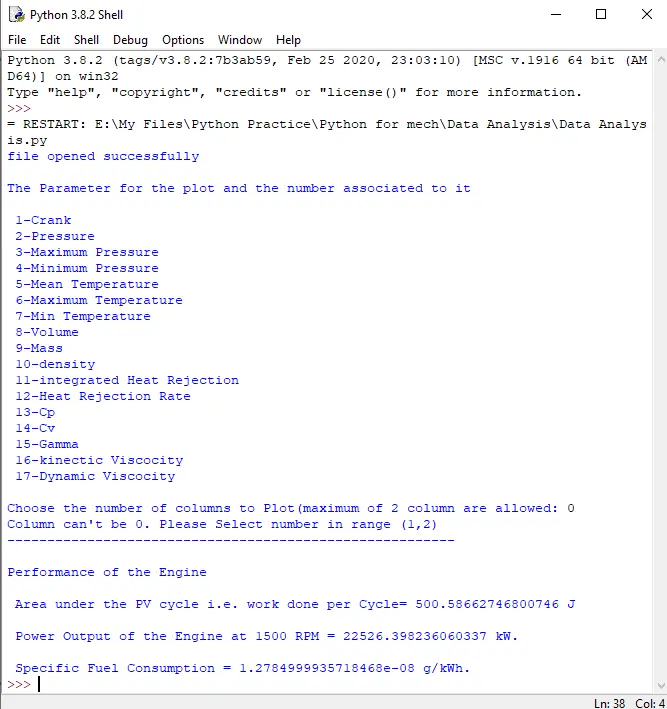
a) Initially if selected an option of ‘0’. The output is as follows.
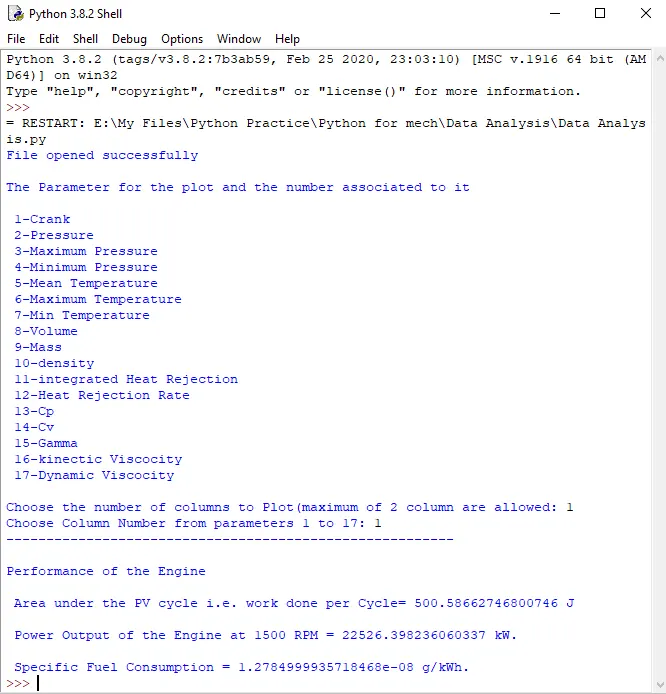
b) If selected the input of ‘1’. The output is as follows.
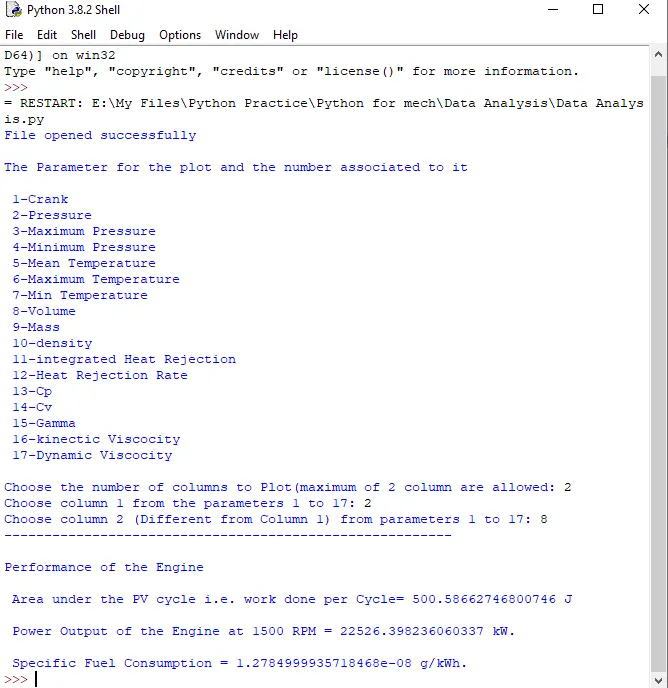
c) If an input is given as ‘2’. The output is as follows.
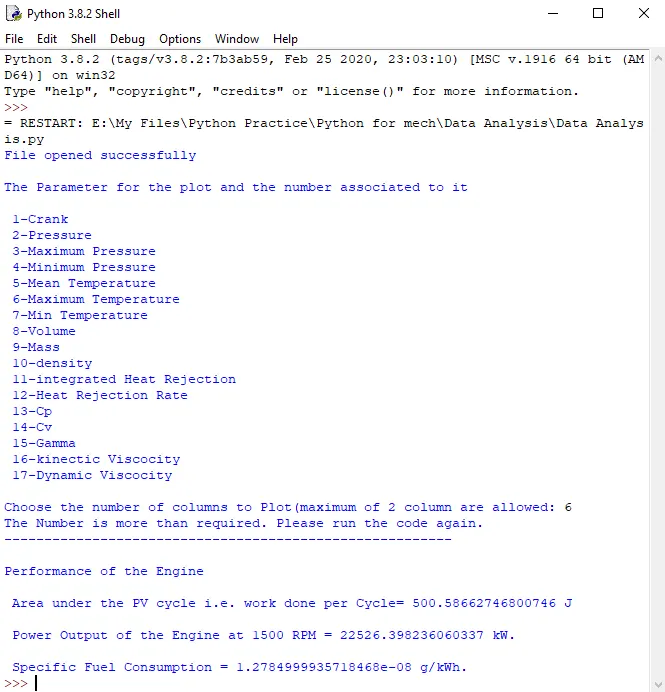
d) If the input is given as ‘3 or more ’. The output is as follows.
- The Output for the Performance of the Engine is given above.
- The graphs are shown below.
-
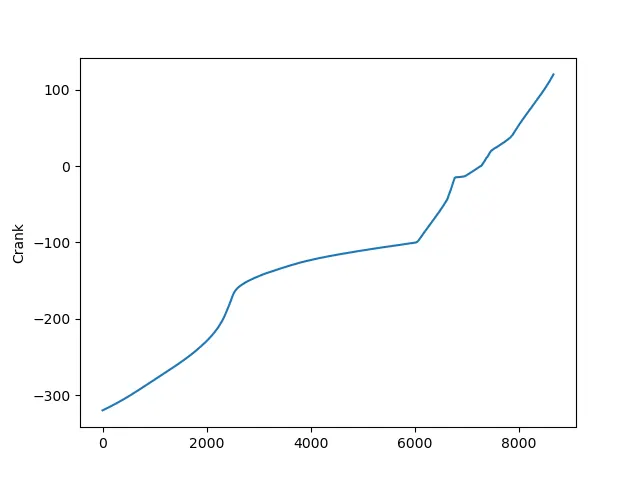
- Graph for the input given as ‘1’ column.
- Graph for the input given as ‘2’ columns.
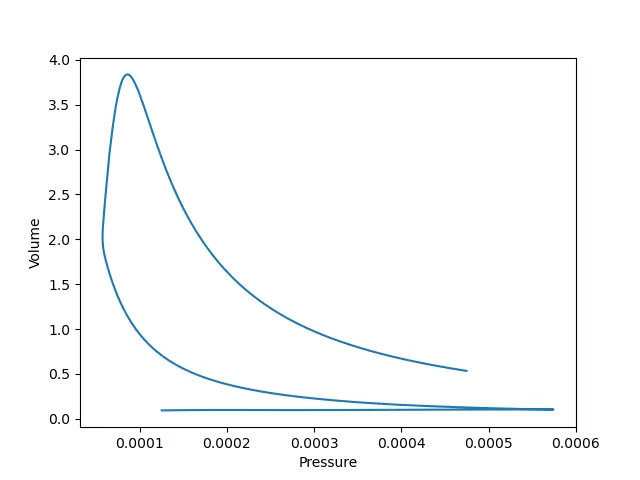
- Graph for the input given as ‘1’ column.
Errors and Resolving:
Initially, after writing the code while running it, when entered the same columns to check how the graph plots, the code is executed and generated output as below.
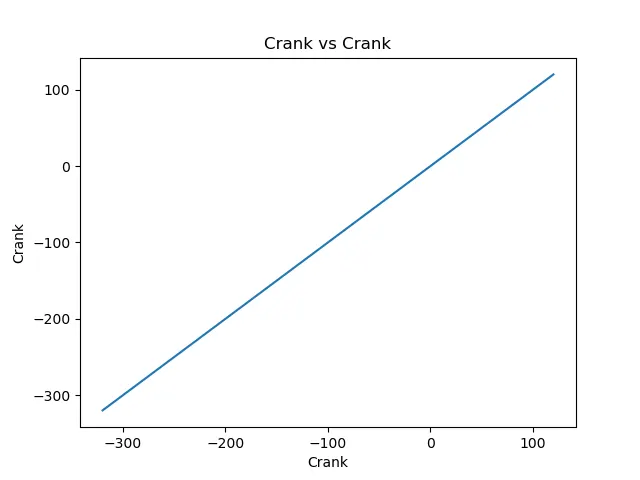
After the above code is executed and displayed the output. The idea is to stop the recurring element and to create different outputs for each value given. ‘While’ Loop is used to stop the recurring element. The code for that is shown below.
counter =1             #Assigning an Counter variable for the Loop to run
   Column = None          # Initially Assigning the Column variable as None
   while Column is None:

     input_value = input('Choose the number of column to be calculated(maximum of 2 column are allowed: ')
     try:
       Column = int(input_value)
     except:
       print("{input} is not a number, Please enter a number".format(input=input_value))
     else:
       break

   while Column <=2:
     if Column == 0:
       print("Column can't be 0. Please Select number in range (1,2)")
       break
     if Column == 1:
       column = input("Choose Column Number from parameters 1 to 17: ")
       column = int(column)
       break
     if Column ==2:
       column_1 = input('Choose column 1 from the parameters 1 to 17: ' )
       column_2 = input("Choose column 2 (Different from Column 1) from parameters 1 to 17: ")
       column_1= int(column_1)
       column_2= int(column_2)

       counter = counter -1

       if (column_1== column_2):
         print("numbers are same please choose a different number:")
         counter = counter +1
       else:
         break

   else:
     print("The Number is more than required. Please run the code again.")
The basic error occurred after writing and executing the code. The error showed the infinite loop occurred after giving the inputs. To overcome this issue, ‘break’ is used to terminate the loop.
After solving all the errors. The code is run successfully and can display the analysis of the different parameters.