Project 1 - Parsing NASA thermodynamic data
PARSING NASA THERMODYNAMIC DATA
AIM:
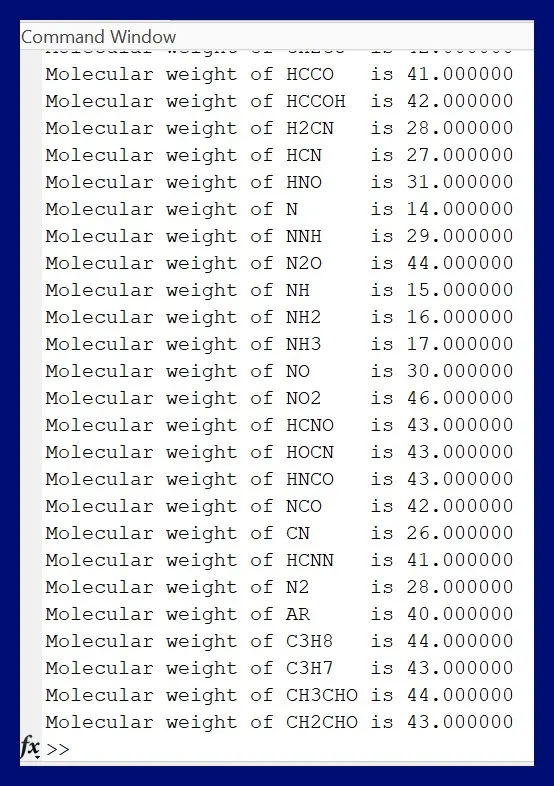
To write Matlab code for extraction of 14 coefficients from the NASA thermodynamic data file and to calculate the Entropy(S), Enthalpy(H), Specific Heat(Cp), and molecular weight of the species and to plot the graph for all species.
FILE PARSING:
File parsing is a technique to read the information from a particular text file and that information can be used in Matlab. Using this file parsing technique we can able to read the data from the external file and can process the data for calculation.
In this Project, we can use this technique to read data from the THERMO.dat file and use these values to calculate the Entropy, Enthalpy, Specific heat data.
FORMULAS:
`(Cp)/R=a1+a2 T+a3 T^2+a4T^3+a5 T^4`
`H/(RT)=a1+(a2T)/2+(a3T^2)/3+(a4T^3)/4+(a5T^4)/5+(a6)/T`
`S/R=a1lnT+a2T+(a3T^2)/2+(a4T^3)/3+(a5T^4)/4+a7`
MAIN CODE:
clear all
close all
clc

f1=fopen("THERMO.dat","r");

title=fgetl(f1);
temp=fgetl(f1);
global_temp=strsplit(temp,' ');

global_low_temp=str2num(global_temp{2});
global_mid_temp=str2num(global_temp{3});
global_high_temp=str2num(global_temp{4});

comment_1=fgetl(f1);
comment_2=fgetl(f1);
comment_3=fgetl(f1);


for i=1:53
    species=fgetl(f1);
    species_name=species(1:6);

    line1=fgetl(f1);
    line2=fgetl(f1);
    line3=fgetl(f1);

    e_1=findstr(line1,'E');
    e_2=findstr(line2,'E');
    e_3=findstr(line3,'E');

    %Extracting the High Temperature Values

    high_temp_coeff_1=line1(1:e_1(1)+3);
    a1=str2num(high_temp_coeff_1);

    high_temp_coeff_2=line1(e_1(1)+4:e_1(2)+3);
    a2=str2num(high_temp_coeff_2);

    high_temp_coeff_3=line1(e_1(2)+4:e_1(3)+3);
    a3=str2num(high_temp_coeff_3);

    high_temp_coeff_4=line1(e_1(3)+4:e_1(4)+3);
    a4=str2num(high_temp_coeff_4);

    high_temp_coeff_5=line1(e_1(4)+4:e_1(5)+3);
    a5=str2num(high_temp_coeff_5);

    high_temp_coeff_6=line2(1:e_2(1)+3);
    a6=str2num(high_temp_coeff_6);

    high_temp_coeff_7=line2(e_2(1)+4:e_2(2)+3);
    a7=str2num(high_temp_coeff_7);

    %Extracting the Low Temperature Values

    low_temp_coeff_1=line2(e_2(2)+4:e_2(3)+3);
    a8=str2num(low_temp_coeff_1);

    low_temp_coeff_2=line2(e_2(3)+4:e_2(4)+3);
    a9=str2num(low_temp_coeff_2);

    low_temp_coeff_3=line2(e_2(4)+4:e_2(5)+3);
    a10=str2num(low_temp_coeff_3);

    low_temp_coeff_4=line3(1:e_3(1)+3);
    a11=str2num(low_temp_coeff_4);

    low_temp_coeff_5=line3(e_3(1)+4:e_3(2)+3);
    a12=str2num(low_temp_coeff_5);

    low_temp_coeff_6=line3(e_3(2)+4:e_3(3)+3);
    a13=str2num(low_temp_coeff_6);

    low_temp_coeff_7=line3(e_3(3)+4:e_3(4)+3);
    a14=str2num(low_temp_coeff_7);

    mkdir(['E:\Skill-Lync\Mat lab challenge programs\NASA Thermo\Thermal properties\',species_name]);

    %calculating cp
    R=8.314;
    t=linspace(global_low_temp,global_high_temp,500);

    [cp,H,S]=thermalproperties(global_mid_temp,t,R,a1,a2,a3,a4,a5,a6,a7,a8,a9,a10,a11,a12,a13,a14);

      cd(['E:\Skill-Lync\Mat lab challenge programs\NASA Thermo\Thermal properties\',species_name]);

        figure(1)
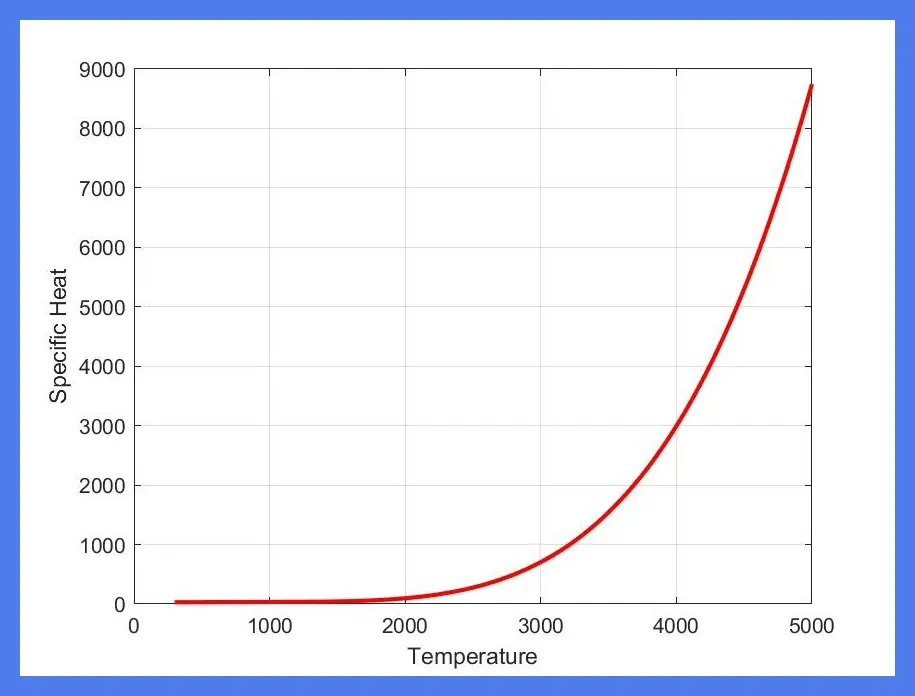
        plot(t,cp,'linewidth',2,'color','r')
        xlabel('Temperature')
        ylabel('Specific Heat')
        title('Temperature vs Specific Heat')
        grid on
        saveas(figure(1),'specific heat.jpg');

        figure(2)
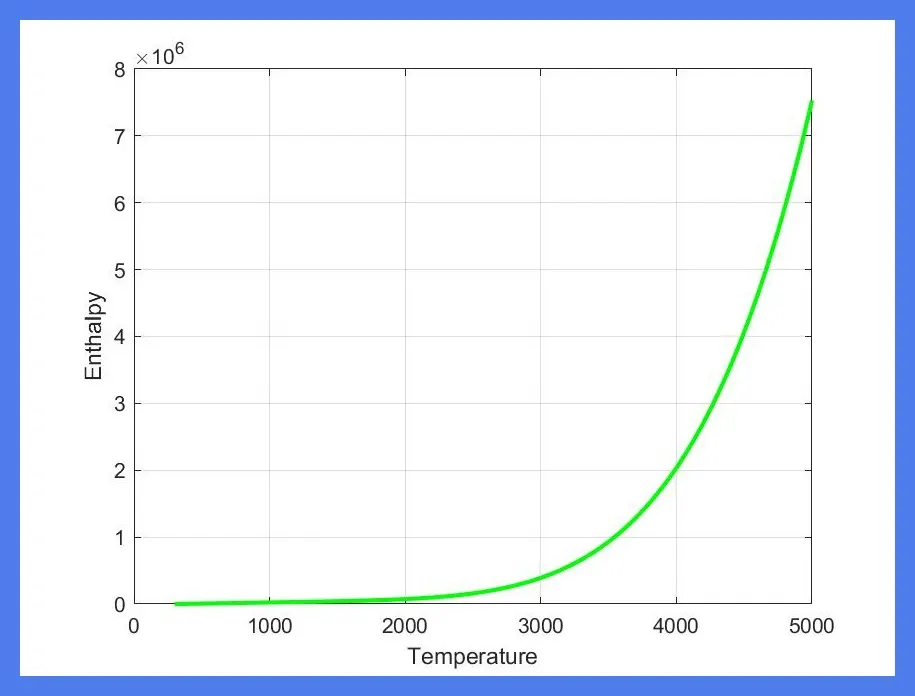
        plot(t,H,'linewidth',2,'color','g')
        xlabel('Temperature')
        ylabel('Enthalpy')
        grid on
        title(' Temperature vs Enthalpy ');
        saveas(figure(2),'Enthalpy.jpg');

        figure(3)
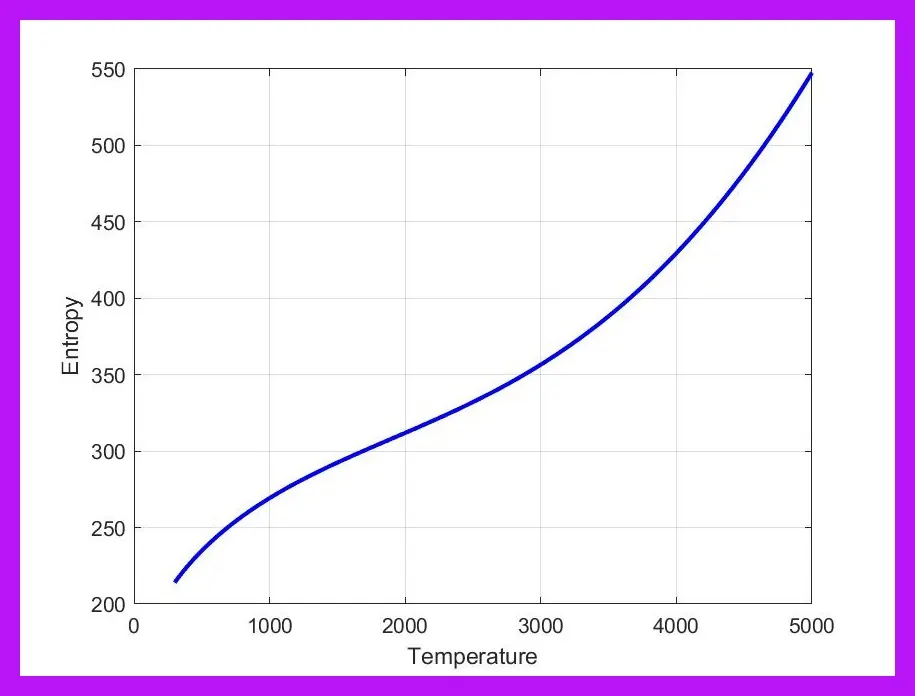
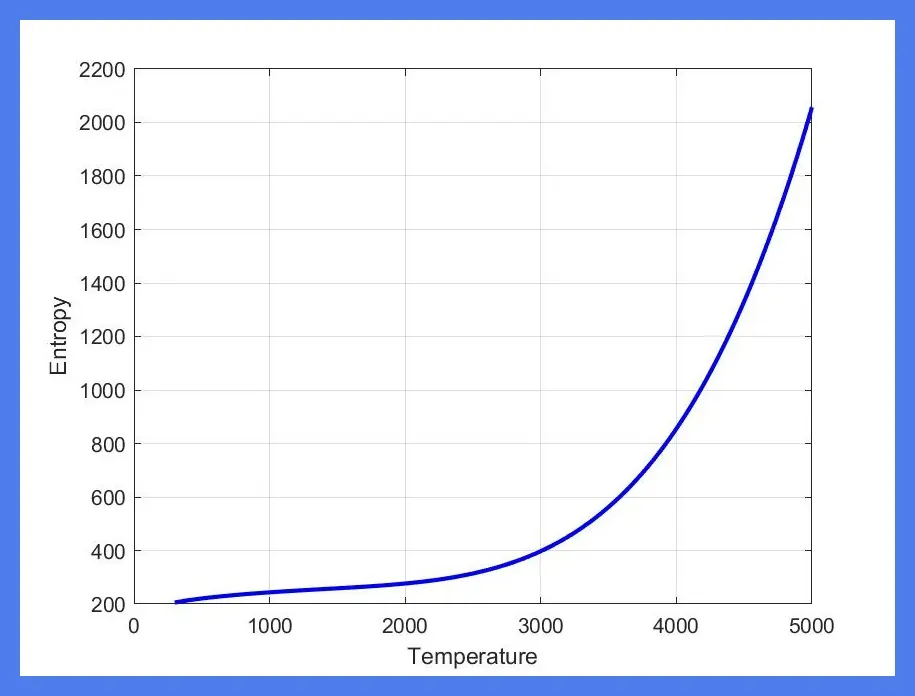
        plot(t,S,'linewidth',2,'color','b')
        xlabel('Temperature')
        ylabel('Entropy')
        grid on
        title(' Temperature vs Entropy ');
        saveas(figure(3),'Entropy.jpg');


       cd(['E:\Skill-Lync\Mat lab challenge programs\NASA Thermo\']);

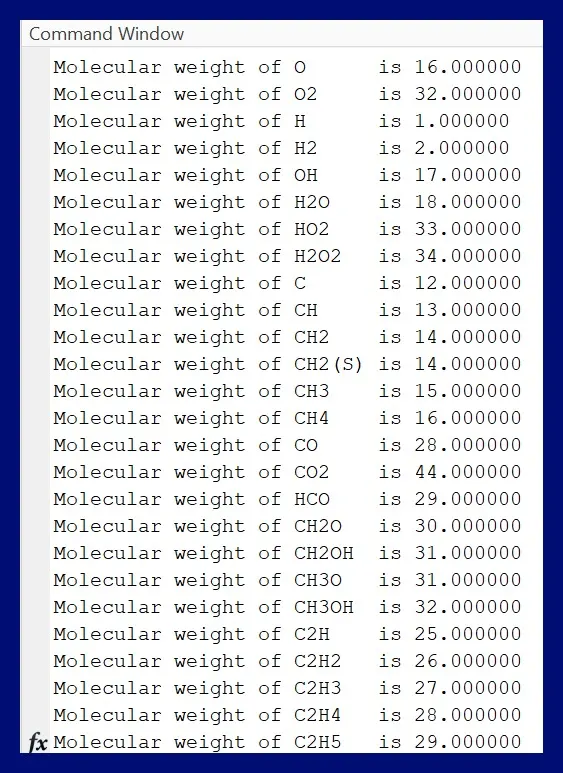
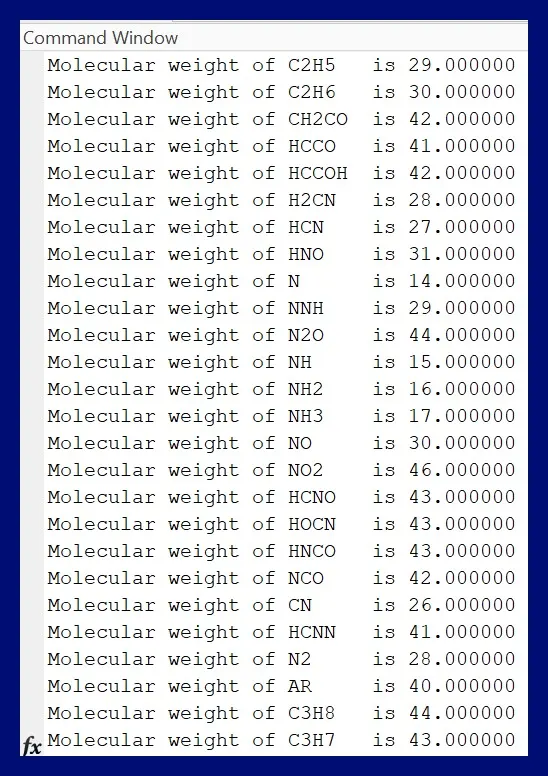
       M=molecular_weight(species_name);
       k=sprintf('Molecular weight of %s is %f',species_name,M);
       disp(k)


end
STEPWISE EXPLANATION:
- In the first step, the command window, Workspace window, and plot are all cleared by using the commands Clear all, Close all, and clc.
- The data in the thermodat file can be read by using the command fopen and it is stored in the f1 array.
- Using the fgetl command the lines can be read.
- In the first line, the title is mentioned and it is read by the fgetl command and so it was stored in the title array.
- In the second line, the temperature values are mentioned and it is read by the same fgetl command and it is stored in the temp array.
- Using the strsplit command the low, mid, and maximum temperature values are separated into different cells.
- The string is converted into numbers by using the str2num command and each low, mid and maximum value is stored separately in global low temp, global mid temp, and global high temp.
- The next lines in the thermo.dat file are comment line and usually, these comment lines are mentioned in the form of(! mark). Generally, these lines have no importance and it can be skipped.
- Using the same fgetl command the comment lines are also read and it is stored separately.
- From this step, the below procedure is the same for all the 53 species. So in order to run for the 53 species, the for loop command is used.
- Then using the fgetl command species name can be read and only up to six columns the species name was mentioned and hence it was mentioned as {1:6}.
- There are 14 values in each species and in the 14 values the first 7 values are high-temperature coefficients and the next 7 values are low-temperature coefficients.
- To separate each value the method which I preferred was to find the Position of the string 'E' by using the command find str in the three lines of the first species.
- After finding the position of the 'E' it is easy to separate the value because in every value it is clear that after "E" there will be only three values so it is easy to store separately from the initial position to the final position (after 3 places of E).
- The Initial position for the second value is the final position of the initial value in that way all the values are stored separately as high temp coeff 1, high temp coeff 2..etc in the code.
- Then the values are converted into the numbers by using the command str2num and it is stored as a1,a2,a3...etc.
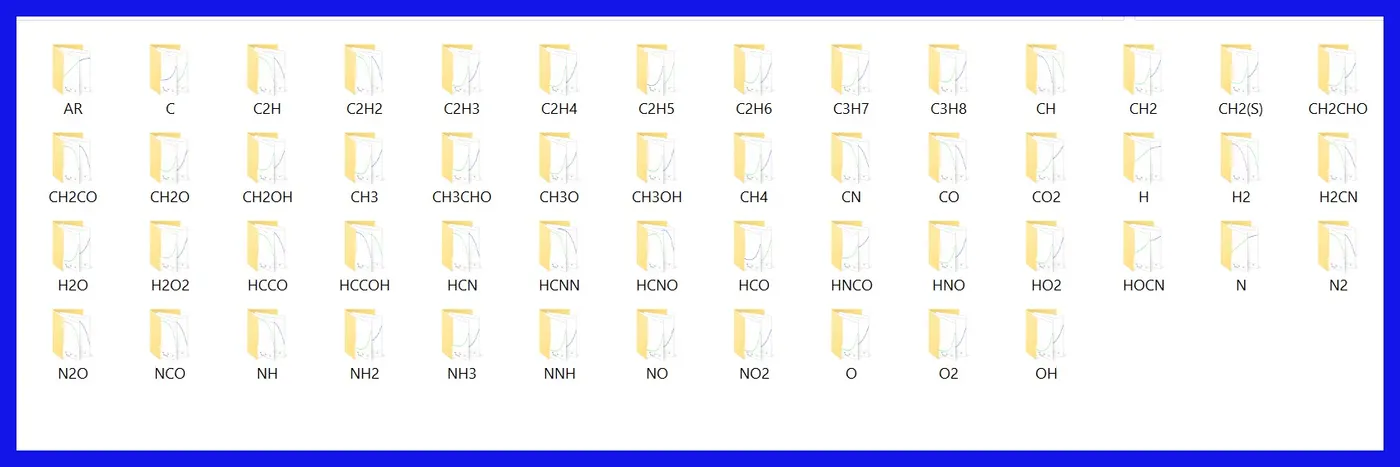
- Then the new folder was created by using the command mkdir and in that the path was mentioned.
- Then the Universal gas constant (R) value was assigned and using the linspace command the random temperature values are generated by assigning the initial and final temperature values and the number of values we need.
- Then the function to calculate specific heat, enthalpy, and entropy was called in the main program. The function code explanation can be checked below for reference.
- Using the cd command the current folder location can be changed.
- To save the plots in the new folder which we generated above, we need to enter it into that folder. so to change the current folder location we use the cd command.
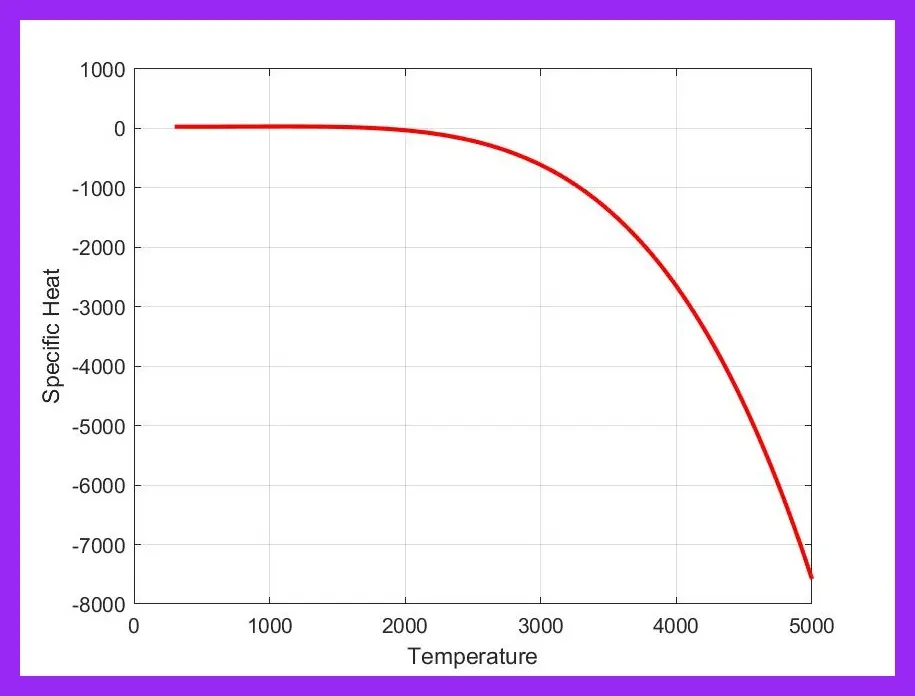
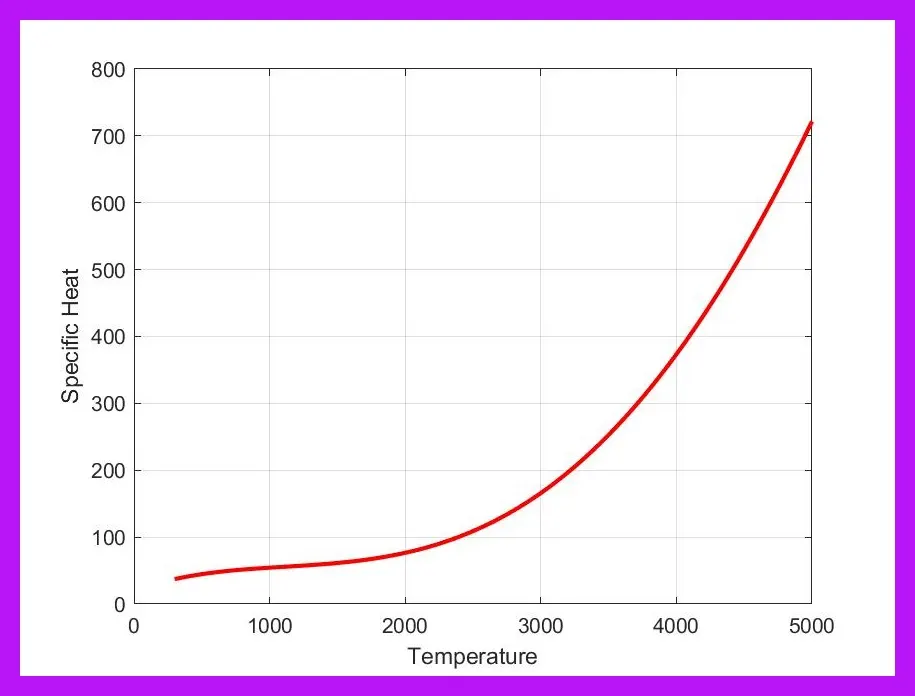
- In the first plot, the graph was created for Temperature vs Specific Heat, and for that plot x label,y label, and the title was mentioned and using the saveas option the plot was saved in the format .jpg as you can type the format in the saveas command.
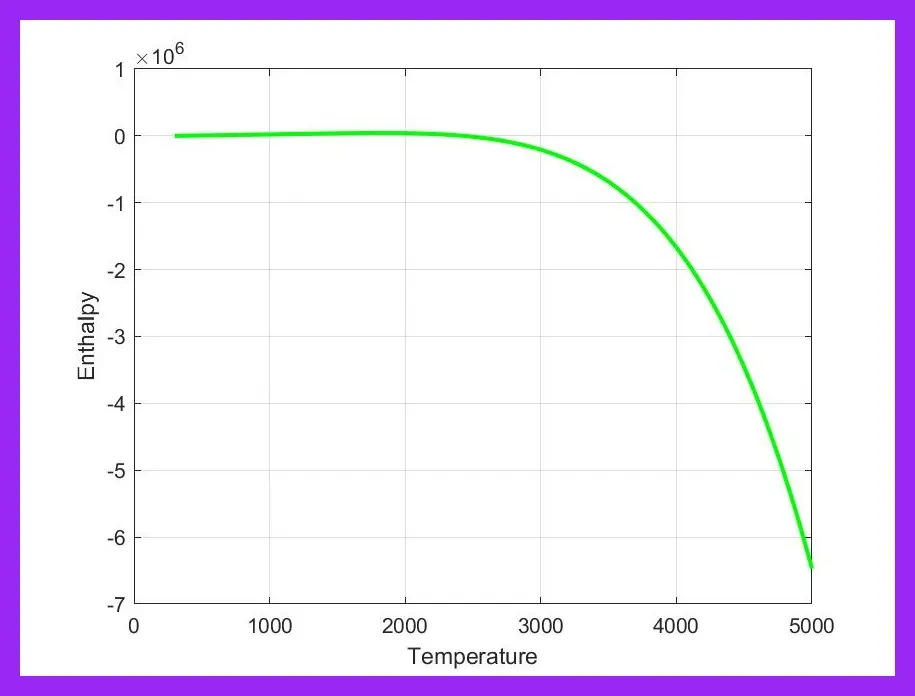
- In the second plot, the graph was created for Temperature vs Enthalpy, and similarly for the plot this plot also the x label, y label, and the title was mentioned and the using the saveas command this plot also saved in the required image type.
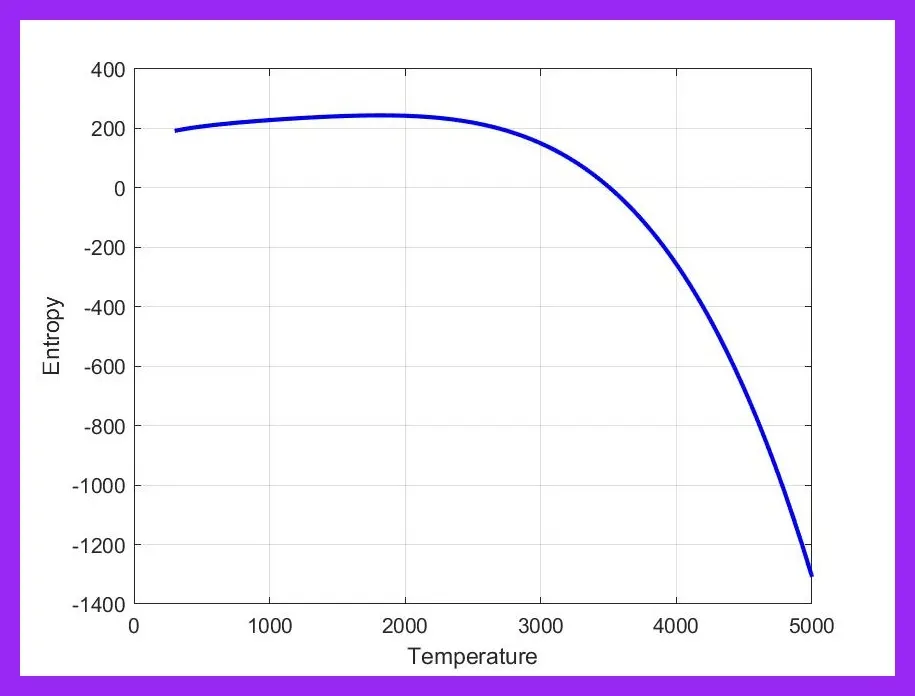
- Similarly, the third plot was generated for Temperature vs Entropy, and for this also the labels are mentioned and it was saved in the required format.
- Then using the cd command the file location can be changed into an existing program path.
- Then the molecular weight function was called in the main program.
- In the next line, using the sprintf command the molecular weight of the species is defined.since it is a floating value %f command is used,
- Then using the disp command the molecular weight of each species was displayed in the command window.
- Up to this the for loop command is used.
- After the program runs for 53 times it was ended by using the end command.
FUNCTION CODES:
function [cp,H,S]=thermalproperties(global_mid_temp,t,R,a1,a2,a3,a4,a5,a6,a7,a8,a9,a10,a11,a12,a13,a14)


for j=1:500 %j=global_low_temp:global_high_temp

        if t>=global_mid_temp
            [cp]=(a1+a2.*t+a3.*t.^2+a4.*t.^3+a5.*t.^4)*R;
            [H]=(a1+((a2.*t)/2)+((a3.*(t).^2)/3)+((a4.*(t).^3)/4)+((a5.*(t).^4)/5)+(a6./t)).*R.*t;
            [S]=(a1.*log(t)+(a2.*t)+((a3.*(t).^2)/2)+((a4.*(t).^3)/3)+((a5.*(t).^4)/4)+a7).*R;

        else
            [cp]=(a8+a9*t+a10.*t.^2+a11.*t.^3+a12.*t.^4)*R;
            [H]=(a8+((a9.*t)/2)+((a10.*(t).^2)/3)+((a11.*(t).^3)/4)+((a12.*(t).^4)/5)+(a13./t)).*R.*t;
            [S]=(a8.*log(t)+(a9.*t)+((a10.*(t).^2)/2)+((a11.*(t).^3)/3)+((a12.*(t).^4)/4)+a14).*R;

        end
end
STEPWISE EXPLANATION:
- Using the function command the calculation for specific heat, Enthalpy and entropy are mentioned and in the function code the coefficients which are used in the calculation are mentioned and it must be saved in the same function name.
- In the main program, the temperature values are assigned to have 500 values. so, in the initial step for loop is assigned in order to run the program 500 times.
- In the main program, it was mentioned that the 14 temperature coefficient values in the species are gets split into the first 7 are high-temperature values and the next 7 values are low-temperature values.
- In the next step, if command is used. If the temperature value is greater than the mid-temperature value ie., the high-temperature coefficients, the below calculation needs to be done and else command is used if the temperature value is less than the mid-temperature value ie., the low-temperature coefficients, the separate calculation needs to be done and it is mentioned.
- Using the formulas mentioned above the values of Specific heat, Enthalpy, and Entropy are calculated.
- After this, the program was ended by using the end command.
MOLECULAR WEIGHT CALCULATION CODE:
function M=molecular_weight(species_name)
elements=['H','C','N','O','A'];
Atomic_weight=[1,12,14,16,40];
M=0;
for i=1:length(species_name)
    for j=1:length(elements)
        if strcmp(species_name(i),elements(j))
            M=M+Atomic_weight(j);
            x=j;
        end
    end

    n=str2num(species_name(i));
    if n>1
        M=M+(Atomic_weight(x)*(n-1));
    end
end
STEPWISE EXPLANATION:
- In the first step the function was called and it was saved in the same name as mentioned in the function.
- Then in the 53 species, the common elements found out and it as follows H, C, N, O, A, and it was stored in the elements array.
- Then the atomic weight for the above elements is mentioned and it was stored in the atomic weight array.
- Initially, the value of M array is set as 0.
- Then for loop is assigned for the length of the species name and inside the loop, another for loop is assigned for the length of the elements.
- Then in the next step string comparison is done for the species and elements by using the command strcmp.
- If the species name and the elements are the same then the molecular weight can be calculated as M +Atomic weight of elements.
- Then if the string comparison fails then it must be number only.
- So the string must be converted into number by using the command str2num.
- Then in the next step if command is used. if the n value is greater than one then the molecular weight can be calculated by M+(Atomic weight of x*(n-1)).
- Then the function is ended by using the end command.
MOLECULAR WEIGHT:
PLOTS FOR O2:
1)TEMPERATURE VS SPECIFIC HEAT:
2)TEMPERATURE VS ENTHALPY:
3)TEMPERATURE VS ENTROPY:
PLOTS FOR N2:
1)TEMPERATURE VS SPECIFIC HEAT:
2)TEMPERATURE VS ENTHALPY:
3)TEMPERATURE VS ENTROPY:
PLOTS FOR CO2:
1)TEMPERATURE VS SPECIFIC HEAT:
2)TEMPERATURE VS ENTHALPY:
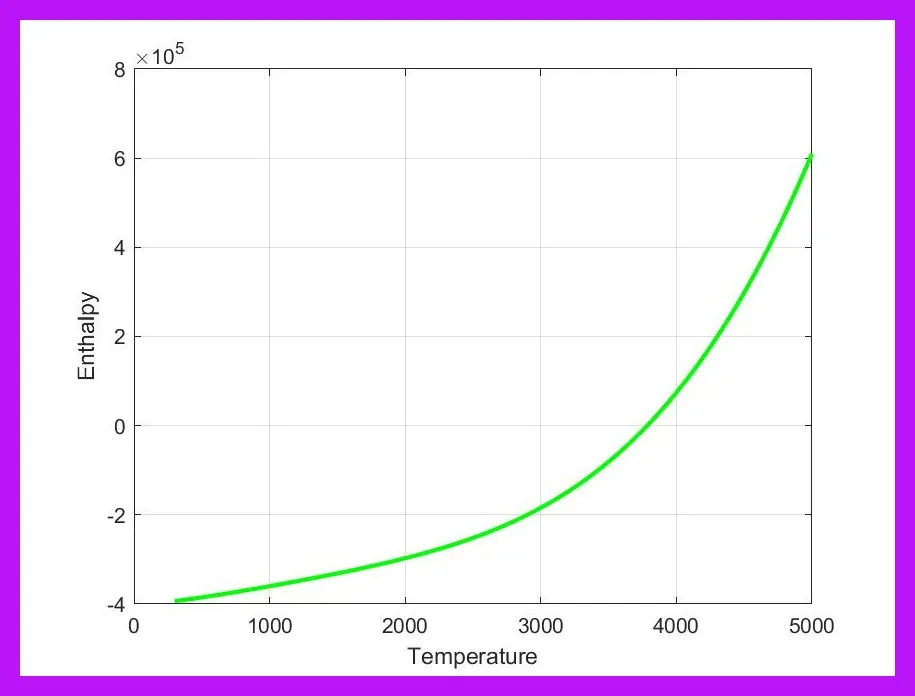
3)TEMPERATURE VS ENTROPY: