Project 1 - Parsing NASA thermodynamic data
PARSING NASA THERMODYNAMIC DATA
- OBJECTIVES
1. Write a function that extracts the 14 co-efficients and calculates the enthalpy, entropy and specific heats for all the species in the data file.
Here R is the universal gas constant, T is the temeprature
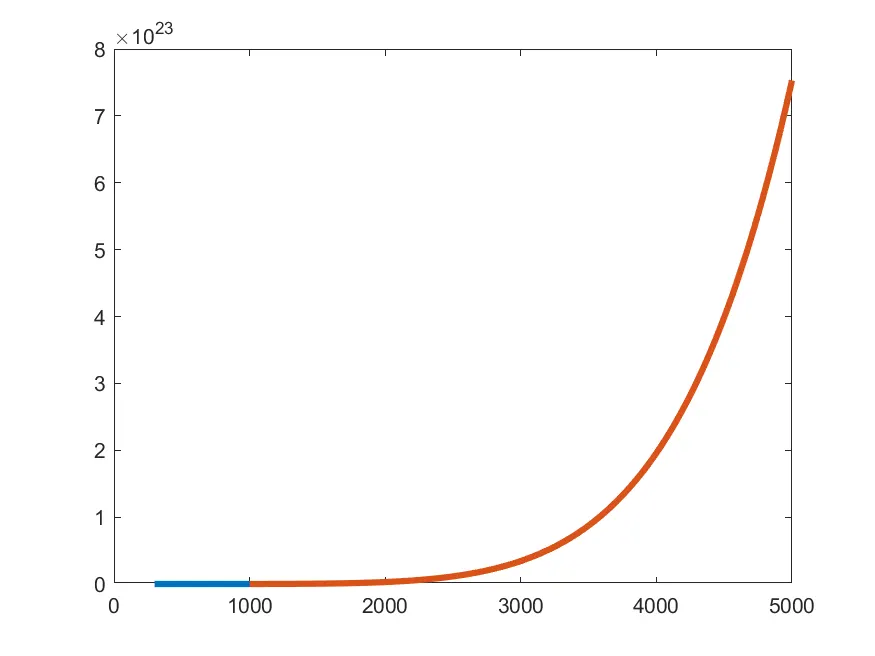
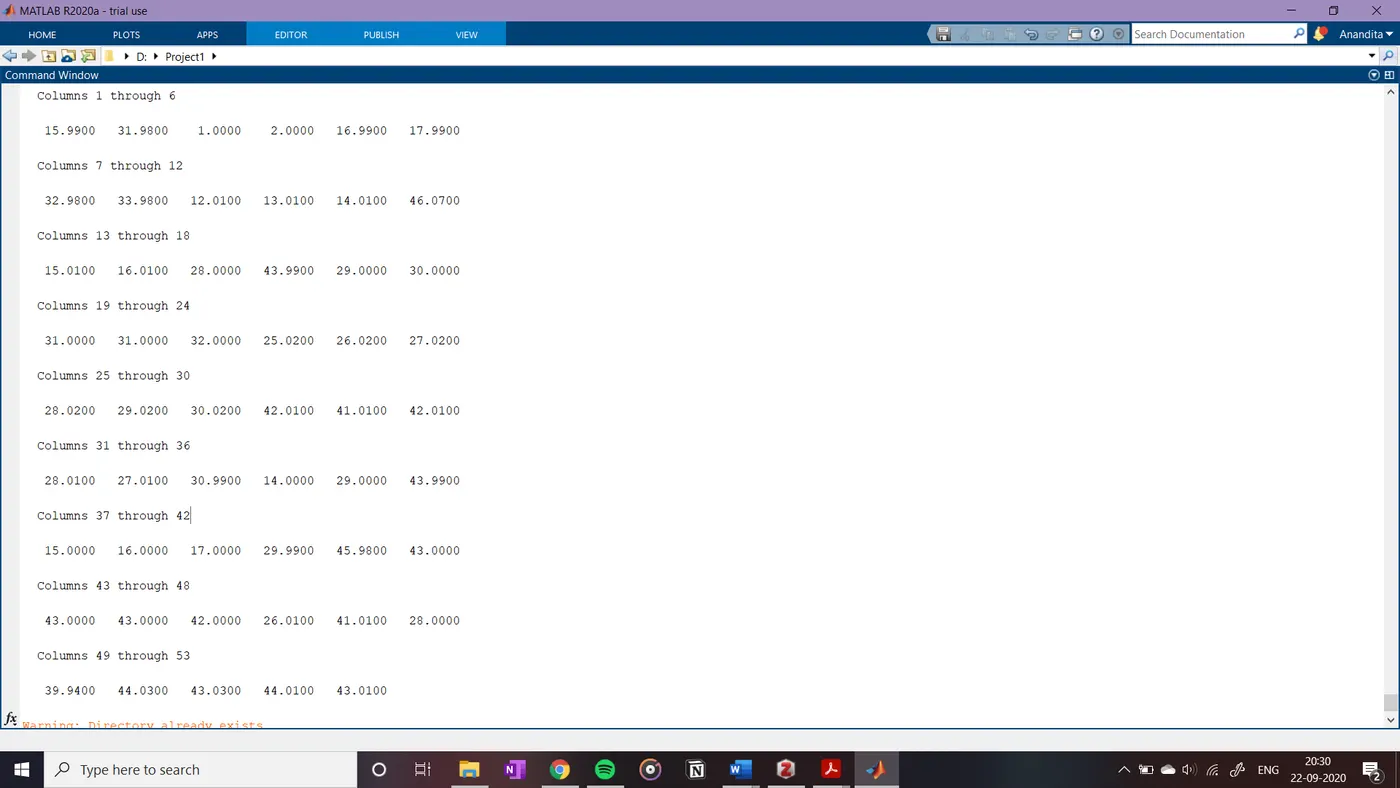
2. Calculate the molecular weight of each species and display it in the command window.3. Plot the Cp, Enthalpy and Entropy for the local temperature range (low temperature : high temperature) specific for each species.
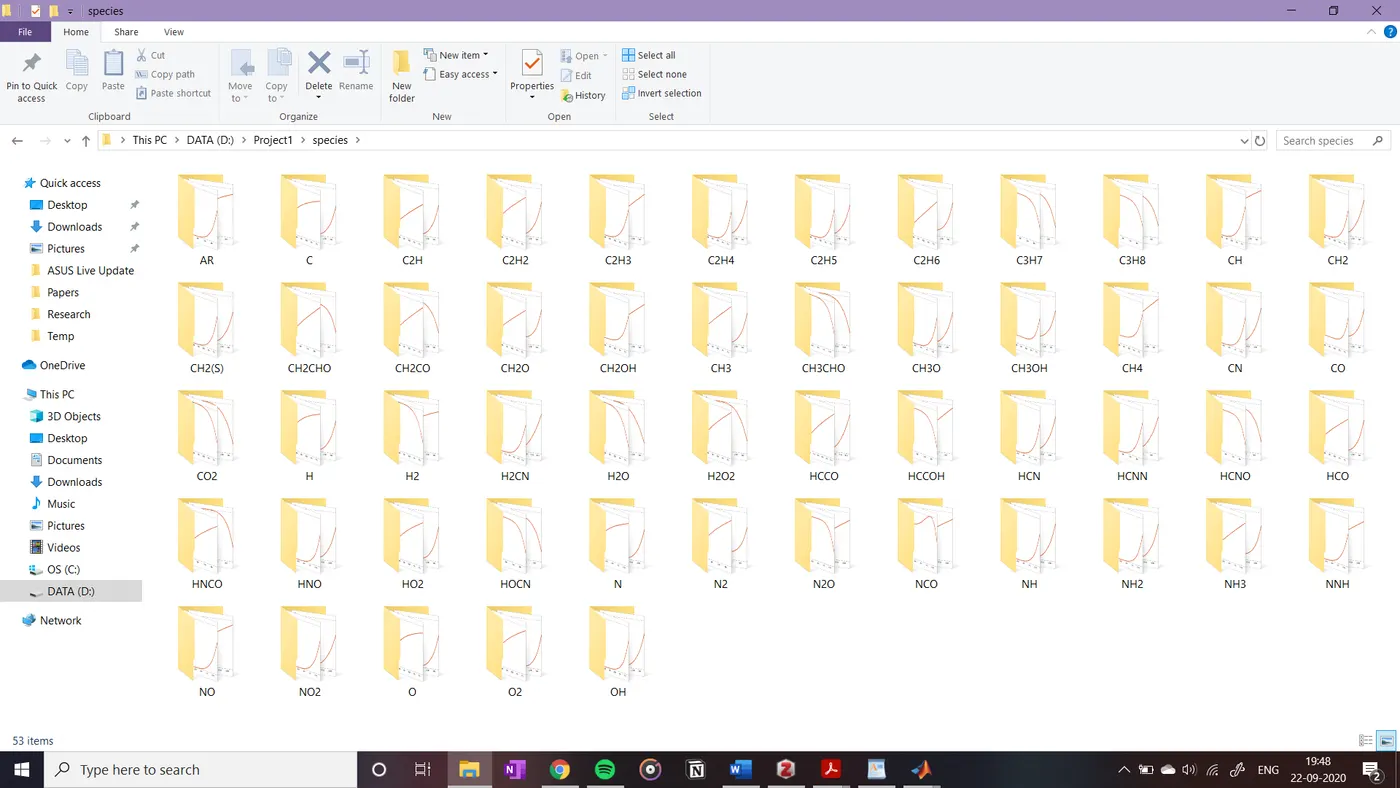
3. Save the plots as images with appropriate names and dump them in separate folders for each species with suitable name. All these should be generated automatically.
- MATLAB Code
MAIN PROGRAM
clear all
close all
clc

R = 8.31490;

%To ready the THERMO.dat file
f1 = fopen('THERMO.dat','r');
fgetl(f1)
tempL = str2num(fgetl(f1));

% global_low_temperature = tempL(1)
% global_mid_temperature = tempL(2)
% global_high_temperature = tempL(3)
%for skipping the unwanted lines

for i = 1:3
    fgetl(f1);
end


for y=1:53
%for reading local temperatures
line0 = fgetl(f1);
a = strfind(line0,'.');
tlin0= strtok(line0);
lt1 = line0(52-3:a(1)+3);
lt2 = line0(a(1)+4:62+3);
lt3 = line0(a(2)+4:72+3);
Local_Temp_low = str2num(lt1);
Local_Temp_high = str2num(lt2);
Local_Temp_mid = str2num(lt3);
%To read the lines for coefficient %Reading the first line of Coefficient
linel = fgetl(f1);
b = findstr(linel,'E');
a1 = str2num(linel(1:b(1)+3));
a2 = str2num(linel(b(1)+4:b(2)+3));
a3 = str2num(linel(b(2)+4:b(3)+3));
a4 = str2num(linel(b(3)+4:b(4)+3));
a5 = str2num(linel(b(4)+4:b(5)+3));

%reading the second line of coefficient
line2 = fgetl(f1);
c = findstr(line2,'E');
a6 = str2num(line2(1:c(1)+3));
a7 = str2num(line2(c(1)+4:c(2)+3));
a8 = str2num(line2(c(2)+4:c(3)+3));
a9 = str2num(line2(c(3)+4:c(4)+3));
a10= str2num(line2(c(4)+4:c(5)+3));

%Reading the third line of coefficient

line3 = fgetl(f1);
d = findstr(line3,'E');
a11 = str2num(line3(1:d(1)+3));
a12 = str2num(line3(d(1)+4:d(2)+3));
a13 = str2num(line3(d(2)+4:d(3)+3));
a14 = str2num(line3(d(3)+4:d(4)+3));

Lower_Temp = linspace(Local_Temp_low,Local_Temp_mid,100);
Higher_Temp = linspace(Local_Temp_mid,Local_Temp_high,100);
%Cp of the given data
Cp_High = (a1 + a2*Higher_Temp + a3*Higher_Temp.^2 + a4*Higher_Temp.^3 + a5*Higher_Temp.^4 + a6*Higher_Temp.^5 + a7*Higher_Temp.^6 )*R ;
Cp_Low = (a8 + a9*Lower_Temp + a10*Lower_Temp.^2 + a11*Lower_Temp.^3 + a12*Lower_Temp.^4 + a13*Lower_Temp.^5 + a14*Lower_Temp.^6)*R ;
%Enthalphy of the given data
H_High = (a1 + a2 * (Higher_Temp/2) + a3 * ((Higher_Temp).^2)/3 + a4 * ((Higher_Temp).^3)/4 + a5 * ((Higher_Temp).^4)/5 + a6 *((Higher_Temp).^5)/6 + a7 * ((Higher_Temp).^6)/7)*R.*Higher_Temp;
H_Low = (a8 + a9 * (Lower_Temp/2) + a10 * ((Lower_Temp).^2)/3 + a11 * ((Lower_Temp).^3)/4 + a12 * ((Lower_Temp).^4)/5 + a13 * ((Lower_Temp).^5)/6 + a14 * ((Lower_Temp).^6)/7)*R.*Lower_Temp;
%Entrophy Calculation for the given data
S_High = (a1*log(Higher_Temp) + a2*Higher_Temp + (a3*Higher_Temp)/2 + (a4*Higher_Temp)/3 + (a5*Higher_Temp)/4 + a7)*R;
S_Low = (a8*log(Lower_Temp) + a9*Lower_Temp + (a10*Lower_Temp)/2 + (a11*Lower_Temp)/3 + (a12*Lower_Temp)/4 + a14)*R;

MolW(y) = molecular_weight(tlin0)
cd('D:/Project1/species')
mkdir(tlin0)
cd(tlin0)

figure(1)
plot(Lower_Temp,Cp_Low,'linewidth',3)
hold on
plot(Higher_Temp,Cp_High,'linewidth',3)
hold off
saveas(gcf,'file1.png')
figure(2)
plot(Lower_Temp,H_Low,'linewidth',3 )
hold on
plot(Higher_Temp,H_High,'linewidth',3)
hold off
saveas(gcf,'file2.png')

figure(3)
plot(Lower_Temp,S_Low,'linewidth',3)
hold on
plot(Higher_Temp,S_High,'linewidth',3)
hold off
saveas(gcf,'file3.png')
cd('D:/Project1')


end
EXPLAINATION OF CODE
- Open and read the ‘THERMO.dat’ file using fopen command and store data in f1.
- Skip unnecessary lines using fgetl command and saving needed lines in tempL.
- Skip first 3 lines using fgetl command in a FOR loop
- To collect data of 53 elements in the file, start a FOR loop .
- Findstr command is used to finding the numbers and the local temperature is saved in line0.
- Get the required temperature data by using logical operators and str2num command to change strings into numbers.
- We use the same reasoning to find all the coefficients from a1 to a14
- Differentiate the high and low temperatures using linspace command
- Using the given formulas and applying the valid arthemtic operation to get the required output
- Create a new folder using mkdir command and change directories with cd command
- Plot the data using plot command using hold on and off to not open many windows.
- Use saveas command to save the figures in png format
2. FUNCTION TO CALCULATE MOLECULAR MASS
function MW = molecular_weight(line0)

elements = ['H','C','O','N','A','S'];
atomic_wt = [1.00 12.01 15.99 14.00 39.94 32.06];
MW = 0;

for i = 1:length(line0)
    for j = 1:length(elements)
        if strcmp(line0(i),elements(j))
            MW = MW + atomic_wt(j);
            a = j;
        end
    end
    n = str2num(line0(i));

    if n>1
        MW=MW+atomic_wt(a)*(n-1);
    end

end
EXPLAINATION OF CODE
- We create a function molecular_weight function MW and assign tlin0 input to it.
- We define elements and atomic weight in arrays elements and atomic_weight..
- We create a FOR Loop which runs till length of line0 and nested loop which runs till lenth of elements.
- We create a IF condition and strcmp command to compare the species and calculate the molecular masses by comparison.
- We apply another IF condition to find if the species has more than one element and if yes then increment in the molecular mass calculation.
3. OUTPUTS
- PLOTS
a. O2
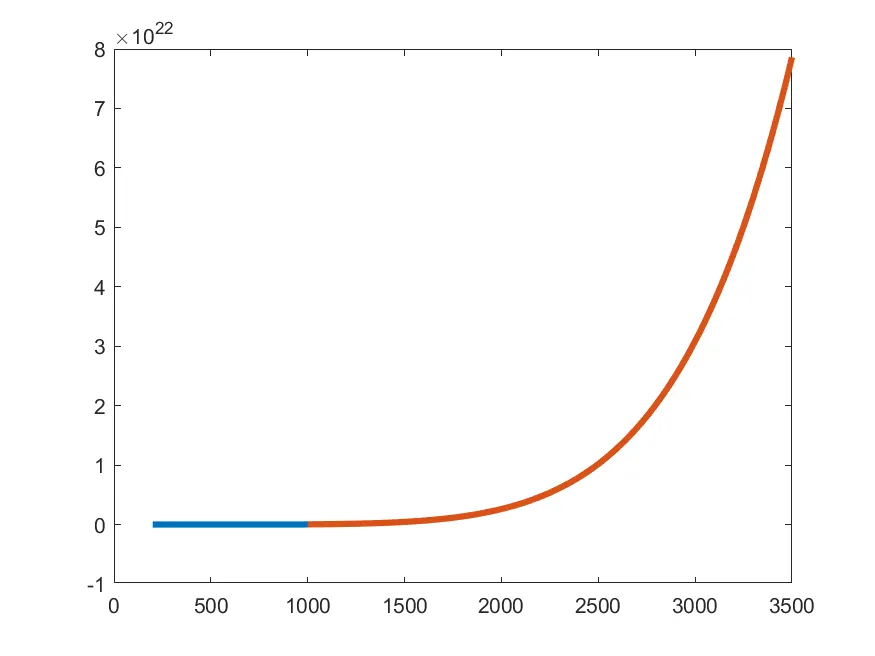
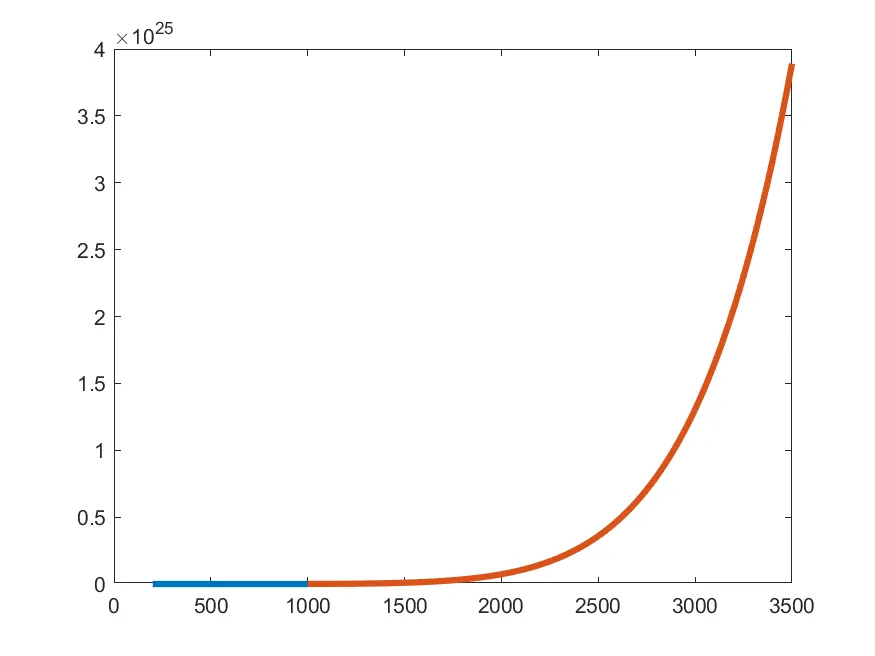
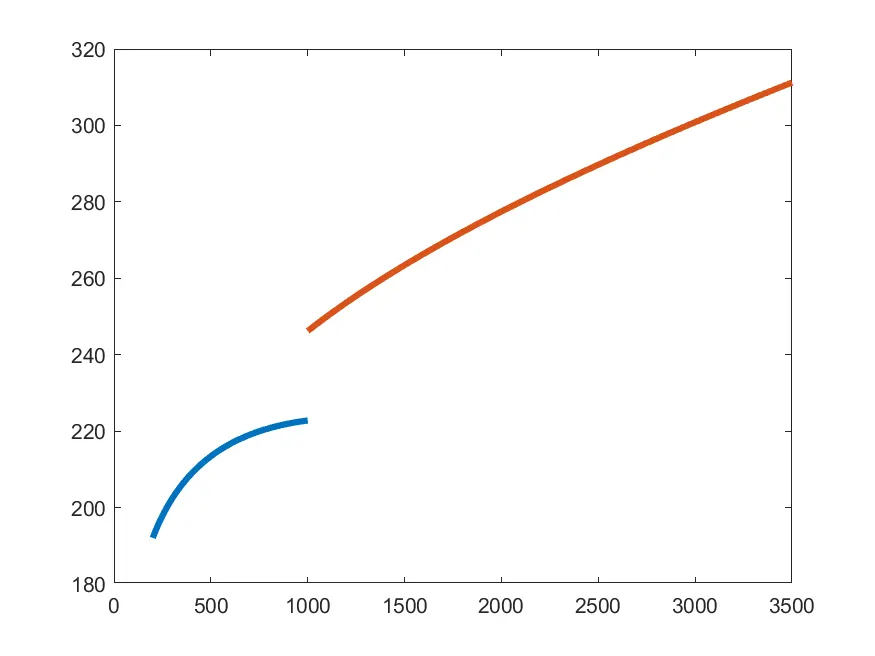
b. N2
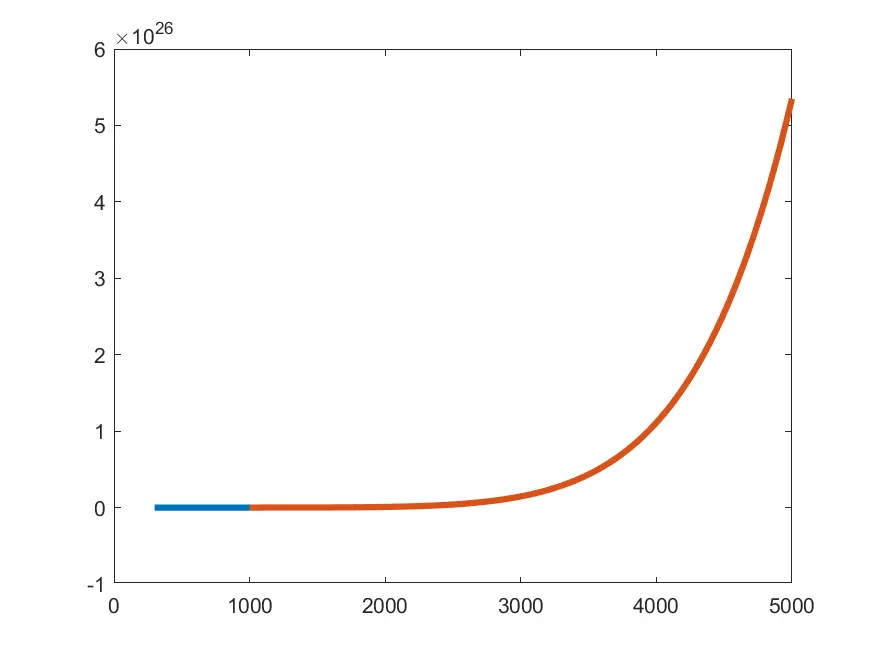
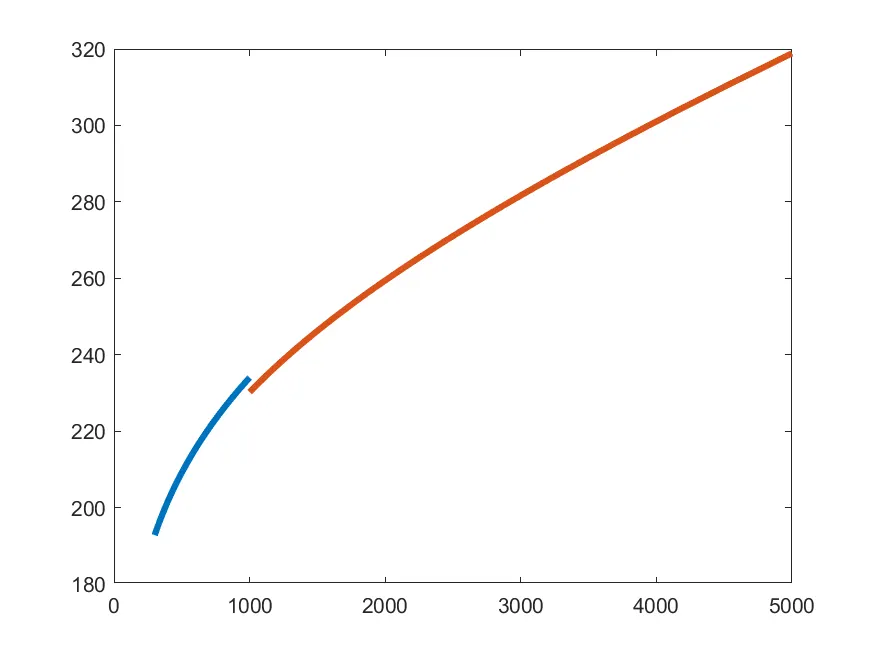
c. CO2
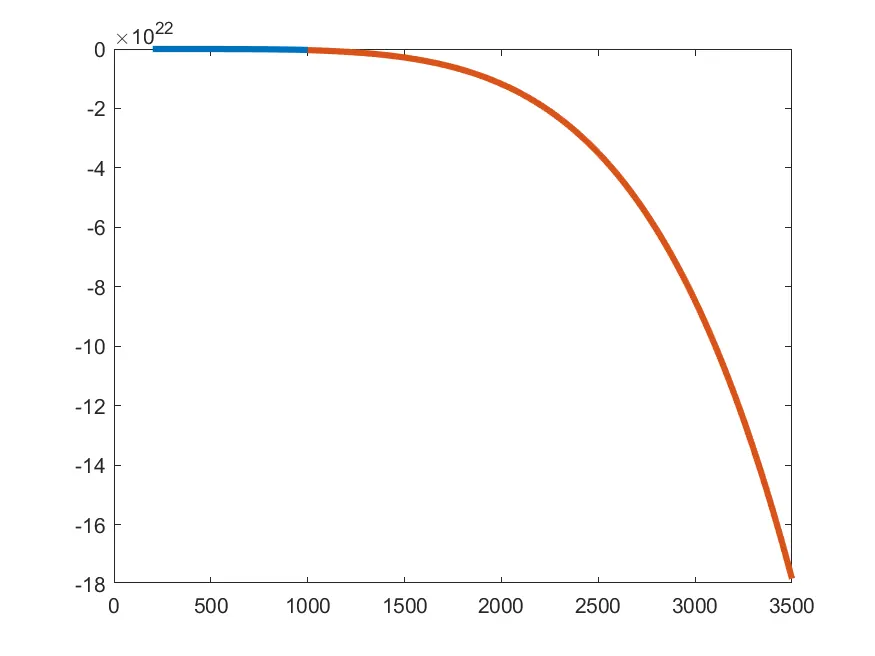
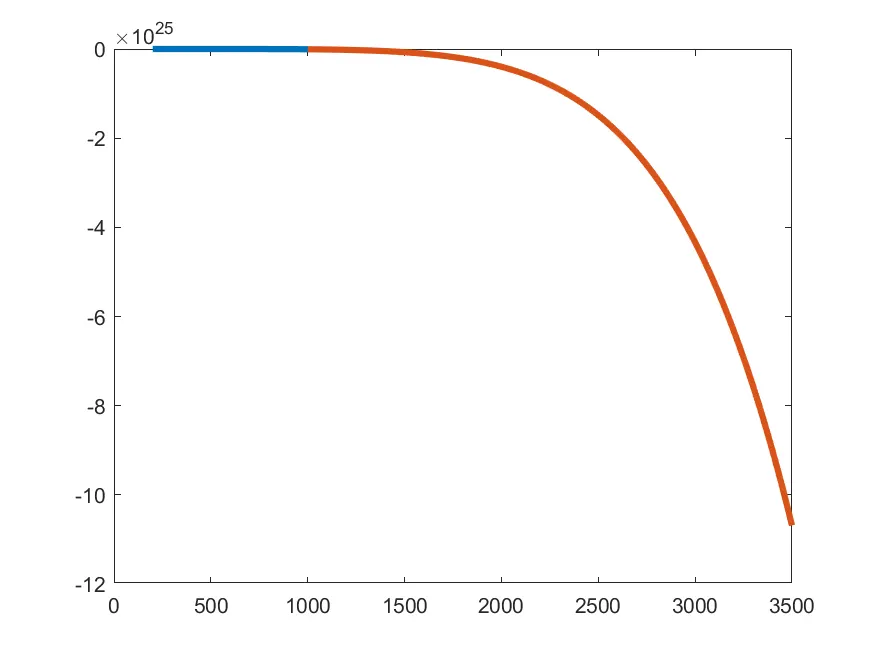
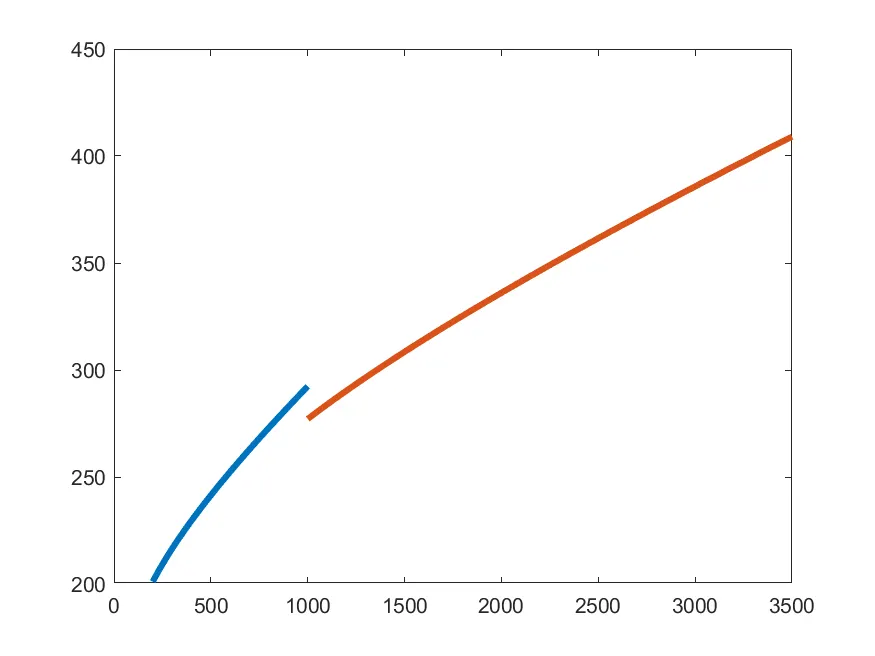
- FOLDER LOCATION
- COMMAND WINDOW DISPLAY
Google Drive LINK :
https://drive.google.com/drive/folders/1PXNrSC-KQDJ96zFnnAUSOdOt8OuqPLO3?usp=sharing