Parsing NASA thermodynamic data
AIM:
To write a code in MATLAB to parse nasa thermodynamics data
Programming language used is
MATLAB
The main objectives of the project are
1.) To extract 14 coefficients of each species and calculate the entropy, enthalpy and specific heat from the file given.
2.) To show the variation of these parameters against the corresponding temperature.
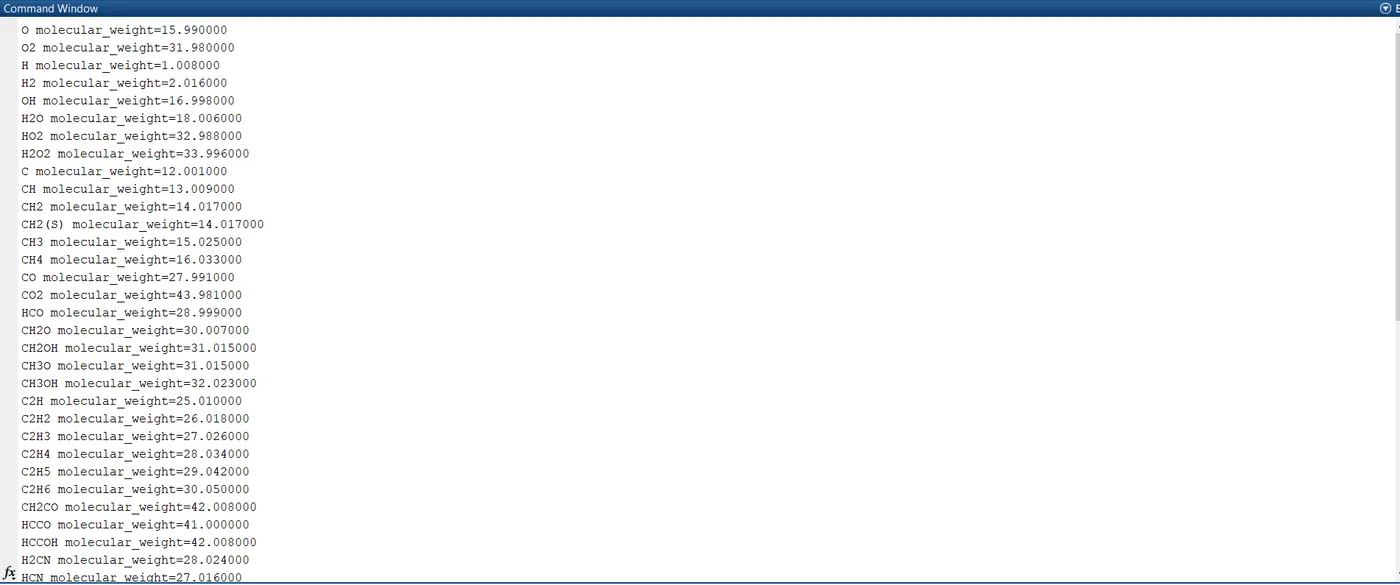
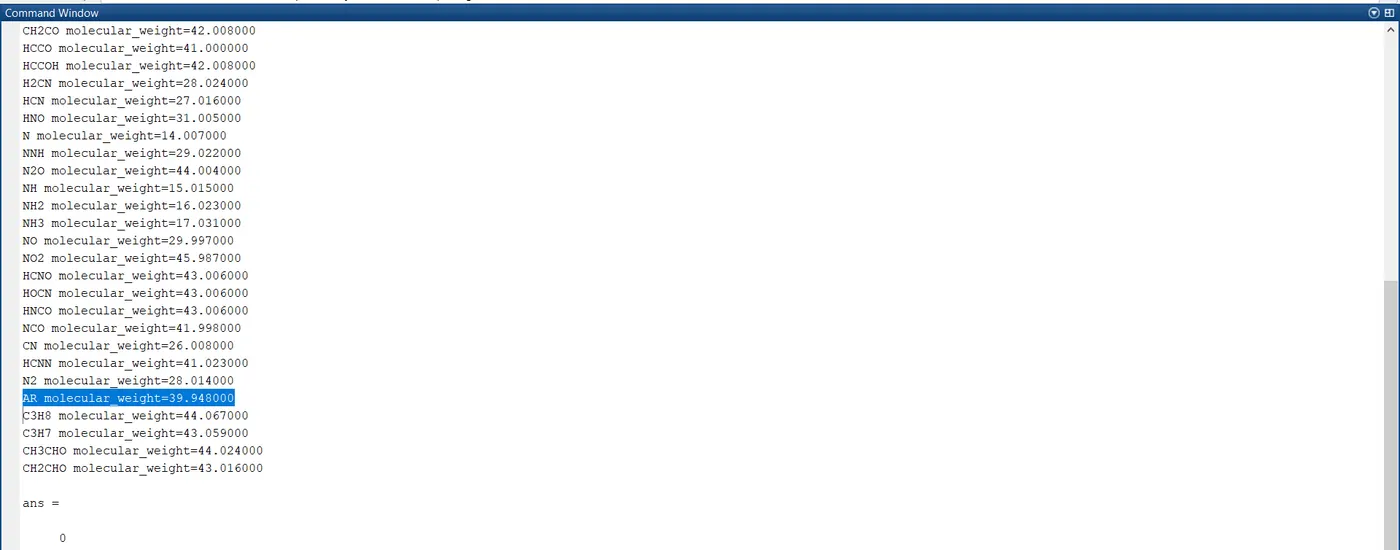
3.)To calculate the molecular weight of individual species.
namic data file and then calculate thermodyn
Theory:
File parsing:
-The definition for prase is to split the file or other input into pieces or data which can be easily stored or manipulated.Here we will be splitting string into parts then recoganise the parts to convert it into something simpler than string.
-Here we extract the data from the given thermodynamic data file and will calculate the enthalpy,entropy and specific heat for all the species in data file.Also we calculate the molecular weight of each species.
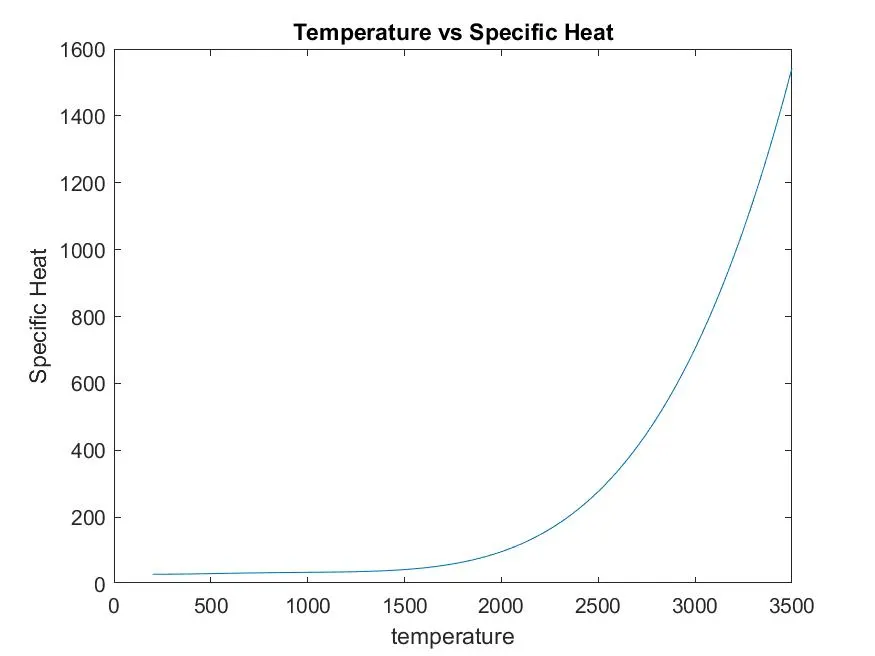
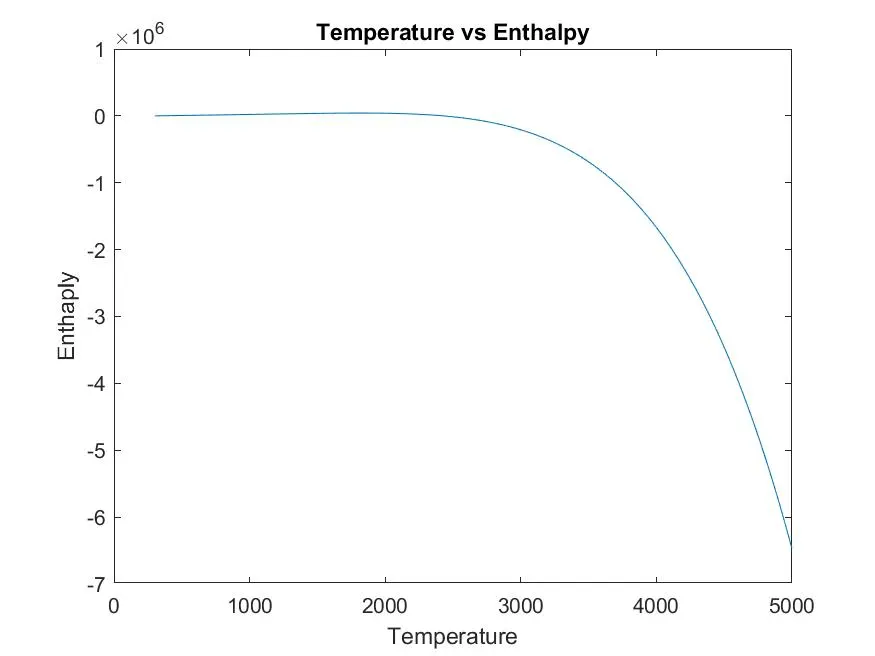
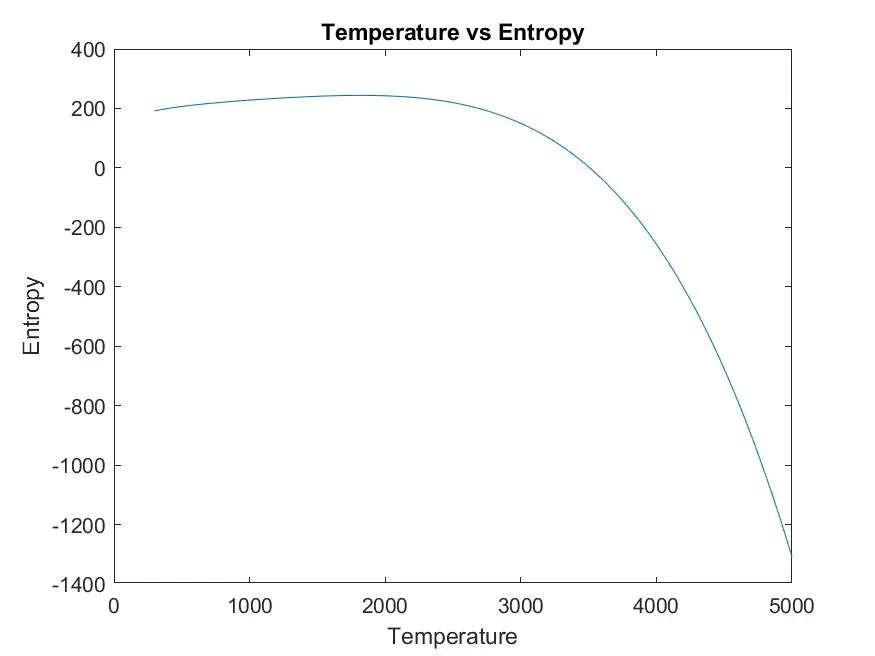
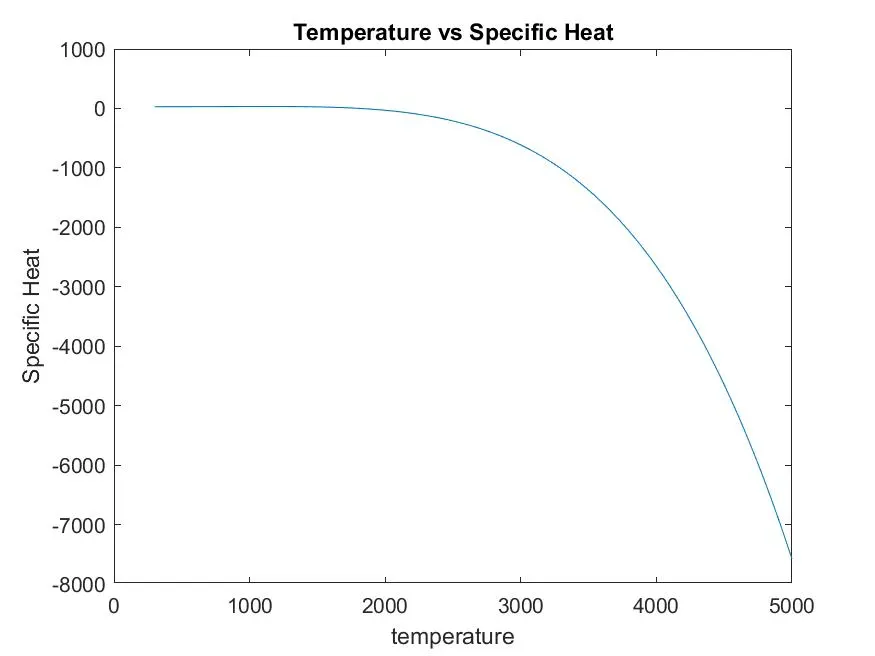
-The plots for enthalphy,enthropy and specific heat for each species will be plotted and will be stored in seperate file.
amic properties of various gas species .
Formulas used:
-To calculate enthalphy,entropy and specific heat the below formulas are used:

-Here the temperature will vary for each species,here the first 7 coefficient will use LOCAL HIGH TEMPERATURE and the last 7 coefficient will use LOCAL LOW TEMPERATURE
-To calculate the molecular weight of each species,we make sue of the formula,
Molecular weight=(Number of atoms)*(Atomic weight),where we calculate the molecular weight of all species.
FOR CALULATION OF ENTHALPY ,ENTROPY AND SPECIFIC HEAT WE HAVE USED FUNCTIONS ALSO WE HAVE CREATED
A SEPERATE FUNCTION FOR THE CALCULATION OF MOLECULAR WEIGHT
THE MAIN CODE
clear all
close all
clc

TD=fopen('THERMO.dat','r');%Initially we are using fopen to read the file
%and saving it in a pointer TD.

%Reading the Header information from the data file THERMO.dat using fgetl
%Baically these are the command lines and can be neglected

fgetl(TD);

%Reading the gloabal Temperature

%Extracting the global Temperature string in a variable

TD_line2=fgetl(TD);

%Seperating the string using the strsplit function

A=strsplit(TD_line2,' ');

%Changing the cell array into individual numbers we need these {} brackets
%We are Extracting  the  Global temperatures from the data and then
%converting the string into double

Global_low_temp=str2double((A{2}));
Global_mid_temp=str2double((A{3}));
Global_mid_temp=str2double((A{4}));

%Passing the next three command lines

fgetl(TD);
fgetl(TD);
fgetl(TD);


for i=1:53 %This for loop is used to increament the value everytime a species
    %complete evaluation takes place


%Reading the species block

%Reading the loacal Temperature for oxygen

TD_line2= fgetl(TD);

s=strsplit(TD_line2,' ');

species_name = s{1};

a=strfind(TD_line2,'G');

%Now we will find the temperature values

temp_values=TD_line2(a+4:length(TD_line2));

%Now converting the values into cell array

b=strsplit(temp_values,' ');

%Extracting the local temperature values

local_low_temp = str2double((b{1}));
local_mid_temp = str2double((b{2}));
local_High_temp = str2double((b{3}));

% finding the coefficients from the line

TD_line2=fgetl(TD);
b=findstr(TD_line2,'E');

%Finding the 1st coefficient from line 1

b1=TD_line2(1:b(1)+3);
b1=str2double(b1);

%Finding the 2nd coefficient

b2=TD_line2(b(1)+4:b(2)+3);
b2=str2double(b2);

%Finding the third coefficient

b3=TD_line2(b(2)+4:b(3)+3);
b3=str2num(b3);

%Finding the 4th coefficient

b4=TD_line2(b(3)+4:b(4)+3);
b4=str2double(b4);

%Finding the 5th coefficient

b5=TD_line2(b(4)+4:b(5)+3);
b5=str2double(b5);

%Finding the 2nd coefficient from line 2

TD_line2=fgetl(TD);

%Converting it in the form of a cell array

c=findstr(TD_line2,'E');

%Finding the first coefficient from line 2

c1=TD_line2(1:c(1)+3);

%Converting the array into number

c1=str2double(c1);

%Finding the second coefficient

c2=TD_line2(c(1)+4:c(2)+3);
c2=str2double(c2);

%Finding the third coefficient

c3=TD_line2(c(2)+4:c(3)+3);
c3=str2double(c3);
%Finding the 4th coefficient

c4=TD_line2(c(3)+4:c(4)+3);
c4=str2num(c4);

%Finding the fifth coefficient

c5=TD_line2(c(4)+4:c(5)+3);
c5=str2double(c5);


%Now moving to line 3

TD_line2=fgetl(TD);

%Converting it into cell array

d=findstr(TD_line2,'E');

%Finding the coefficients

d1=TD_line2(1:d(1)+3);

d1=str2double(d1);

%2nd coefficient

d2=TD_line2(d(1)+4:d(2)+3);

d2=str2double(d2);

%3rd coefficient

d3=TD_line2(d(2)+4:d(3)+3);

d3=str2double(d3);

%4th coefficient

d4=TD_line2(d(3)+4:d(4)+3);
d4=str2double(d4);

%Here R is a universal Gas constant whose value is 8.314 and S.I unit is
%[joules/mole*Kelvin]
mkdir(['C:UsersAYUSHDesktopskill lync matlabFile parsing',species_name])
R=8.314;
%Now defining the temperature range
t=linspace(local_low_temp,local_mid_temp,100);

%Now we have found all the 14 coefficients now we need to plot for the
%values of cp,H,S and creating the folder

%Passing the values for  Specific Heat to the function
c_p=Specific_Heat(b1,b2,b3,b4,b5,c1,c2,c3,c4,c5,d1,d2,d3,d4,local_low_temp,local_mid_temp,local_High_temp,t,R);

%Passing the values for Enthalpy function

H=Enthalpy(b1,b2,b3,b4,b5,c1,c2,c3,c4,c5,d1,d2,d3,d4,local_low_temp,local_mid_temp,local_High_temp,t,R);

%Passing the values for entropy function

s=entropy(b1,b2,b3,b4,b5,c1,c2,c3,c4,c5,d1,d2,d3,d4,local_low_temp,local_mid_temp,local_High_temp,t,R);


%Plotting

%Plotting Temperature vs Specific Heat
figure(1)
plot(t,c_p);
xlabel('temperature');
ylabel('Specific Heat');
title('Temperature vs Specific Heat');

%Plotting Temperature vs Enthalpy

figure(2)
plot(t,H);
xlabel('Temperature');
ylabel('Enthaply');
title('Temperature vs Enthalpy');

%Plotting Temperature vs Entropy

figure(3)
plot(t,s)
xlabel('Temperature');
ylabel('Entropy');
title('Temperature vs Entropy');


%Changing the file path to save the plots

cd(['C:UsersAYUSHDesktopskill lync matlabFile parsing',species_name])


%Saving the plots
saveas(1,'Specific_Heat.jpg');
saveas(2,'Enthalpy.jpg');
saveas(3,'Entropy.jpg');

%Switching the directory back to read thermo data file for molecular mass
%calculation

cd(['C:UsersAYUSHDesktopskill lync matlabFile parsing',species_name])


[M]=molecular_weight(species_name);
K=sprintf('%s molecular_weight=%f',species_name,M);
disp(K)
end
fclose(TD)
THE FUNCTION FOR CALCULATION OF ENTHALPY
%creating the function for Enthalpy

function[H]=Enthalpy(b1,b2,b3,b4,b5,c1,c2,c3,c4,c5,d1,d2,d3,d4,local_low_temp,local_mid_temp,local_high_temp,t,R)

if t>local_mid_temp
    H=R*((b1.*t)+((b2/2).*t.^2)+((b3/3).*t.^3)+((b4/4).*t.^4)+((b5/5).*t.^5)+c1);
else
    H=R*((c3.*t)+((c4/2).*t.^2)+((c5/3).*t.^3)+((d1/4).*t.^4)+((d2/5).*t.^5)+d3);
end
end
THE FUNCTION TO CALCULATE ENTROPY IS
%Creating the function for Entropy

function[s]=entropy(b1,b2,b3,b4,b5,c1,c2,c3,c4,c5,d1,d2,d3,d4,local_low_temp,local_mid_temp,local_high_temp,t,R)

if t>local_mid_temp
    s=R*((b1*log(t))+(b2.*t)+((b3/2).*t.^2)+((b4/3).*t.^3)+((b5/4).*t.^4)+c2);
else
    s=R*((c3*log(t))+(c4.*t)+((c5/2).*t.^2)+((d1/3).*t.^3)+((d2/4).*t.^4)+d4);
end
end
THE FUNCTION TO CALCULATE THE SPECIFIC HEAT IS
%Creating the function for Entropy

function[s]=entropy(b1,b2,b3,b4,b5,c1,c2,c3,c4,c5,d1,d2,d3,d4,local_low_temp,local_mid_temp,local_high_temp,t,R)

if t>local_mid_temp
    s=R*((b1*log(t))+(b2.*t)+((b3/2).*t.^2)+((b4/3).*t.^3)+((b5/4).*t.^4)+c2);
else
    s=R*((c3*log(t))+(c4.*t)+((c5/2).*t.^2)+((d1/3).*t.^3)+((d2/4).*t.^4)+d4);
end
end
THE FUNCTION TO CALCULATE MOLECULAR WEIGHT IS GIVEN BY
%Creating a Function for Molecular Weight

function[M]=molecular_weight(species_name)
atomic_weight=[15.99,1.008,12.001,14.007,39.948];
Elements=['O','H','C','N','A'];
mol_wt=0;

for i=1:length(species_name)
    for j=1:length(Elements)
        if strcmpi(species_name(i),Elements(j))
            mol_wt=mol_wt+atomic_weight(j);
            z=j;
        end
    end
    t=str2double(species_name(i));
    if(t>1)
        mol_wt=mol_wt+(atomic_weight(z)*(t-1));
    end
end
M=mol_wt;
end
MOLECULAR WEIGHT CALCULATED IN THE COMMAND WINDOW
PLOT FOR O2
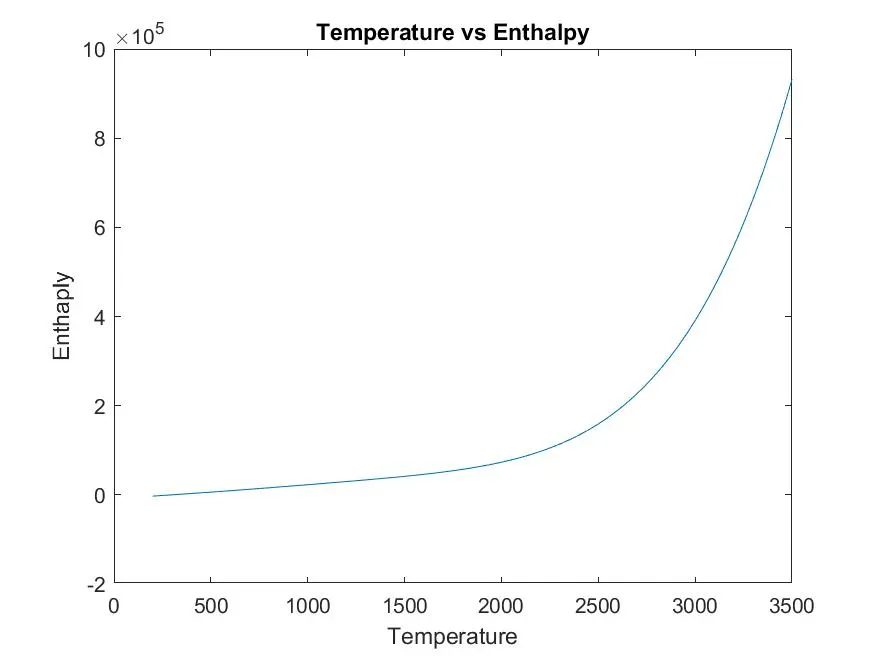
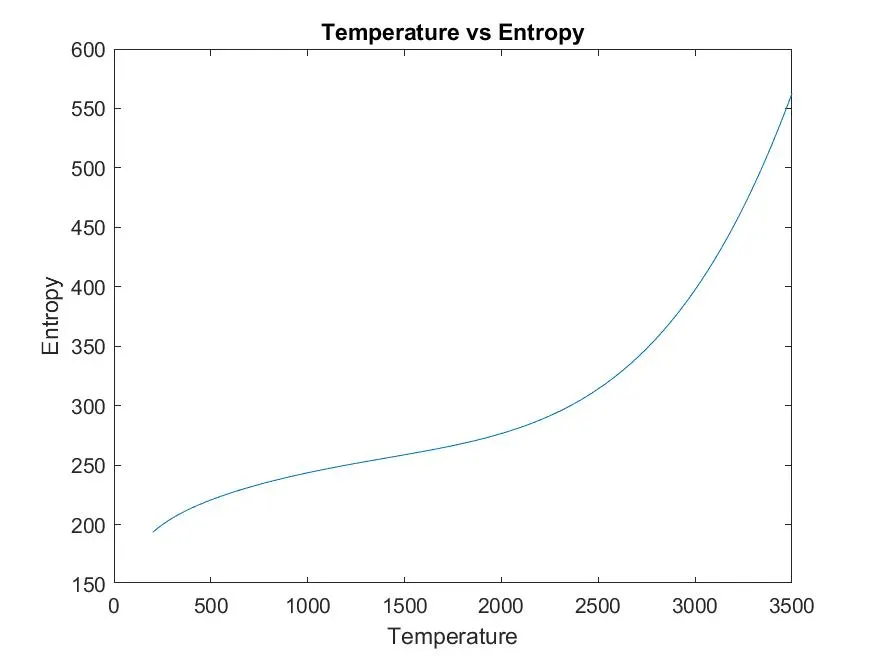
PLOT FOR N2
PLOT FOR CO2
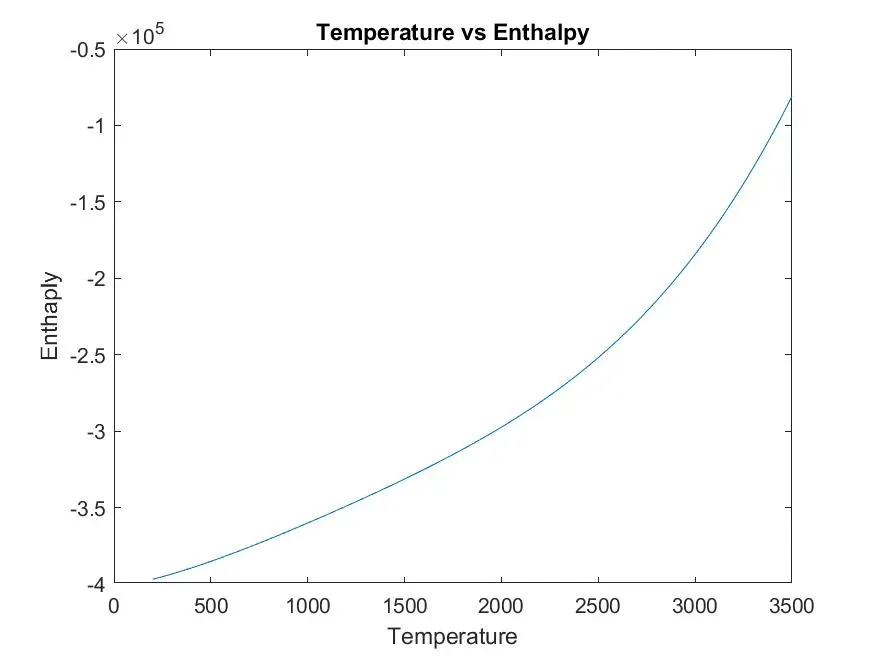
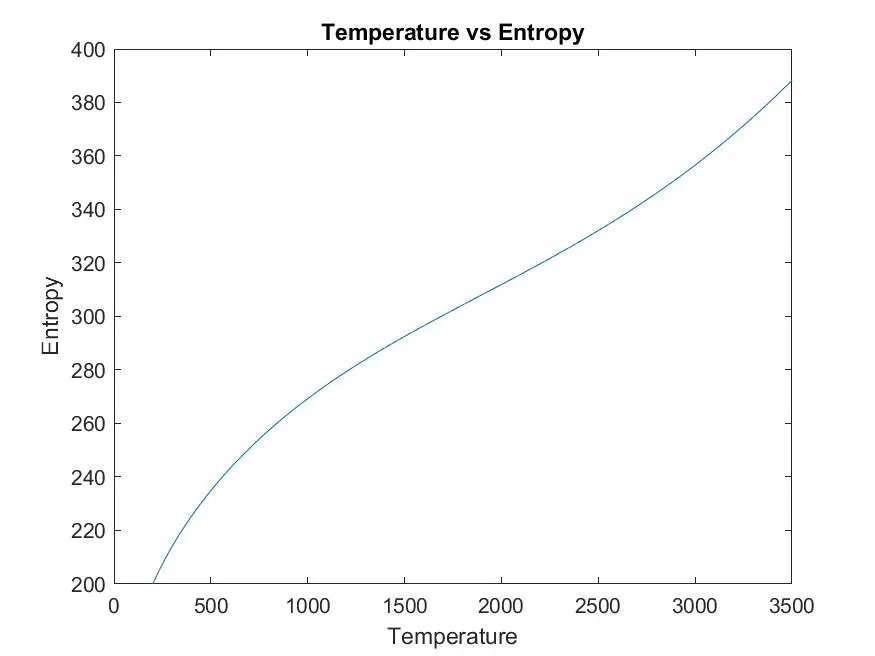
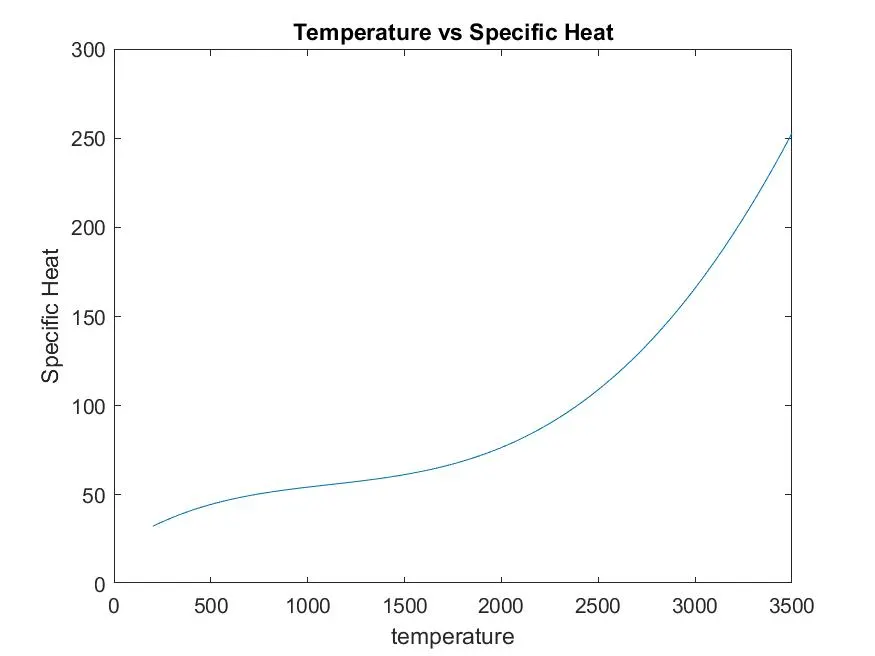
FIGURE SHOWING FOLDERS FOR ALL 53 SPECIES

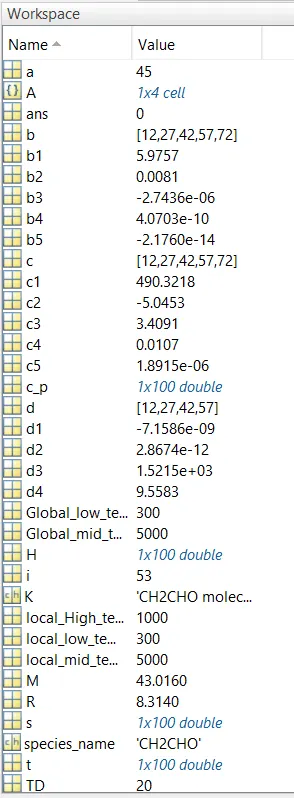
WORKSPACE
----//Errors faced while programming//----
This is not a complicated code so the only error that can occur is while creating the functions and only minute issues and can be solved by the following methods
Error 1-Saving the name of the file different as that given in matlab
solution--The file name should be the same as that of the function name other wise it may cause error
Error 2- writing the equations wrong ,always write the correct equations and cross check with the value obtained mathematically with the values obtained through the code.
Error 3- While using the plot function always check to give the right parameters
Error4 --Matlab is Case Sensitive so take care of that
Error5-- Make sure to provide % sign before command statements .
Results:
The code to prase the NASA thermodynamic data file has been programmed and the thermodynamic properties and molecular weight of species has been calculated and plotted.
- The code for file parsing is done
- The graph for N2 O2 and CO2 is plotted
- Molecular weight for every elements is found
- files are created