Project 1 - Parsing NASA thermodynamic data
Write a function that extracts the 14 co-efficients and calculates the enthalpy, entropy and specific heats for all the species in the data file. You will be reading this file NASA thermodynamic data(Tip: use fopen and fgetl). The formulae are shown below.
Here R is the universal gas constant, T is the temeprature
The FIRST 7 coefficients are HIGH-temperature coefficients and the SECOND 7 coefficients are LOW-temperature coefficients.
Also use the LOCAL TEMPERATURE RANGES which is unique for each individual species, not the GLOBAL TEMPERATURE RANGE.
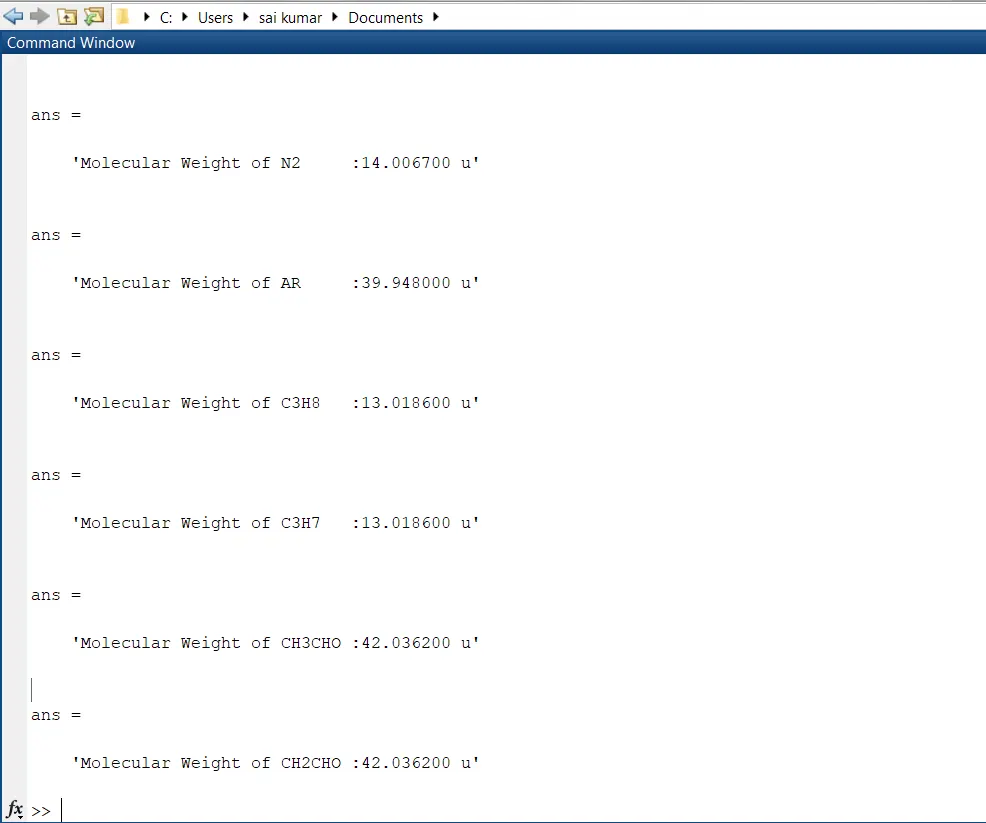
2. Calculate the molecular weight of each species and display it in the command window.
3. Plot the Cp, Enthalpy and Entropy for the local temperature range (low temperature : high temperature) specific for each species.
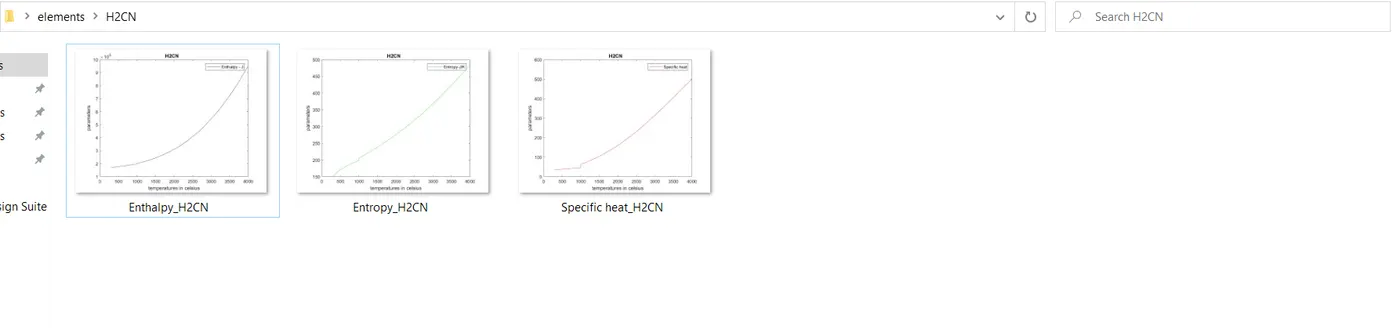
4. Save the plots as images with appropriate names and dump them in separate folders for each species with suitable name. All these should be generated automatically.
5. The main program that you will submit will just take the "THERMO.dat" file as an input and generate Cp, H and S plots.
CODE:
clear all
close all
clc

g=fopen('thermo.dat','r');  %opening the thermo.dat file
for i=1:5                   %skipping lines to enter into required content
    f=fgetl(g);
end
%% Assigning directory paths for folder creation and saving images.
D = 'C:\Users\sai kumar\Desktop';
u ='C:\Users\sai kumar\Documents';
F = 'elements';
if ~exist(fullfile(D,F),'dir')
    mkdir(fullfile(D,F))
end

for ite=1:53
k=fgetl(g);
    %% Extration of local temperatures using character counter
       ltemp=k(47:51);
       mtemp=k(56:61);
       htemp=k(66:71);
       lowtemp=str2double(ltemp);
       hightemp=str2double(mtemp);
       mediumtemp=str2double(htemp);
       chemical=k(1:7);
    %% Extraction of 14 coefficients using character 'E'
    q=fgetl(g);
    h1=strfind(q,'E');
    a1=q(2:h1(1)+3);
    c1=str2double(a1);
    a2=q(h1(1)+4:h1(2)+3);
    c2=str2double(a2);
    a3=q(h1(2)+4:h1(3)+3);
    c3=str2double(a3);
    a4=q(h1(3)+4:h1(4)+3);
    c4=str2double(a4);
    a5=q(h1(4)+4:h1(5)+3);
    c5=str2double(a5);
   l=fgetl(g);
   h3=strfind(l,'E');
   a6=l(2:h3(1)+3);
   c6=str2double(a6);
   a7=l(h3(1)+4:h3(2)+3);
   c7=str2double(a7);
   a8=l(h3(2)+4:h3(3)+3);
   c8=str2double(a8);
   a9=l(h3(3)+4:h3(4)+3);
   c9=str2double(a9);
   a10=l(h3(4)+4:h3(5)+3);
   c10=str2double(a10);
   m=fgetl(g);
   h4=strfind(m,'E');
   a11=m(2:h4(1)+3);
   c11=str2double(a11);
   a12=m(h4(1)+4:h4(2)+3);
   c12=str2double(a12);
   a13=m(h4(2)+4:h4(3)+3);
   c13=str2double(a13);
   a14=m(h4(3)+4:h4(4)+3);
   c14=str2double(a14);

   %% calculation of specific heat,enthalpy and entropy code:
   T=linspace(lowtemp,hightemp,1000);
   R=5.8;  %universal constants

for i=1:length(T)
  if T(i)< mediumtemp
    cp(i)=(c1+c2*T(i)+c3*((T(i))^2)+c4*((T(i))^3)+c5*((T(i))^4))*R;
    hrt(i)=(c1+((c2*T(i))/2)+((c3*((T(i))^2))/3)+((c4*((T(i))^3))/4)+((c5*((T(i))^4))/5)+(c6/T(i)))*R*T(i);
    sr(i)=((c1*log(T(i)))+(c2*T(i))+((c3*((T(i))^2))/2)+((c4*((T(i))^3))/3)+((c5*((T(i))^4))/4)+c7)*R;
  else
     cp(i)=(c8+c9*T(i)+c10*((T(i))^2)+c11*((T(i))^3)+c12*((T(i))^4))*R;
    hrt(i)=(c8+((c9*T(i))/2)+((c10*((T(i))^2))/3)+((c11*((T(i))^3))/4)+((c12*((T(i))^4))/5)+(c13/T(i)))*R*T(i);
    sr(i)=((c8*log(T(i)))+(c9*T(i))+((c10*((T(i))^2))/2)+((c11*((T(i))^3))/3)+((c12*((T(i))^4))/4)+c14)*R;
  end
end
    %% graphs creation and file saving code:
    figure(1);
    plot(T,cp,'color','r');
    legend('Specific heat');
    title(sprintf(chemical));
    xlabel('temperatures in celsius');
    ylabel('parameters');

    figure(2);
    plot(T,hrt,'color','b');
    legend( 'Enthalpy - J');
    title(sprintf(chemical));
    xlabel('temperatures in celsius');
    ylabel('parameters');

    figure(3);
    plot(T,sr,'color','g');
    legend('Entropy-J/K');
    title(sprintf(chemical));
    xlabel('temperatures in celsius');
    ylabel('parameters');

    v=sprintf('%s',chemical);
    Z = fullfile(D,F,v);
    if ~exist(Z,'dir')
        mkdir(Z)
    end
     o=sprintf('Specific heat_%s.png',chemical);
     oo=sprintf('Enthalpy_%s.png',chemical);
     ooo=sprintf('Entropy_%s.png',chemical);
     cd(Z);                                     %changes directory to sub folder for every loop
     saveas(1,o,'png');                         %saves the figure in terms of png
     saveas(2,oo,'png');
     saveas(3,ooo,'png');


   %% molecular weight calculation code:
   material=['A','C','H','O','N'];
   atomic_weight=[39.948  12.0107 1.0079 15.999 14.0067 ];
   mol_mass=0;
for ij=1:length(chemical)
    for mj=1:length(atomic_weight)
        if strcmp(chemical(ij),material(mj))
            mol_mass=mol_mass+atomic_weight(mj);
       position=m;
       n=str2double(chemical(ij));
if n>1
    mol_mass=mol_mass+atomic_weight(position)*(n-1);
 end
end

end
end
sprintf('Molecular Weight of %s:%f u',chemical,mol_mass)

end
cd(u)              %return to original directory for easy repeatibility
       fclose(g);  %close the data file
Molecular weight display in command window
Creation of folder and images in desktop:

consolidation:
This projects aims to read the file with minimal instructions and take useful data for making use for analyzing the data.
the coding starts by opening the file thermo.dat
thereby understanding the fgetl function in which it will change its way for every loop. So by using for loop for five times, or upto the times where you need to start reading the data till then fgetl command will be repeated
Once by analyzing the data, the useful information is found in temperature which is repeated throughout file and having same character count, so by using online character counter tool we can calculate the characters where it is going to have the data.
so extracting the local temperatures using character count and converting them to integer using str2double for numeric calculations used further.
in that same line, the chemical name also needs to be extracted for that again character counter is used.
after the extracting the useful information from temperature, fgetl is used to go for next line.
Here the coefficients of molecular species extraction starts by finding common character in the line was 'E' by using strfind we can count the characters where the data is needed, therefore it will be repeated till obtaining the 14 coefficients.
thereby introducing for loop before the extraction of temperatures, we can extract all the data based on amount of data available in file.
CALCULATION OF SPECIFIC HEAT ENTHALPY and ENTROPY.
in order to store variables, if condition plays major role by storing each variable in the form of vector by utiilizing the formulae provided, all the parameters calculation will be saved.
CREATION OF FIGURES:
Here the code is still inside for loop, so for every iteration, plot command makes the figure using the data available in matrices, thereby legend, title, labels for clear information is implemented.
CREATION OF AUTOMATIC FOLDERS AND STORING IMAGES:
using sprintf command, the chemical name will be printed or given to another command called fullfile
the fullfile command creates new folders by assigning with specified directory that is done at starting of the code.
with if and for loop logics combining with sprintf command, the directory names will change according to that, folders will be created.
With the CD command, whenever the new folder is created, cd command will be activated in such way that it gives path to saveas command for saving the figures.
once all the iterations completes again cd command was used outside loop inorder to make it go original directory for code repeatibility, otherwise everytime the code will ask for path to start.
in between here
CALCULATION OF MOLECULAR WEIGHT OF SPECIES
by assiging the molecular weight of each chemical name along with molecular mass the base data will be noted.
SO by using strcmp on the chemical name inside nested for loop along with if conditions the code calculates the molecular weight and displays the values in command of sprintf.
END
the code ends with closure of thermo.dat by using fclose command.