Project 1 - Parsing NASA thermodynamic data
FILE PARSING
AIM:
- To write a code to extract all the 14 co-efficient of each species of the NASA thermodynamic data.
- To write a code to calculate enthalpy, entropy, specific-heat vs temperature.
- To obtain molecular weight of each species of the NASA thermodynamic data.
- To plot the graphs for O2, N2, Co2 and explain the results.
THEORY:
- Four separate functions are created for specific-heat, enthalpy, entropy, molecular weight.
- The following formulas are used for the specific-heat, enthalpy, entropy.

- Where:
- Cp = specific-heat (J/kg-k)
- H = enthalpy (J)
- S = entropy (J/k)
- T = temperature(k)
- R = universal gas constant (J/mol-k)
code:
close all
clear all
clc

f1 = fopen('THERMO.dat','r');   %to open the file thermo.dat
header = fgetl(f1);             %fgetl command is used to read the line
l2 = fgetl(f1);                 %fgetl command is used to read the line
t = strsplit(l2);               %strsplit is used to split the array
global_min = str2double(t{2});  %converting the string to double precession values
global_mid = str2double(t{3});  %converting the string to double precession values
global_max = str2double(t{4});  %converting the string to double precession values

R = 8.314;                      %gas constant (J/kg-k)

temp = linspace(global_min,global_max,400); %gives values of array of a specifeied limit

%skip the lines in the file using fgetl command
for i = 1:3
    fgetl(f1);
end

%to find the species of the nasa thermodynamic data of different elements
for i = 1:53
    tline_1 = fgetl(f1);
    A = strsplit(tline_1,' ');  %strsplit used to split the character vector
    species = (A{1});

    tline_2 = fgetl(f1);        %fgetl will red the line
    tline_3 = fgetl(f1);        %fgetl will red the line
    tline_4 = fgetl(f1);        %fgetl will red the line

    a = strfind(tline_2,'E');   %strfind which used to find the string
    b = strfind(tline_3,'E');   %strfind which used to find the string
    c = strfind(tline_4,'E');   %strfind which used to find the string

    %extraction of high temperature co efficient
    a1 = str2double(tline_2(1:a(1)+3));
    a2 = str2double(tline_2(a(1)+4:a(2)+3));
    a3 = str2double(tline_2(a(2)+4:a(3)+3));
    a4 = str2double(tline_2(a(3)+4:a(4)+3));
    a5 = str2double(tline_2(a(4)+4:a(5)+3));
    a6 = str2double(tline_3(1:b(1)+3));
    a7 = str2double(tline_3(b(1)+4:b(2)+3));

    %extraction of low temperature coefficient

    b1 = str2double(tline_3(b(2)+4:b(3)+3));
    b2 = str2double(tline_3(b(3)+4:b(4)+3));
    b3 = str2double(tline_3(b(4)+4:b(5)+3));
    b4 = str2double(tline_4(1:c(1)+3));
    b5 = str2double(tline_4(c(1)+4:c(2)+3));
    b6 = str2double(tline_4(c(2)+4:c(3)+3));
    b7 = str2double(tline_4(c(3)+4:c(3)+3));

    mkdir(['E:\matlab\file parsing\',species]);   %makes new folder

    c_p = specific_heat(a1,a2,a3,a4,a5,b1,b2,b3,b4,b5,R,temp,global_mid);   %function for specific heat

    h = specific_heat(a1,a2,a3,a4,a5,b1,b2,b3,b4,b5,R,temp,global_mid);     %function for enthalpy

    s = specific_heat(a1,a2,a3,a4,a5,b1,b2,b3,b4,b5,R,temp,global_mid);     %function for entropy

    %plotting the specific heat, enthalpy, entropy vs temperature
    figure(1)
    subplot(3,1,1)      % which creates multiple plots in a plot
    plot(temp,c_p,'linewidth',5,'color','r');
    grid on
    title(species)
    xlabel('temperature(k)')        %labeling x- axis
    ylabel('specific heat(j/kg-k)') %labeling y- axis

    subplot(3,1,2)
    plot(temp,h,'linewidth',5,'color','b');
    grid on
    title(species)
    xlabel('temperature(k)')
    ylabel('enthalpy (J)')

    subplot(3,1,3)
    plot(temp,s,'linewidth',5,'color','g');
    grid on
    title(species)
    xlabel('temperature(k)')
    ylabel('entropy (j/k)')

    %change the directory and save the files
    cd(['E:\matlab\file parsing\',species]);
    saveas(1,'output.jpg');

    % A function which the molecular weight of the species
    MW = molecular_weight(species);
end

fclose(f1);     % closws the file
function codes:
specific heat function:
function [c_p] = specific_heat(a1,a2,a3,a4,a5,b1,b2,b3,b4,b5,R,temp,global_mid)
if temp <= global_mid
    c_p = R*(b1 + (b2*temp) + (b3*(temp).^2) + (b4*(temp).^3) + (b5*(temp).^4));
else
    c_p = R*(a1 + (a2*temp) + (a3*(temp).^2) + (a4*(temp).^3) + (a5*(temp).^4));
end
enthalpy function:
function [h] = enthalpy(a1,a2,a3,a4,a5,a6,b1,b2,b3,b4,b5,b6,R,temp,global_mid)
if temp <= global_mid
    h = R.*temp.*(b1 + (b2.*(temp./2)) + (b3.*(temp.^2)./3) + (b4.*(temp.^3)./4) + (b5.*(temp.^4)./5) + (b6./temp));
else
   h = R.*temp.*(a1 + (a2.*(temp./2)) + (a3.*(temp.^2)./3) + (a4.*(temp.^3)./4) + (a5.*(temp.^4)./5) + (a6./temp));
end
entropy function:
function [s] = entropy(a1,a2,a3,a4,a5,a7,b1,b2,b3,b4,b5,b7,R,temp,global_mid)
if temp <= global_mid
    s = R.*((b1.*log(temp)) + (b2.*temp) + (b3.*(((temp.^2)./2))) + (b4.*(((temp.^3)./3))) + (b5.*(((temp.^4)./4))) + b7);
else
    s = R.*((a1.*log(temp)) + (a2.*temp) + (a3.*(((temp.^2)./2))) + (a4.*(((temp.^3)./3))) + (a5.*(((temp.^4)./4))) + a7);
end
molecular weight function:
- molecular weight is caluculated by using the basic atomic weights of elements in the periodic table.
- NASA thermodynamic data consists of elements such as hydrogen, carbon, nitrogen, oxygen, argon.
- the compounds are the combination of the above elements and there corresponding atomic weights are considered.
- to get the molecular weight of the species for loop and if conditions are used for calculating the molecular weight.
- strcmpi commad is used to compare the species and the elements that are present in the compound.
- str2double command is used to convert the string into a double precession value.
- by using for loop the molecular weight of 53 species are caluculated.
function [MW] = molecular_weight(species)

element = {'h','C','N','O','Ar'};
atomic_weight = [1,12,14,16,40];

MW = 0;

for i = 1: length(species)
    for j = 1:length(atomic_weight)
        if strcmpi(species(i),element(j))
            MW = MW+atomic_weight(j);

            q = j;
        end
    end

    m = str2double(species(i));
    if m>1
        MW = MW + (atomic_weight(q)*(m-1));
    end

end

fprintf('molecular weight of %s is %d' ,species, MW);
disp(' ')
end
CODE EXPLANATION:
- Close all, clear all, clc are used to clear the command window, workspace and close any graphs.
- fopen command is used to open the required file to read the data.
- fgetl command is used to get the data in the form of a character array.
- Strsplit command is used to split the character array into individual arrays.
- Str2double command is used to convert the character array into a double pression value.
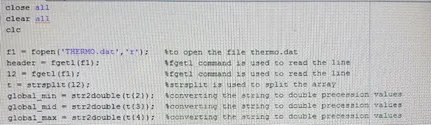
- global_min, global_mid, global_max is used to assign the values for the temperature ranges.
- R = 8.314 (j/mol-k) is universal gas constant.
- linspace command is used to get the desired number of values between two limits of equal range.
- For loop is used to repeat the program for a specified value.
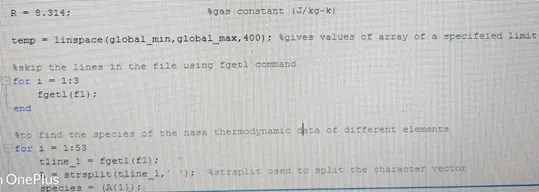
- For each species there are four lines to be read.
- First line is the species name and the second, third, fourth are the temperature co-efficient.
- Tline_2, tline_3, tline_4 is used to read the character array of the data that stored in the species.
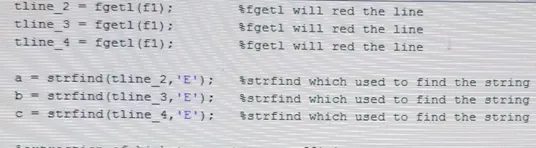
- Strfind command is used to find the specified character array in the string.
- a1, a2, a3, a4, a5, a6, a7 are the high temperature co-efficient that are assigned by using str2double
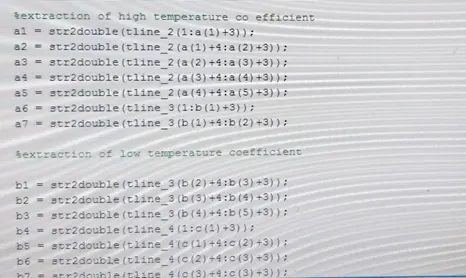
- Str2double command is used to read the character array and convert it into a double precession value.
- B1, b2, b3, b4, b5, b6, b7 are the low temperature co-efficient values.

- mkdir command is used to create a new file or folder to store the plot and data in it.
- C_p is a function which is used to calculate the specific heat of the species.
- H is a function which is used to calculate the enthalpy of the species.
- S is a function which is used to calculate the entropy of the species.
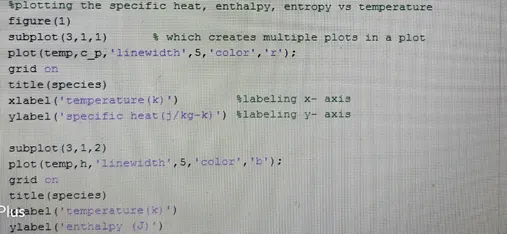
- Plot command is used to plot the values of c_p, h, s vs temp in a single figure using subplot commands.
- title command is used to give the title of the figure.
- Xlabel, ylabel is used to give the label of the respective axis.
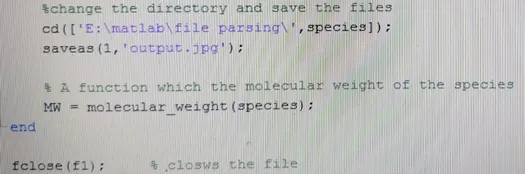
- Cd command is used to change the directory of the folder.
- saveas command is used to save the output image in the respective assigned folder.
SPECIFIC HEAT FUNCTION:
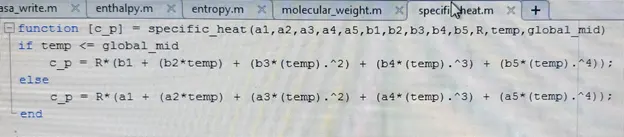
- the global_mid temperature is taken to define the specific heat of the species.
- If else command is used to calculate the high temperature coefficient or low temperature coefficient depending upon the values of the global mid.
- This function will return the value of the specific heat.
ENTHALPY:
- The function command is used to calculate the enthalpy of the species.
- If else command is used to choose the high temperature coefficient or low temperature coefficient depending upon the global mid temperature value.
- This function the return the value of enthalpy of the species.

ENTROPY:
- A function command is used to calculate the entropy of the species.
- If else command is used to calculate the high temperature coefficient or low temperature coefficient depending upon the global mid temperature value.
- This function will return the value of entropy.

MOLECULAR WEIGHT:
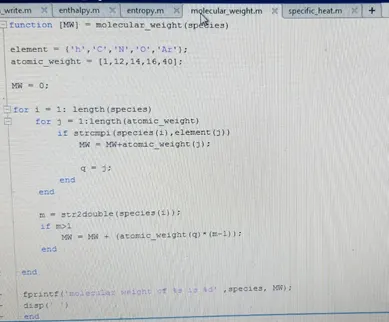
- A function command is used to calculate the molecular weight of the species.
- The atomic weight is specified, and molecular weight of every species is calculated.
- A separate for loop is written for the atomic weight and molecular weight.
- Fprintf command is used to print the molecular weight of the species.
- Fclose command is used to close the file.
OUTPUT:
- The output plots for all the 53 species are plotted and they are assigned to 53 files.
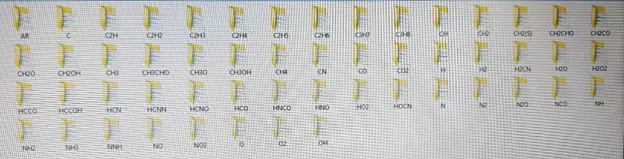
- Molecular weight of each species are displayed in the command window.
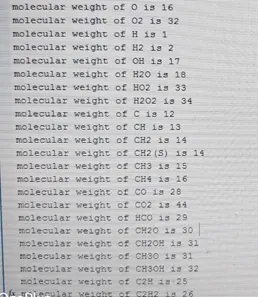
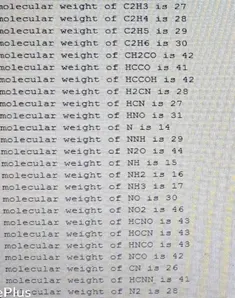
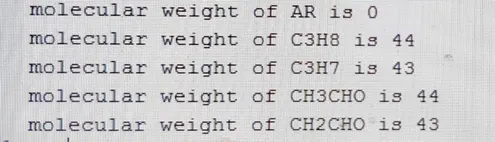
- These are the molecular weights of the 53 species that are present in the NASA thermodynamic data.
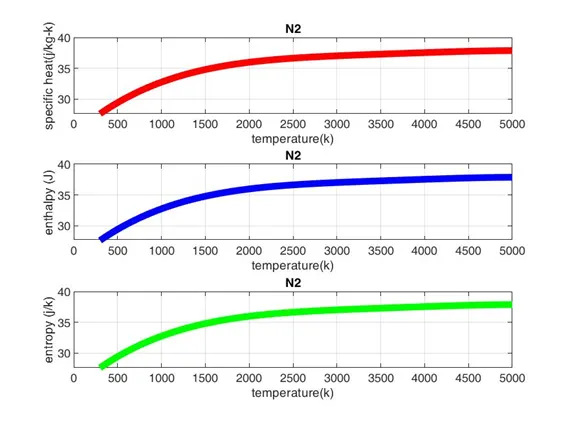
PLOT FOR N2:
- The corresponding plot of N2 in which specific heat, enthalpy, and entropy are plotted in a figure.
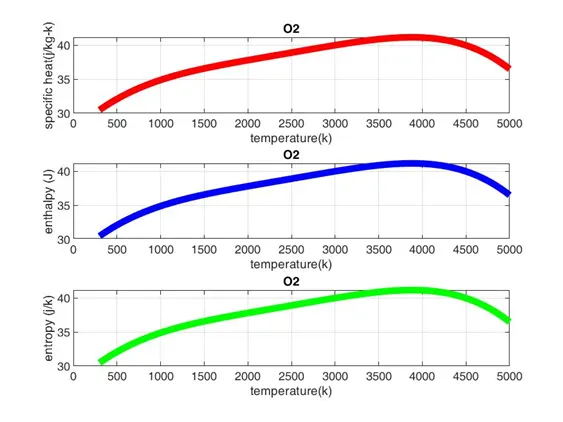
PLOT FOR O2:
- The corresponding plot for O2 in which specific heat, enthalpy, entropy vs temperature is plotted in a figure.
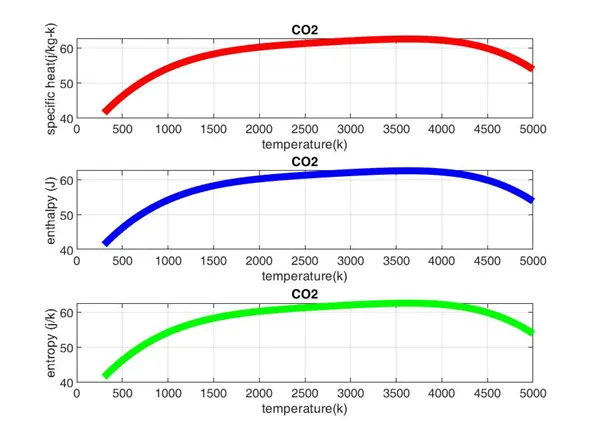
PLOT FOR CO2:
- The corresponding plot is for Co2 in which specific heat, enthalpy, entropy vs temperature in a single figure.
ERRORS:
- Faced errors at the time of change the file directory to store the species data.
- Faced error in splitting the string initially and solved the error by seeing the course video again.