Project 1 - Parsing NASA thermodynamic data
Aim
The main objectives of this project are as follows:-
- To code a function in Matlab that extracts the 14 coefficients as well as calculates the enthalpy, entropy, and specific heats for all the species in the given data file.
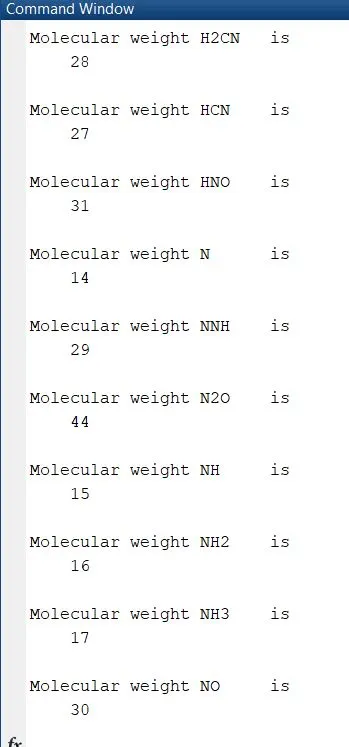
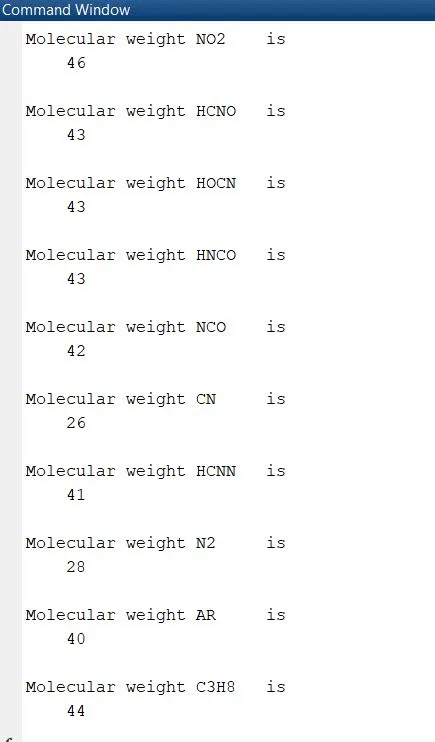
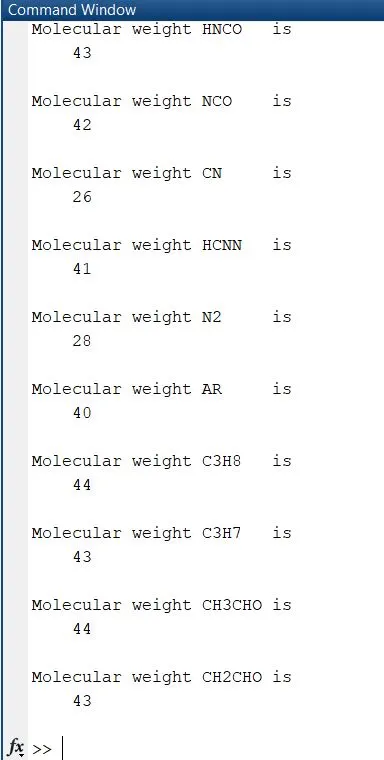
- To create a program that calculates the molecular weight of each species and displays it in the command window.
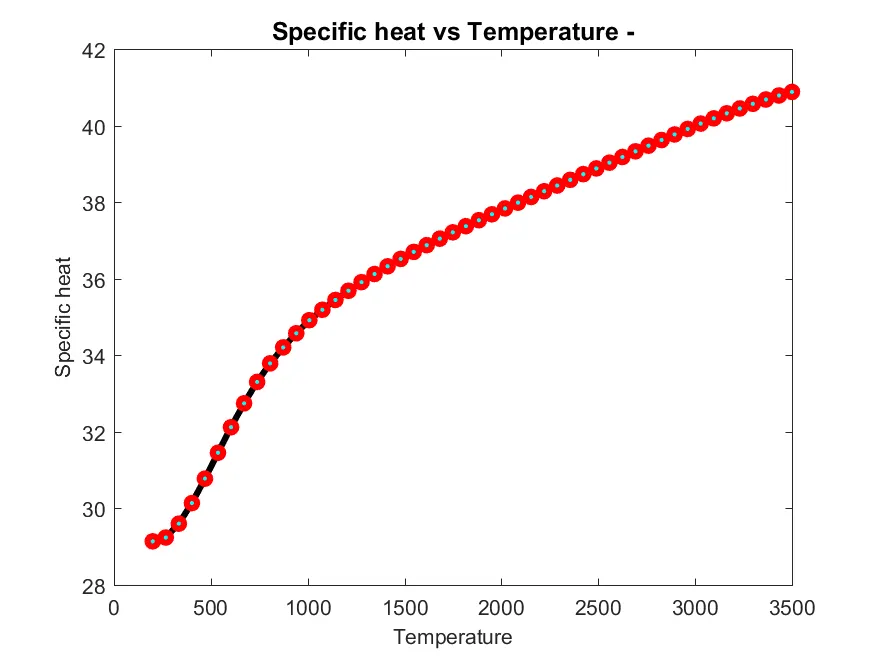
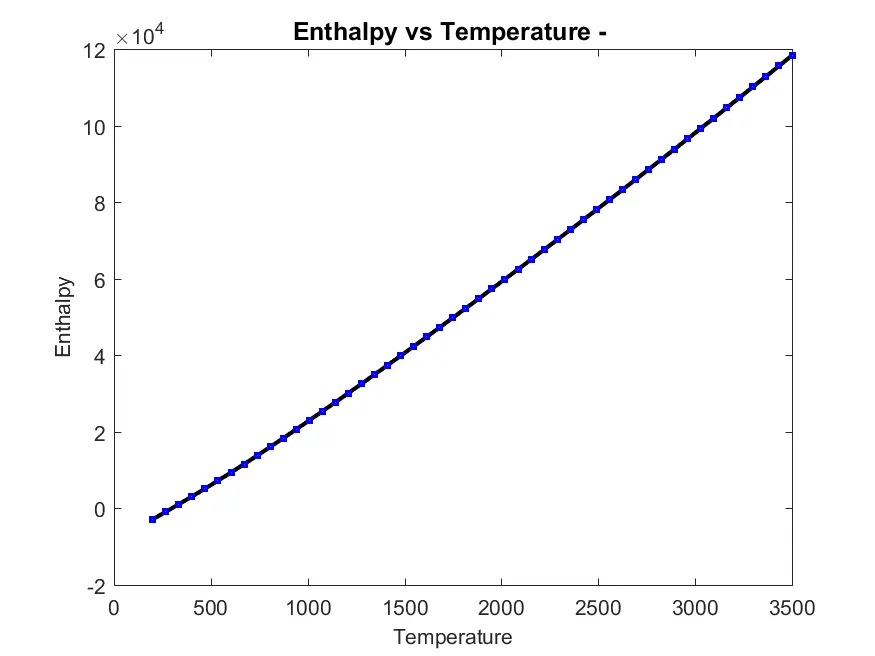
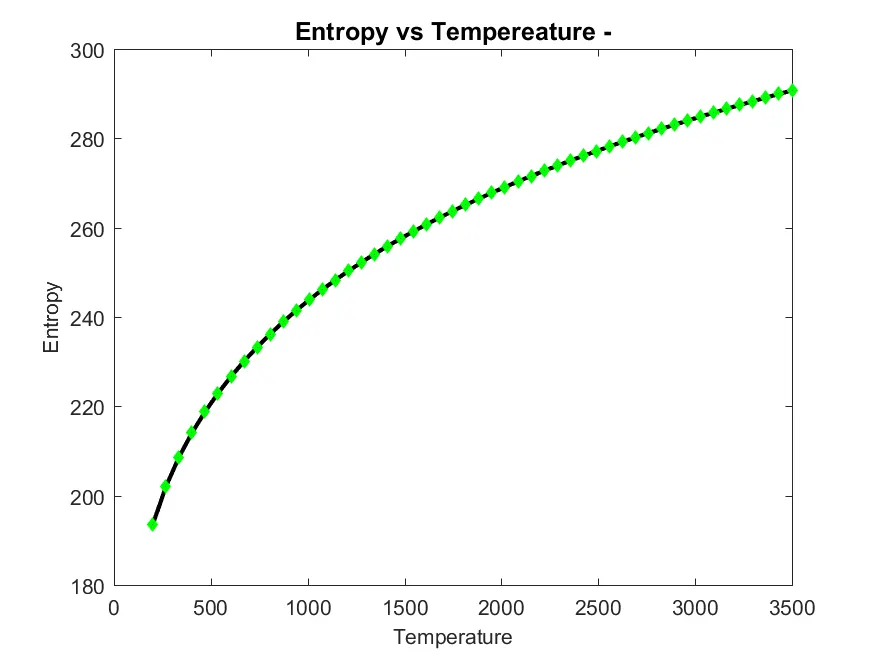
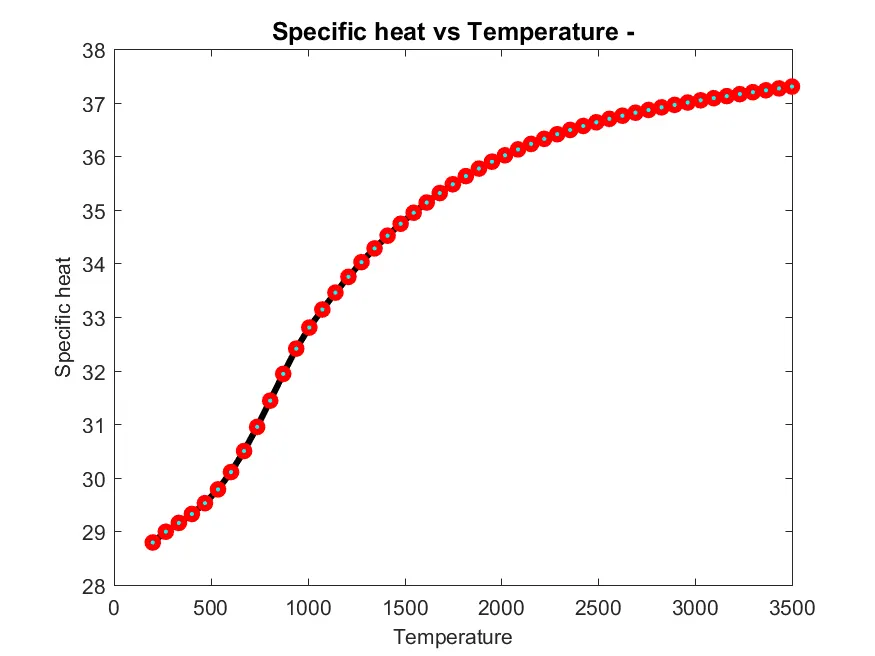
- To plot the Cp, Enthalpy, and Entropy for the local temperature range specified for each species and save them as images in separate folders for each species with a suitable name.
Algorithm
- Analysis of the given data file of which the parsing is to be done.
- Splitting the main function into small size functions for the process like extraction of species data, local temperature data, and value of coefficients so that the evaluation of the program during debugging as well as clarity of the program is maintained.
- Creating separate functions for calculating thermodynamic properties and molecular weight of the species.
- Creating plot commands along with its storage in separate folders with a suitable name so that each species has its own set of plots.
- To incorporate code for displaying the plots and molecular weight of the species user has asked into the main program.
Matlab Code
- Data extraction function
% extract data function


function[name_species,at,au,av]=extract_dat(f1)

%extraction of coefficients from last 3 lines

species=fgetl(f1);  % 1st line of species block

name_species=species(1:7); % name of the species extracted

tline=fgetl(f1);    %2nd line of species block
uline=fgetl(f1);    %3rd line of the species block
vline=fgetl(f1);    %4th line of the species block

at=sscanf(tline,'%f');
at=at(1:end-1)';          %extraction of first five high temp coefficients from second line of the species block


au=sscanf(uline,'%f');
au=au(1:end-1)';             %extraction of last two high temp coeffiecients and first three coeffiecnts from third line of the species block


av=sscanf(vline,'%f');
av=av(1:end-1)';              % extraction of last 4 low temp coeffiecents from fourth line of the species block

end- Enthalpy(h)
The formula for enthalpy, entropy, and specific heat are coded based on the following given equations:-
here R is the universal gas constant,
T is temperature
Cp is the specific heat
H is enthalpy
S is entropy
here a1 to a7 are coefficients of a species.
%%% enthalpy function(h)

function[h]=enthalpy_f(temp,high_temp,low_temp)
R=8.314;
for t=1:length(temp)
    mid_temp=1000;

    %terms to calculate h
    a1=high_temp(1);
    a2=high_temp(2)*((temp(t))/2);
    a3=high_temp(3)*((temp(t)^2)/3);
    a4=high_temp(4)*((temp(t)^3)/4);
    a5=high_temp(5)*((temp(t)^4)/5);
    a6=high_temp(6)/temp(t);
    a7=low_temp(1);
    a8=low_temp(2)*((temp(t))/2);
    a9=low_temp(3)*((temp(t)^2)/3);
    a10=low_temp(4)*((temp(t)^3)/4);
    a11=low_temp(5)*((temp(t)^4)/5);
    a12=low_temp(6)/temp(t);


if temp(t) >= mid_temp

h(t)=(a1+a2+a3+a4+a5+a6).*R.*temp(t);

else

h(t)=(a7+a8+a9+a10+a11+a12).*R.*temp(t);

end

end
- Specific heat (cp)
%%%%Specific heat function(cp)

function[cp]=specific_heat(temp,high_temp,low_temp)
R=8.314;
for t=1:length(temp)
    mid_temp=1000;

    %terms to calculate cp
    a1=high_temp(1);
    a2=high_temp(2)*temp(t);
    a3=high_temp(3)*(temp(t)^2);
    a4=high_temp(4)*(temp(t)^3);
    a5=high_temp(5)*(temp(t)^4);
    a6=low_temp(1);
    a7=low_temp(2)*(temp(t));
    a8=low_temp(3)*(temp(t)^2);
    a9=low_temp(4)*(temp(t)^3);
    a10=low_temp(5)*(temp(t)^4);


if temp(t) >= mid_temp

cp(t)=(a1+a2+a3+a4+a5)*R;

else

cp(t)=(a6+a7+a8+a9+a10)*R;

end
end
- Entropy(S)
%%%%%%%%% Entropy (S)


function[s]=entropy_f(temp,high_temp,low_temp)
R=8.314;
for t=1:length(temp)
    mid_temp=1000;

    %terms to calculate s
    a1=high_temp(1)*log(temp(t));
    a2=high_temp(2)*temp(t);
    a3=high_temp(3)*((temp(t)^2)/2);
    a4=high_temp(4)*((temp(t)^3)/3);
    a5=high_temp(5)*((temp(t)^4)/4);
    a6=high_temp(7);
    a7=low_temp(1)*log(temp(t));
    a8=low_temp(2)*temp(t);
    a9=low_temp(3)*((temp(t)^2)/2);
    a10=low_temp(4)*((temp(t)^3)/3);
    a11=low_temp(5)*((temp(t)^4)/4);
    a12=low_temp(7);


if temp(t) >= mid_temp

s(t)=(a1+a2+a3+a4+a5+a6)*R;

else

s(t)=(a7+a8+a9+a10+a11+a12)*R;

end

end- Molecular weight
%molecular weight


function [W]=m_w(name_species)

%creating arrays

e={'H' 'C' 'N' 'O' 'A'}; % cell identification array

at_w=[1 12 14 16 40]; % atomic weights array

%creating a variable which will calculate molar weight
W=0; %initializing

%for loop- species

for i=1:length(name_species)
%loop for element cell array

for j=1:length(e)
if strcmp(name_species(i),e(j))      %comparing each element of species with element array
W=W+at_w(j);   % if the elements match then adding the previous weight to respective atomic weight
J=j;
end
end

%creating a variable to store the numbers if a species includes any number >1

n=str2num(name_species(i));

if n>1
W=W + at_w(J)*(n-1);
end
end
end- Plot function
% plotting function for saving the plots of thermodynamic properties against time to the respective directories created


function plot_s(temp,cp,h,s,name_species,W)

%creating a name for the directory

fd=sprintf('%s',name_species);

%making the directory
mkdir(fd);

%plot generation for Cp vs Temp

a=figure(1);
set(a,'visible','off');
plot(temp,cp,'-ko','markeredgecolor','r','linewidth',3,'markersize',5,'markerfacecolor','c')

title(sprintf('Specific heat vs Temperature -%Molecular weight - %d',name_species,W),'Fontsize',12)

xlabel('Temperature','FontSize',10)
ylabel('Specific heat','FontSize',10)


% Plot generation for H vs Temp

a= figure(2);
set(a,'visible','off');
plot(temp,h,'-ks','markeredgecolor','b','linewidth',2,'markersize',3,'markerfacecolor','m')
title(sprintf('Enthalpy vs Temperature - %molecular weight - %d', name_species,W),'FontSize',12)

xlabel('Temperature','FontSize',10)
ylabel('Enthalpy','FontSize',10)


%plot generation for S vs Temp

a=figure(3);
set(a,'visible','off')
plot(temp,s,'-kd','markeredgecolor','g','linewidth',2,'markersize',3,'markerfacecolor','b')
title(sprintf('Entropy vs Tempereature -%Molecular weight -%d',name_species,W),'FontSize',12)

xlabel('Temperature','FontSize',10)
ylabel('Entropy','FontSize',10)

%Saving the plots generated in different directories

pf=pwd;
cd(fd);

saveas(1,'cp.png');
saveas(2, 'h.png');
saveas(3, 's.png');

cd(pf);

end- Main function
clear all
close all
clc


f1=fopen('THERMO.dat','r');
% skiping the header information
for k=1:5
skip=fgetl(f1);
end

%temperature array
temp=linspace(200,3500,50);

%data extraction

for o=1:53
%data
[name_species,at,au,av]=extract_dat(f1);

%high and low temperature coefficients
high_temp=[at au(1:2)];
low_temp=[au(3:end) av];

%Cp, s and h calculation
cp=specific_heat(temp,high_temp,low_temp);
h=enthalpy_f(temp,high_temp,low_temp);
s=entropy_f(temp,high_temp,low_temp);

%molecular weight calculation
W=m_w(name_species);
disp(['Molecular weight ' name_species 'is'])
disp(W)


%ploting T vs Cp, h, and S for each species and saving them separately

plot_s(temp,cp,h,s,name_species,W)

end

last_line=fgetl(f1);

fclose(f1);
Working:-
- First the main program is initialized in the MATLAB which opens the thermo.dat file in the working directory for the extraction of the data from the file.
- After this the temperature array is created by using linspace command.
- Then the extract data function is called which reads the first four lines of each species block from the thermo.dat file an it outputs the species name and coefficients of high temperature and low temperature.
- After this the functions for specific heat, enthalpy and entropy are called in the main function which calculates the properties according to the formulation given in the challenge.
- After this the function for calculating the molecular weight is called which calculates the molecular weight of the species.
- In the molecular weight function the molecular weight is initially set at zero during the beginning after this a nested for loop is used for calculation which first runs through the entire length of the species name and then it runs for the entire length of the constituent array. The if statement checks if a molecule in a species has more than one molecule and increases its molecular weight accordingly.
- And finally the ploting function is called which plots the thermodynamic properties against time and saves them in the respective folder created.
Plots
- O2
- N2
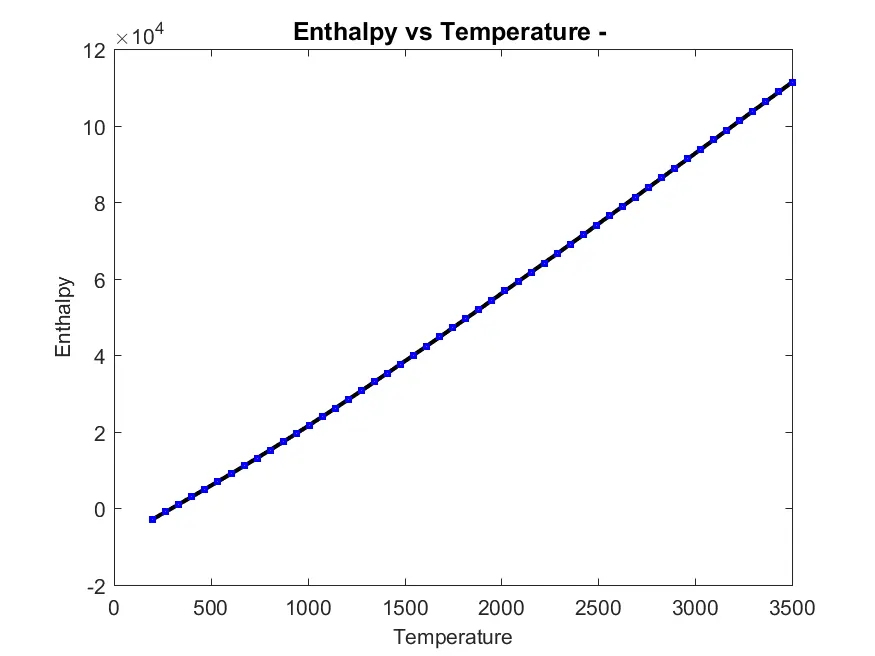
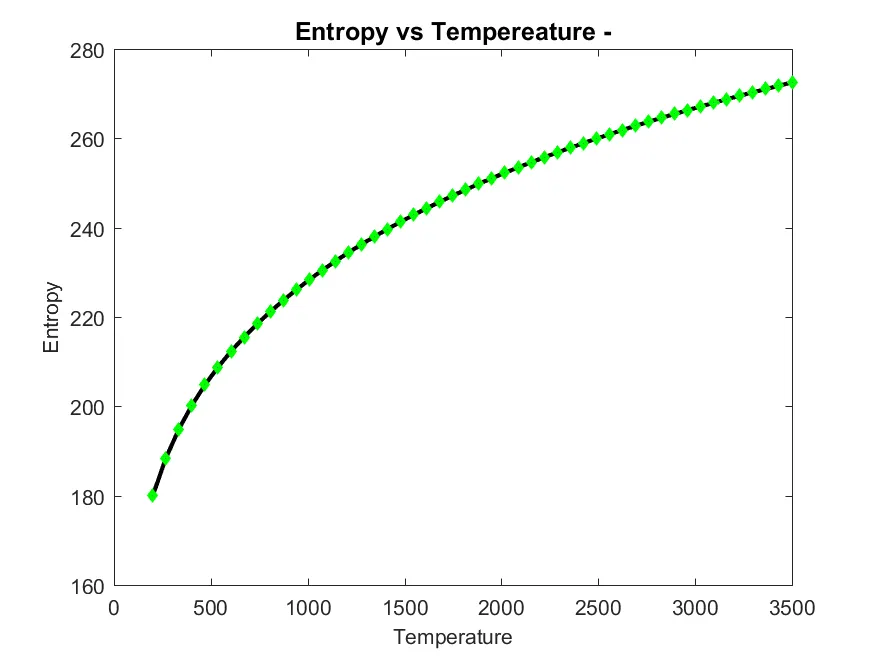
- CO2
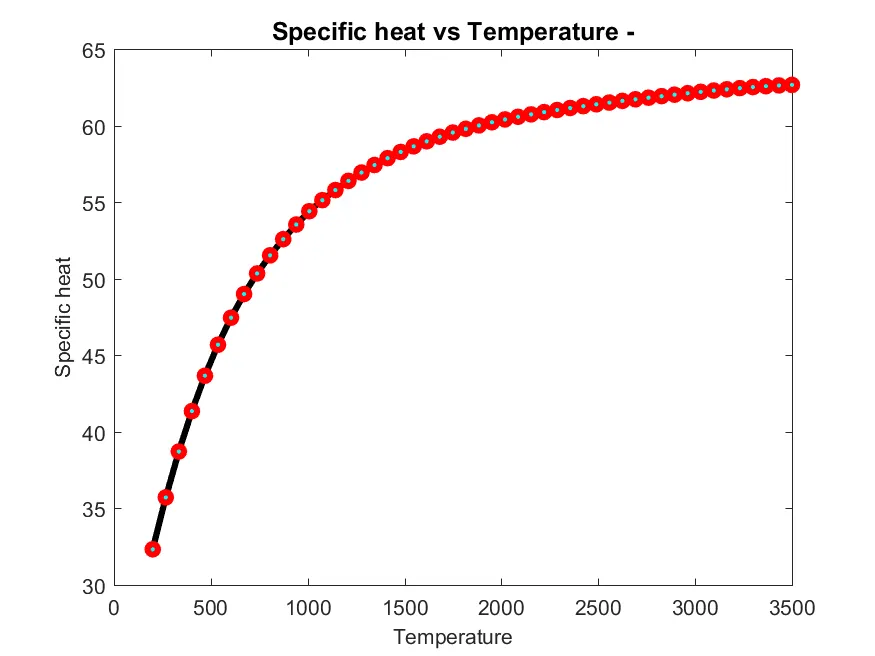
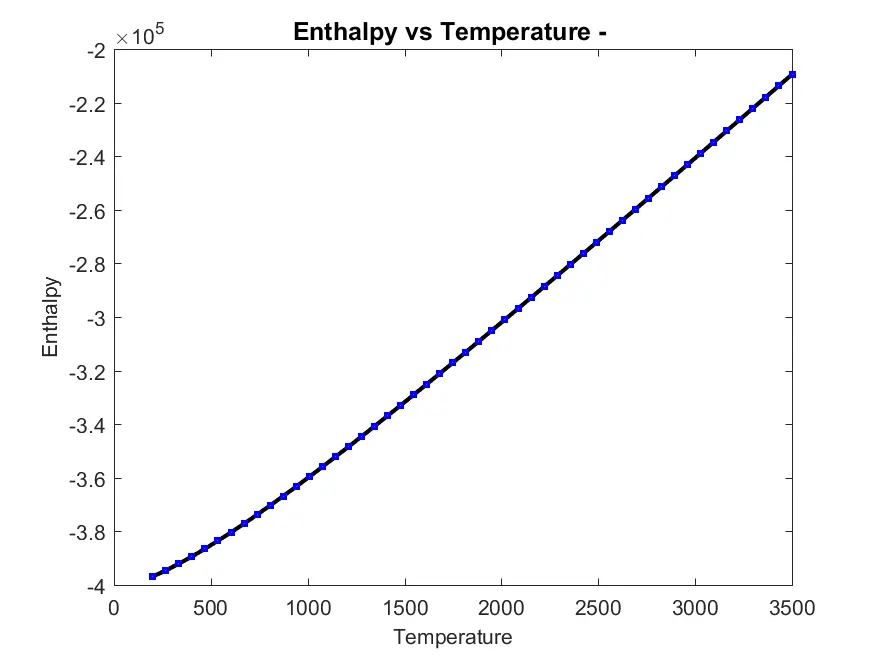
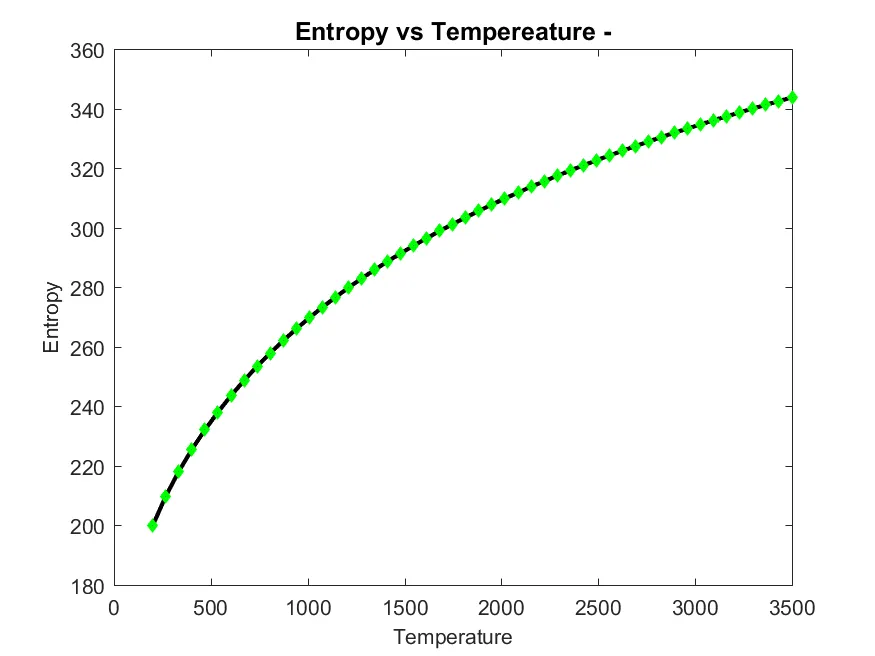
Screenshots
- Molecular weight displayed in the command prompt.
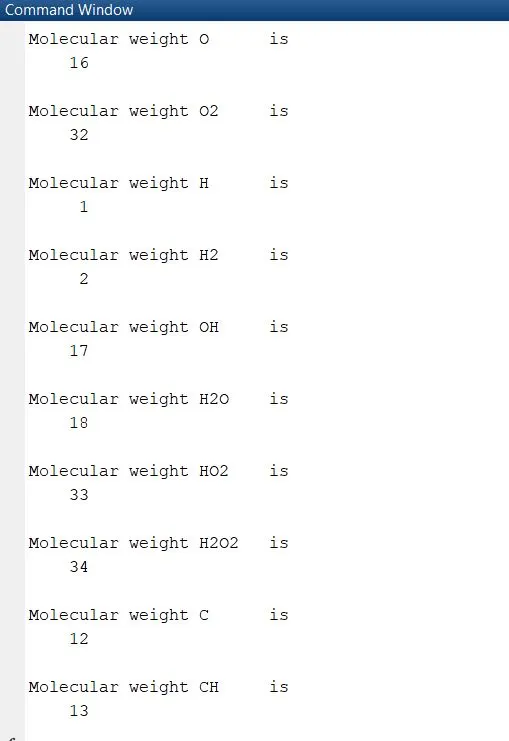
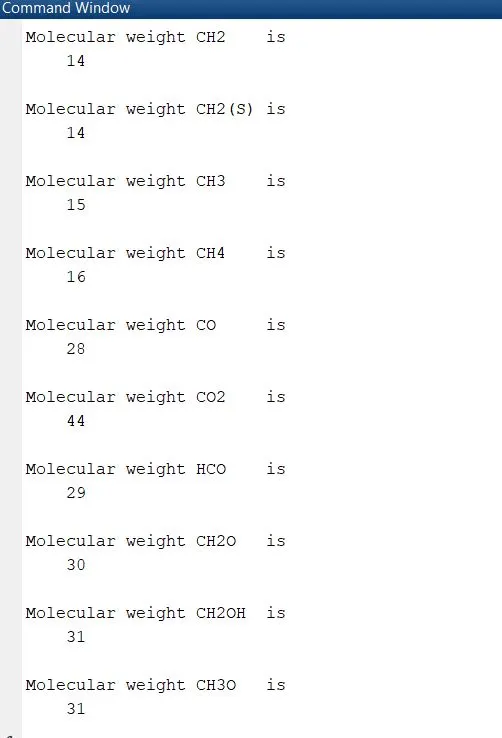
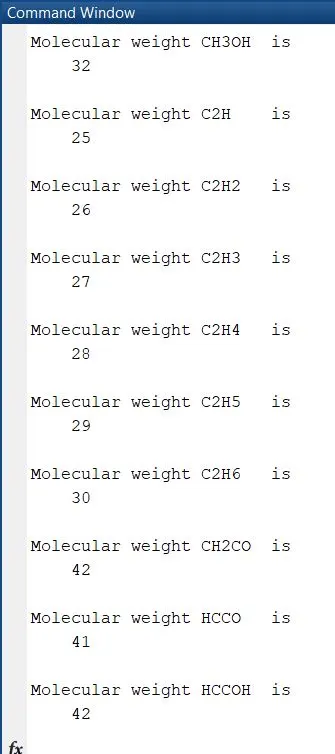
- Screenshot of the folder where all the folders are created for specific species.

Learning
- The program is compartmentalized into specific functions so that any error generated can be easily debugged accordingly.
- The syntax for opening a file in the Matlab is fopen along with respective type of syntax like 'r' here stands for read only.
- The syntax fgetl here is used for getting the first line of the data file provided for the challenge.
- The 'mkdir' command is used to create a folder for saving the plots that will be generated.
- The cd command is used to change directory for the purpose of saving the plots into a different location.
Errors:-
- The syntax errors were the only errors that occurred during this challenge which was effectively solved using the help and support function in Matlab.
- The graph of the enthalpy curve was generated with some error i.e. a curved line got generated for the given temperature range which was rectified by properly using the given formulation for enthalpy.
Conclusion
- The function in Matlab that extracts the 14 coefficients as well as calculates the enthalpy, entropy, and specific heats for all the species in the given data file is successfully coded.
- The creation of a program that calculates the molecular weight of each species and displays it in the command window is successfully created.
- The plot of Cp, Enthalpy, and Entropy for the local temperature range specified for each species is created and the images are saved in separate folders for each species with a suitable name.
References
- The in built command lecture in the skill- lync course.
- https://in.mathworks.com/help/matlab/help-and-support.html
- https://in.mathworks.com/help/matlab/
- http://combustion.berkeley.edu/gri_mech/data/nasa_plnm.html
- https://myengineeringworld.net/2013/10/Excel-thermochemical-NASA-polynomials-Burcat.html