Parsing NASA thermodynamic data
PARSING NASA THERMODYNAMIC DATA
AIM: To extract data from a .dat file & evaluate Thermodynamic Properties of different species using data tabulated by NASA.
OBJECTIVES OF THE PROJECT:
- Write a function that extracts the 14 co-efficients and calculates the enthalpy, entropy and specific heats for all the species in the data file. You will be reading this file NASA
- Calculate the molecular weight of each species and display it in the command window.
- Plot the Cp, Enthalpy and Entropy for the local temperature range (low temperature : high temperature) specific for each species.
- Save the plots as images with appropriate names and dump them in separate folders for each species with suitable name. All these should be generated automatically.
WORKFLOW:
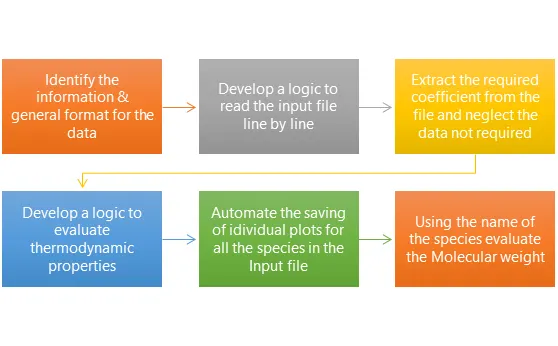
NASA came up with polynomials that can be used to evaluate thermodynamic properties such as Cp, H and S. They have also documented the co-efficient that are required to evaluate these polynomials for 1000+ species.
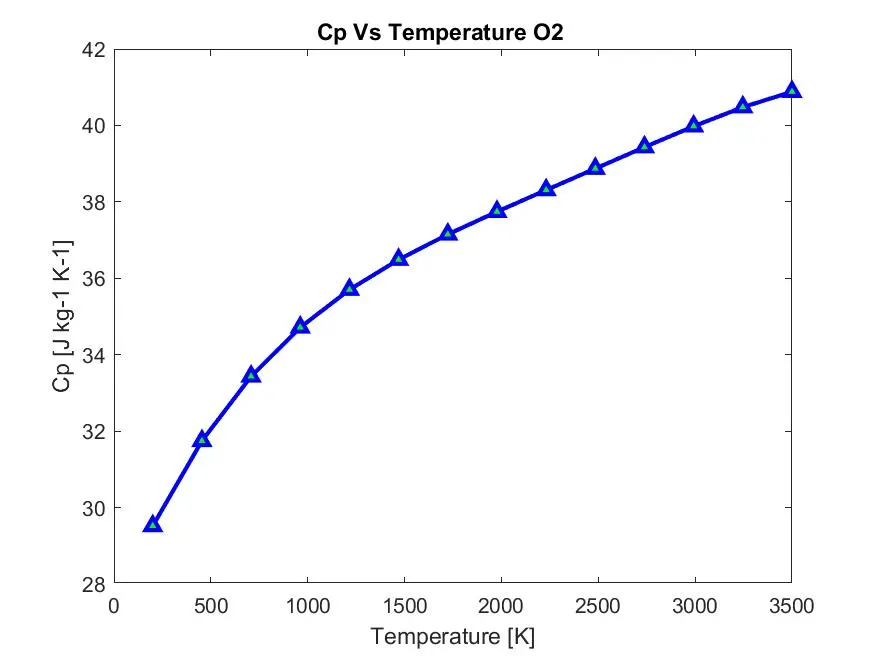
Here Cp stands for Specific heat at constant pressure [J kg-1 K-1]
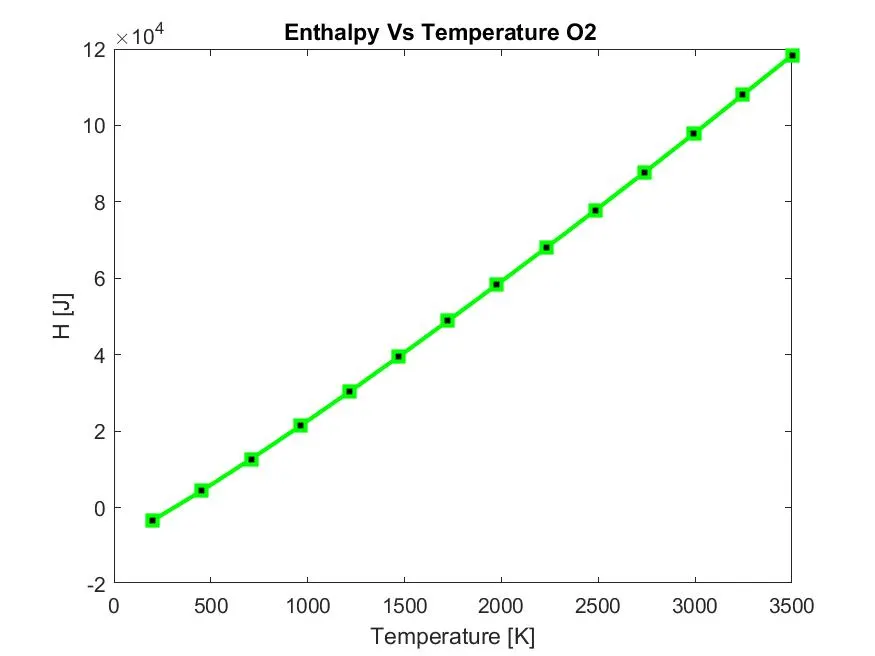
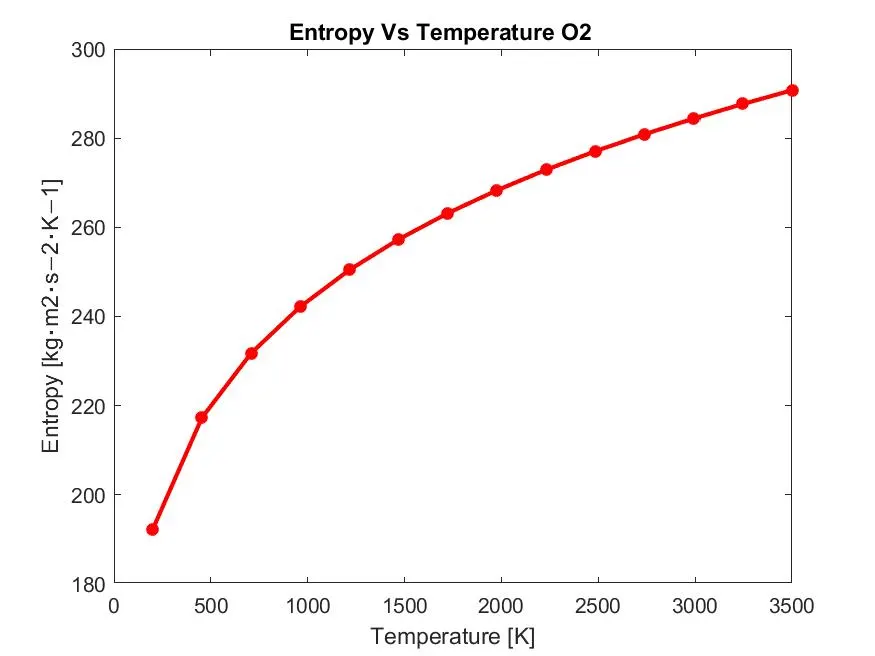
H stands for Enthalpy [J] & S stands for Entropy [kg⋅m2⋅s−2⋅K−1]
R is gas constant = 8.314 [m3⋅Pa⋅K−1⋅mol−1]
`(Cp)/R=a1+(a2*T)+(a3*T^2)+(a4*T^3)+(a5*T^4)`
`(H)/(R*T)=(a1+((a2*T)/2)+((a3*T^2)/3)+((a4*T^3)/4)+((a5*T^4)/5)+(a6)/T)`
`(S)/(R)=(a1*log(T)+(a2*T)+((a3*T^2)/2)+((a4*T^3)/3)+((a5*T^4)/4)+a7)`
The FIRST 7 coefficients are HIGH-temperature coefficients and the SECOND 7 coefficients are LOW-temperature coefficients.
We will be extracting the coefficients from the given input file called ‘THERMO.dat’ using the MATLAB code:
%%
%PARSING NASA THERMODYNAMIC DATA
clear all
close all
clc

%opening the Input(.dat) file
f1=fopen('THERMO.dat','r');
a1=fgetl(f1); %Commenting the line (no action required)
a2=fgetl(f1); %Commenting the line (no action required)
a2a=strsplit(a2,' ');    %Splitting string into global temperatures
global_low_temp=str2num(a2a{2});
global_mid_temp=str2num(a2a{3});
global_high_temp=str2num(a2a{4});

%Commenting the line (no action required)
for i=1:3
    fgetl(f1)
end
%%
%For extracting Element wise Temperature Coefficient
for i=1:53  %as no of elements present are 53
cd 'C:\Users\sharb\OneDrive\Desktop\Skill_Lync\Matlab\Final_Project'
b=fgetl(f1);
name=b(1:6)     %Extracting the name of the Element
M{i}=name       %Storing the name in array called 'M'
strfind(b,'G')  %'G' acting as a marker to identify local temperature range
local_low_temp=b(46+3:46+9);    %Local low temperature
local_high_temp=b(46+11:46+18); %Local high temperature
local_medium_temp=b(68:68+7);   %Local medium temperature

%Extracting temperature
c=fgetl(f1)     %Reading first line
strfind(c,'E')  %Marker to identify the position of exponent
a1=str2double(c(1:12+3)) %Using 'E' extracting the coefficient
a2=str2double(c(16:30))  %Using 'E' extracting the coefficient
a3=str2double(c(31:45))  %Using 'E' extracting the coefficient
a4=str2double(c(46:60))  %Using 'E' extracting the coefficient
a5=str2double(c(61:75))  %Using 'E' extracting the coefficient

d=fgetl(f1)              %Reading second line
strfind(d,'E')           %Marker to identify the position of exponent
a6=str2double(d(1:12+3)) %Using 'E' extracting the coefficient
a7=str2double(d(16:30))  %Using 'E' extracting the coefficient
a8=str2double(d(31:45))  %Using 'E' extracting the coefficient
a9=str2double(d(46:60))  %Using 'E' extracting the coefficient
a10=str2double(d(61:75)) %Using 'E' extracting the coefficient


e=fgetl(f1)              %Reading third line
strfind(e,'E')           %Marker to identify the position of exponent
a11=str2double(e(1:12+3))  %Using 'E' extracting the coefficient
a12=str2double(e(16:30))   %Using 'E' extracting the coefficient
a13=str2double(e(31:45))   %Using 'E' extracting the coefficient
a14=str2double(e(46:60))   %Using 'E' extracting the coefficient

high_temp_coeff=[a1 a2 a3 a4 a5 a6 a7]; %high temperature coefficient
low_temp_coeff=[a8 a9 a10 a11 a12 a13 a14]; %low temperature coefficient
%%
%Calculation of Thermodynamic properties
T=linspace(200,3500,14); %Obtaining temperature points
R=8.314                   %m3⋅Pa⋅K−1⋅mol−1
for i=1:length(T)
if T(i)>1000    %for high temperature range

Cp= R*(a1+(a2.*T)+(a3.*T.^2)+(a4.*T.^3)+(a5.*T.^4)); % [J kg-1 K-1]
H=R.*T.*(a1+((a2.*T)./2)+((a3.*T.^2)./3)+((a4.*T.^3)./4)+((a5.*T.^4)./5)+(a6./T)); %[J]
S=R*(a1.*log(T)+(a2.*T)+((a3.*T.^2)./2)+((a4.*T.^3)./3)+((a5.*T.^4)./4)+a7); %[kg⋅m2⋅s−2⋅K−1]
else
Cp= R*(a8+(a9.*T)+(a10.*T.^2)+(a11.*T.^3)+(a12.*T.^4)); % [J kg-1 K-1]
H=R.*T.*(a8+((a9.*T)./2)+((a10*T.^2)./3)+((a11.*T.^3)./4)+((a12.*T.^4)./5)+(a13./T)); %[J]
S=R*(a8.*log(T)+(a9.*T)+((a10.*T.^2)./2)+((a11.*T.^3)./3)+((a12.*T.^4)./4)+a14);  %[kg⋅m2⋅s−2⋅K−1]
end
end

%%
%Plotting
mkdir(name) %making a new folder with name of the element
cd(name)    %changing current directory to Name of the element

figure(1)
plot(T,Cp,'-^b','markerfacecolor','g','linewidth',2);
xlabel('Temperature [K]');
ylabel('Cp [J kg-1 K-1]');
title(['Cp Vs Temperature',' ',name]);

figure(2)
plot(T,H,'-sg','markerfacecolor','k','linewidth',2);
xlabel('Temperature [K]');
ylabel('H [J]');
title(['Enthalpy Vs Temperature',' ',name]);

figure(3)
plot(T,S,'-*r','markerfacecolor','g','linewidth',2);
xlabel('Temperature [K]')
ylabel('Entropy [kg⋅m2⋅s−2⋅K−1]')
title(['Entropy Vs Temperature',' ',name])
saveas(1,'Cp_Vs_Temperature','jpg');   %Saving figure 1 for Cp
saveas(2,'Enthalpy_vs_Temperature','jpg');    %Saving fgure 2 for H
saveas(3,'Entropy_Vs_Temperature','jpg');    %Saving figure 3 for S
end

%%
fileID= fopen('Total_Molecular_Mass.txt','w'); %Opening a new textfile to store the Molecular weight
fprintf(fileID,'%15s %17s\n','Name_of_Species',' Molecular_Weight'); %Giving heading for the Columns
%Evaluating Molecular Weight
for N=1:length(M)
name=num2str(M{N}); %From array M getting individual atoms


k=strfind(name,'2') %to find repetion of atoms in a molecule
q=0;
if k>1
for i=1:length(k)
   q(i)=name(k(i)-1) %getting the atom of the element being repeated
end
final_str=strcat(name,q) %adding the repetion into the string
a=strfind(final_str,'C'); %identifying number of Carbon atoms
b=strfind(final_str,'O'); %identifying number of Oxygen atoms
c=strfind(final_str,'H'); %identifying number of Hydrogen atoms
d=strfind(final_str,'N'); %%identifying number of Nitrogen atoms
e=strfind(final_str,'A'); %identifying number of Argon atoms
f=strfind(final_str,'S');%identifying number of Sulphur atoms


l=strfind(name,'3')  %to find repetion of atoms in a molecule
if l>1
    r=0;
  for j=1:length(l)
   r(j)=name(l(j)-1) %getting the atom of the element being repeated
  end
    final_str=strcat(name,q,r,r) %adding the repetion into the string
a=strfind(final_str,'C'); %identifying number of Carbon atoms
b=strfind(final_str,'O'); %identifying number of Oxygen atoms
c=strfind(final_str,'H'); %identifying number of Hydrogen atoms
d=strfind(final_str,'N'); %%identifying number of Nitrogen atoms
e=strfind(final_str,'A'); %identifying number of Argon atoms
f=strfind(final_str,'S');%identifying number of Sulphur atoms

end
else
    final_str=name; %for no repetition
a=strfind(final_str,'C'); %identifying number of Carbon atoms
b=strfind(final_str,'O'); %identifying number of Oxygen atoms
c=strfind(final_str,'H'); %identifying number of Hydrogen atoms
d=strfind(final_str,'N'); %%identifying number of Nitrogen atoms
e=strfind(final_str,'A'); %identifying number of Argon atoms
f=strfind(final_str,'S');%identifying number of Sulphur atoms
end
%Multiplying the Mass of Atoms with number of atoms of each element
mass_c=length(a)*12; %Molecular weight of Carbon
mass_h=length(c)*1;  %Molecular weight of Hydrogen
mass_O=length(b)*16; %Molecular weight of Oxygen
mass_N=length(d)*14; %Molecular weight of Nitrogen
mass_A=length(e)*39; %Molecular weight of Argon
mass_S=length(f)*32; %Molecular weight of Sulphur

Total_Molecular_mass(N)=mass_c+mass_h+mass_O+mass_N+mass_A+mass_S %[g/mol]
fprintf(fileID,'%9s %17f\n',name,Total_Molecular_mass(N)); %Storing the name & Molecular weight of species
end
fclose(fileID); %Closing the text file which stores Molecular Mass
Explanation:
Part1: Reading the Input data
- We open the dat file using ‘fopen’ command & specify that we are opening it in read mode.
- We are reading the input file line by line as string data type.
- By using fgetl command we are accessing the data line by line.
- We extract the global temperature ranges in forms of string and using str2num, we convert the string data type to number.
- As the next three lines are not required, we just access them and move to the next line.
Part 2: Extracting Temperature Coefficient
- As there are 53 molecules for which we will be extracting the data and as each and every molecule is having the coefficients represented in the same style, we will write the logic for one and using a for loop we will extract the data for all other data types.
- Using fgetl we access the next line and then we store the name of the molecule in a array called ‘M’.
- Using G as a marker we identify the position of the local temperature ranges and according to the particular value we extract the local temperature ranges.
- Using the fgetl we move to the next line and then using ‘E’ for the exponent as a marker we extract the coefficient and then start storing them in individual variables.
- Like this we read the next two lines and store all the 14 Temperature coefficients into the respective variables for all the 53 elements using the for loop.
Part 3: Calculation of thermodynamic properties
- Using the local temperature ranges we obtain a continuous temperature range for evaluating the thermodynamic properties and plotting them smoothly.
- As we have high temperature coefficients and low temperature coefficients, we evaluate the thermodynamic properties using appropriate coefficients according to the temperature value.
- Here for temperature less than 1000 Kelvin we are using low temperature coefficient which are from a8 to a14 and for temperature values more than 1000 Kelvin we are using a1 to a14 which are high temperature coefficients.
- Using these coefficients and the relation obtained by NASA we evaluate the Specific heat, Enthalpy and Entropy for the molecule.
Part 3: Plotting individual Thermodynamic Properties
- Using ‘mkdir’ we create a new folder with the name of the molecule we are evaluating all the properties for.
- Making the current directory as the present working directory helps us save the plots in the newly created folder.
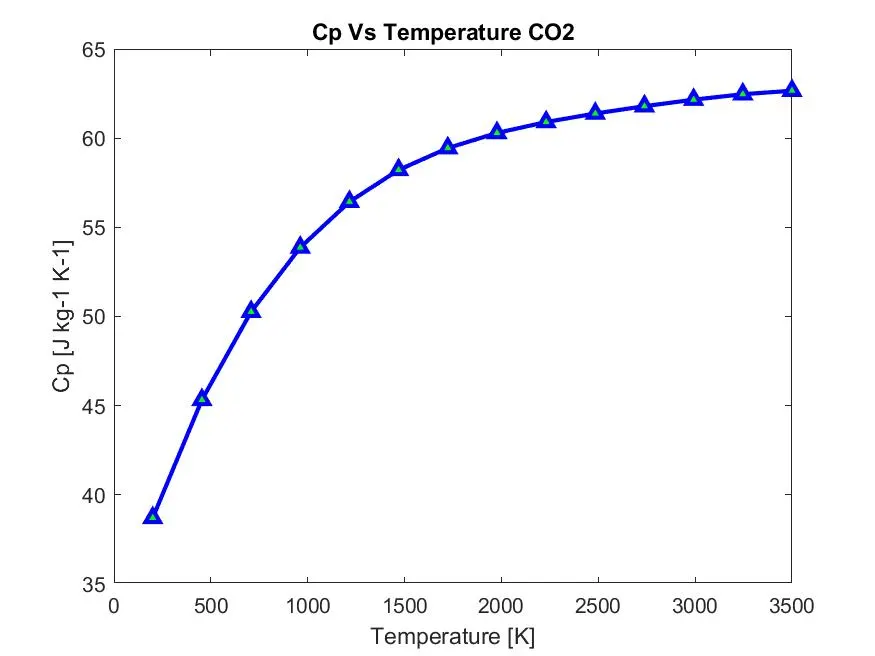
- In figure(1) we plot the Specific heat variation with temperature and figure(2) we plot the Enthalpy variation with the temperature and in figure(3) we plot the Entropy variation with temperature.
- Using the command ‘saveas’ we save all the plots for the thermodynamic properties in the current folder.
- After this is done, we are instructing our program to retirn to base folder and the new loop starts again for the next molecule.
NOTE: For each and every Molecule we are doing the same procedure, hence we have used a FOR loop in the beginning of part2 of the code.
Part 4: Evaluating Molecular Weight
- Opening a new text file using ‘fopen’ where we will be storing the molecular weight.
- Using ‘fprintf’ we are giving the heading of the text file for individual columns
- Here we are reading the name of the molecule and then using the number of times they have occurred we are creating another string which tells the program the total occurrence of a particular atom.
- Using the occurrence by using ‘length’ of that particular array we then multiply them by their atomic weight and then add them together to find the total molecular mass.
- Using ‘fprintf’ we store the name of the molecule and its molecular mass respectively.
- Using a for loop we are storing all the molecular weights into the text file and then close the text file.
OBSERVATION:
1.Base folder where the code creates new folders according to the moldecule's name and saves the plots for Cp, H, and S individually in specific folder.

2. Thermodynamic Properties for O2.
3.Thermodynamic Properties for N2.
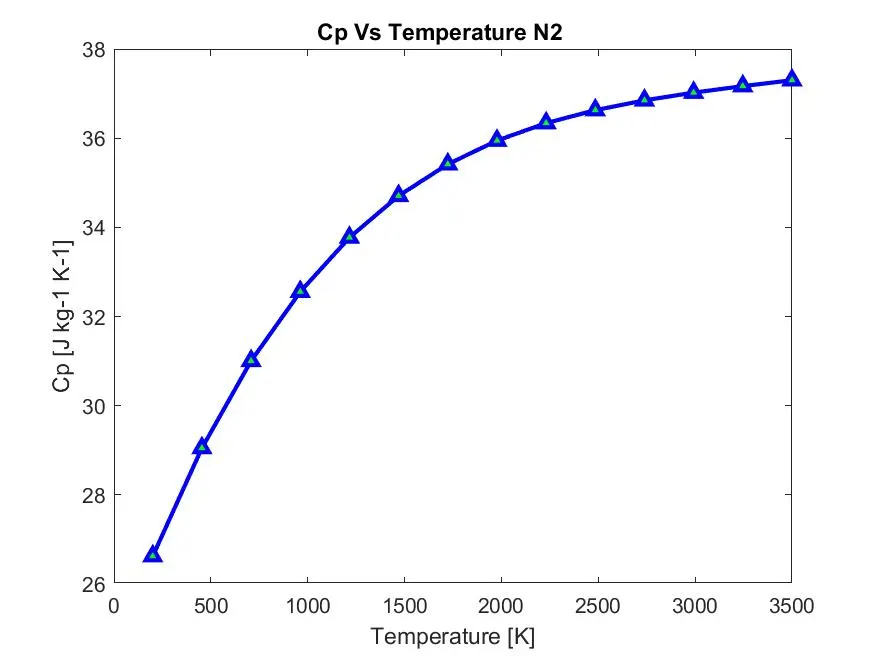
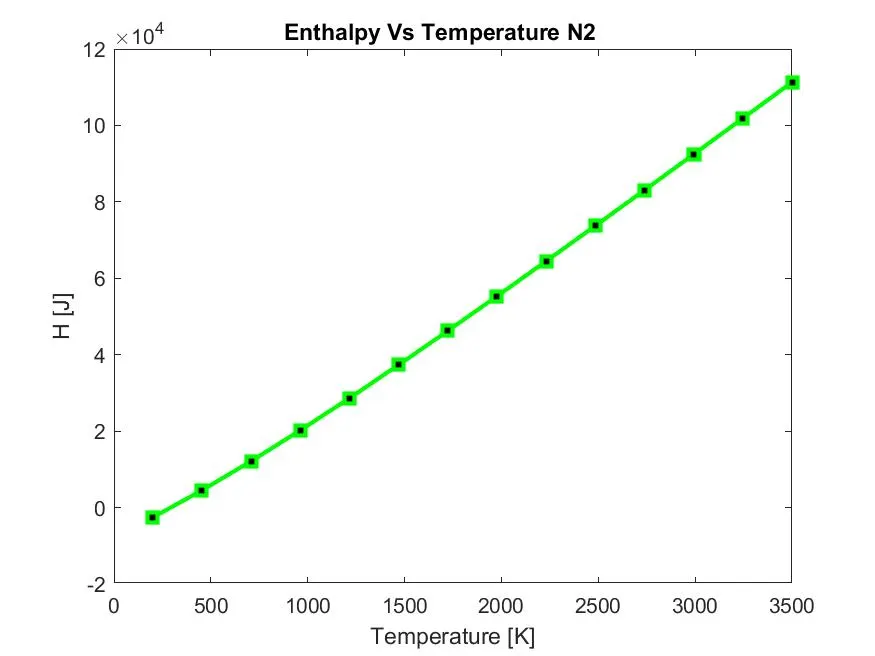
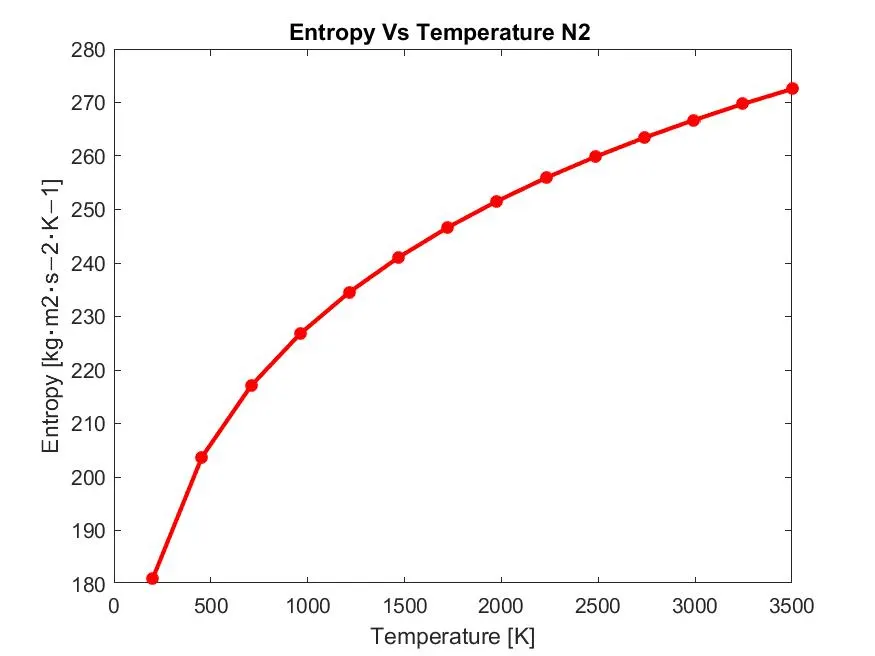
4.Thermodynamic Properties for CO2.
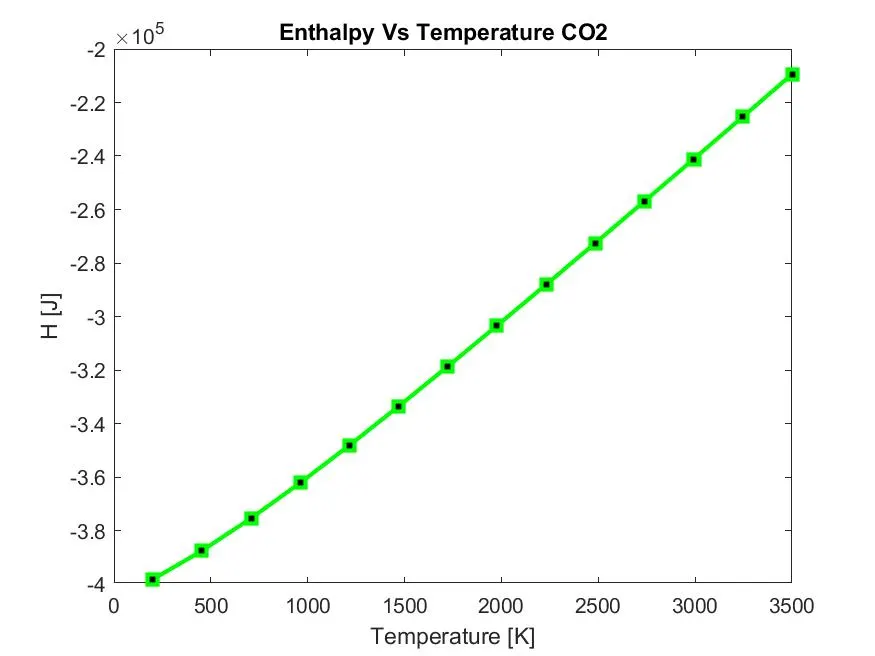
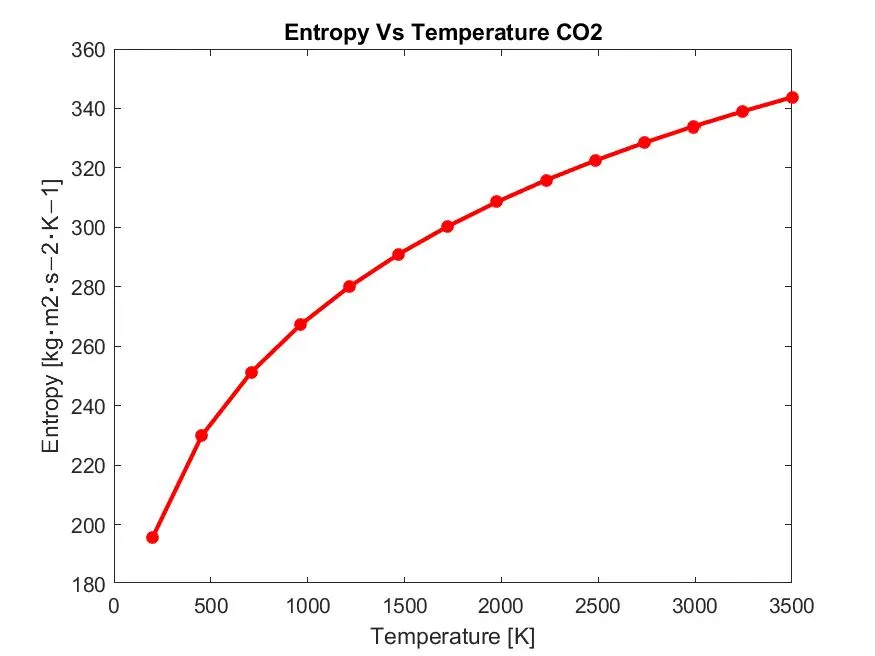
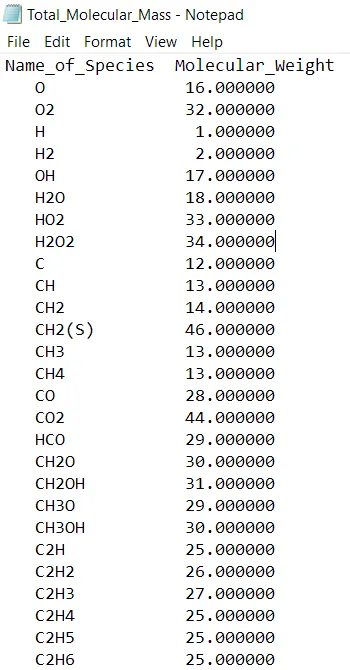
MOLECULAR MASS OUTPUT
Sample output is shown.
CONCLUSION:
- File parsing for the thermodynamic properties using the input ‘dat’ file is done and thermodynamic properties for individual molecules are evaluated and variation with temperature are plotted for individual species.
- Molecular mass of all the species were evaluated
- A automated process is established to read several such files and carry out the calculations and plotting just by chaning the name of input file.