This project serves as a comprehensive guide to the NASA Polynomial Coefficients Database, offering an insightful exploration into the methodology behind the development of these polynomial expressions and the inherent value they bring to the scientific community. By providing detailed information on the coefficients associated with each chemical species, this resource empowers researchers to incorporate accurate thermodynamic data into their simulations, analyses, and experimental designs.
Through this documentation, NASA aims to foster collaboration, innovation and advancements in the understanding of chemical thermodynamics, contributing to the collective pursuit of knowledge in the scientific community.
Function code :
1. Specific heat :
function Cp = Specificheat(a1,a2,a3,a4,a5,a8,a9,a10,a11,a12,Temp,R,global_medium_temp)
% Comparing with global temperature
% If less than global temperature - minimum coefficients are taken
if Temp <= global_medium_temp
Cp = R*(a8 + (a9*Temp) + (a10*(Temp).^2) + (a11*(Temp).^3) + (a12*(Temp).^4));
else
Cp = R*(a1 + (a2*Temp) + (a3*(Temp).^2) + (a4*(Temp).^3) + (a5*(Temp).^4));
% Else maximum coefficients are taken
end
2. Enthalpy :
function H = Enthalpy(a1,a2,a3,a4,a5,a6,a8,a9,a10,a11,a12,a13,Temp,R,global_medium_temp)
% Comparing with global temperature
% If less than global temperature - minimum coefficients are taken
if Temp <= global_medium_temp
H = R*Temp.*(a8 + ((a9*Temp)/2) + ((a10*(Temp).^2)/3) + ((a11*(Temp).^3)/4) + ((a12*(Temp).^4)/5) +((a13./Temp)));
else
% Else maximum coefficients are taken
H = R*Temp.*(a1 + ((a2*Temp)/2) + ((a3*(Temp).^2)/3) + ((a4*(Temp).^3)/4) + ((a5*(Temp).^4)/5) +((a6./Temp)));
end
3. Entropy :
function S = Entropy_calc(a1,a2,a3,a4,a5,a7,a8,a9,a10,a11,a12,a14,Temp,R,global_medium_temp)
% Comparing with global temperature
% If less than global temperature - minimum coefficients are taken
if Temp <= global_medium_temp
S = R.*(a8.*log(Temp) + (a9.*Temp) + (a10*((Temp).^2)/2) + (a11*((Temp).^3)/3) + (a12*((Temp).^4)/4) + a14);
else
% Else - maximum coefficients are taken
S = R.*(a1.*log(Temp) + (a2.*Temp) + (a3*((Temp).^2)/2) + (a4*((Temp).^3)/3) + (a5*((Temp).^4)/4) + a7);
end
4. Molecular wieght :
function Molecularweight = Molecular_weight(Species_SP)
% Standard - Atomic Name
atomic_name = ['H','C','O','N','A'];
% Hydrogen, Carbon, Oxygen, Nitrogen, Argon
fprintf('Molecular Weight of ');
fprintf(Species_SP);
fprintf(' : ');
% Standard Atomic Number
Atomic_Weight = [1.008 12.011 15.999 14.007 39.948];
% Starting Range of Molecule
Molecularweight = 0;
% Adding Atomic number to obtain particular value
for i = 1:length(Species_SP)
for j = 1:length(atomic_name)
if strcmpi(Species_SP(i),atomic_name(j))
Molecularweight = Molecularweight +Atomic_Weight(j);
position = j;
end
end
n = str2num(Species_SP(i));
if n>1
Molecularweight = Molecularweight + Atomic_Weight(position)*(n-1);
end
end
fprintf('molecular weight %s :',Species_SP);
fprintf('%d',Molecularweight);
disp(' ');
end
Matlab code :
clear all
close all
clc
% Create a directory named 'NASA File Parsing' on the desktop
mkdir 'C:\Users\Admin\Desktop\NASA File Parsing'
% Open the THERMO.dat file for reading
f1=fopen('THERMO.dat','r');
% Read the first line of the file
gt=fgetl(f1);
% Obtain temperature information from the header
global_temp=fgetl(f1);
t=strsplit(global_temp);
global_low_temp=str2num(t{2});
global_medium_temp=str2num(t{3});
global_high_temp=str2num(t{4});
% Temperature range & Gas Constant
Temp=linspace(global_low_temp,global_high_temp,1000);
R = 8.314; % Universal Gas Constant J/(mol-K)
% Skip three comment lines in the file
for i = 1:3
gt=fgetl(f1);
end
% Loop through 53 species in the file
for i = 1:53
gt=fgetl(f1);
A=strsplit(gt,' ');
Species_SP=(A{1});
% Read the first line of coefficients for high-temperature range
line_1=fgetl(f1);
a=strfind(line_1,'E');
% Extract coefficients for high-temperature range
a1=str2num(line_1(1:a(1)+3));
a2=str2num(line_1(a(1)+4:a(2)+3));
a3=str2num(line_1(a(2)+4:a(3)+3));
a4=str2num(line_1(a(3)+4:a(4)+3));
a5=str2num(line_1(a(4)+4:a(5)+3));
a6=str2num(line_1(a(5)+4:a(6)+3));
a7=str2num(line_1(a(6)+4:a(7)+3));
% Read the second line of coefficients for low-temperature range
line_2=fgetl(f1);
b=strfind(line_2,'E');
% Extract coefficients for low-temperature range
a8=str2num(line_2(b(7)+4:b(8)+3));
a9=str2num(line_2(b(8)+4:b(9)+3));
a10=str2num(line_2(b(9)+4:b(10)+3));
% Read the third line of coefficients for additional properties
line_3=fgetl(f1);
c=strfind(line_3,'E');
% Extract additional coefficients
a11=str2num(line_3(c(10)+4:c(11)+3));
a12=str2num(line_3(c(11)+4:c(12)+3));
a13=str2num(line_3(c(12)+4:c(13)+3));
a14=str2num(line_3(c(13)+4:c(14)+3));
% Calculate Specific Heat (Cp), Enthalpy (H), and Entropy (S)
Cp = Specificheat(a1,a2,a3,a4,a5,a8,a9,a10,a11,a12,Temp,R,global_medium_temp);
H = Enthalpy(a1,a2,a3,a4,a5,a6,a8,a9,a10,a11,a12,a13,Temp,R,global_medium_temp);
S = Entropy_calc(a1,a2,a3,a4,a5,a7,a8,a9,a10,a11,a12,a14,Temp,R,global_medium_temp);
% Calculate molecular weight of species
Molecularweight(i) = Molecular_weight(Species_SP);
% Write Molecular weight to a file
Molecular_list = fopen('Molecular weight.txt','a+');
fprintf(Molecular_list,'Molecular weight of %s is %d \n',Species_SP,Molecularweight);
fclose(Molecular_list);
% Create a directory for each species and save plots
cur_dir=pwd;
mkdir(Species_SP);
cd(Species_SP);
% Plot Specific Heat vs Temperature
figure(1)
plot(Temp,Cp,'linewidth',2,'color','r');
xlabel('Temperature [K]');
ylabel('Specific Heat [kJ]');
title(sprintf('Varying Specific Heat with Temperature Range of %s',Species_SP));
grid on
saveas(figure(1),'Specific Heat.jpg');
% Plot Enthalpy vs Temperature
figure(2)
plot(Temp,H,'linewidth',2,'color','g');
xlabel('Temperature [K]');
ylabel('Enthalpy [kJ/(mol)]');
title(sprintf('Varying Enthalpy with Temperature Range of %s',Species_SP));
grid on
saveas(figure(2),'Enthalpy.jpg');
% Plot Entropy vs Temperature
figure(3)
plot(Temp,S,'linewidth',2,'color','b');
xlabel('Temperature [K]');
ylabel('Entropy [kJ/(mol-K)]');
title(sprintf('Varying Entropy with Temperature Range of %s',Species_SP));
grid on
saveas(figure(3),'Entropy.jpg');
% Return to the original directory
cd(cur_dir);
% Write molecular weight to a file
M = Molecular_weight(Species_SP);
f2 = fopen('molecular mass','w');
fprintf(f2,'%s \t %s \t %f \n','species','Molecular mass',M);
fclose(f2);
end
Command window showing molecular weights of the species :
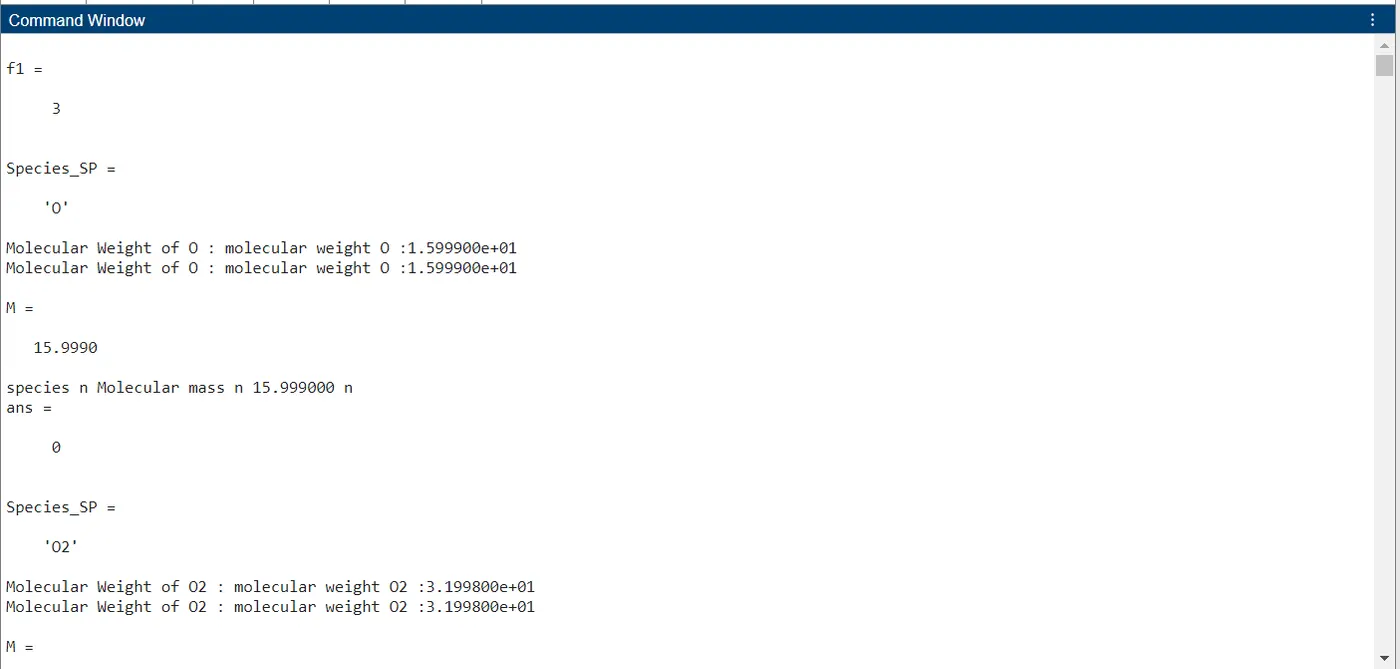
Link for result for molecular weight of all the species :
https://drive.google.com/file/d/1bOfaDLTxhRfmIkPvnJani3DRs_NmNb8v/view?usp=sharing
Folder containing plots of all the species :

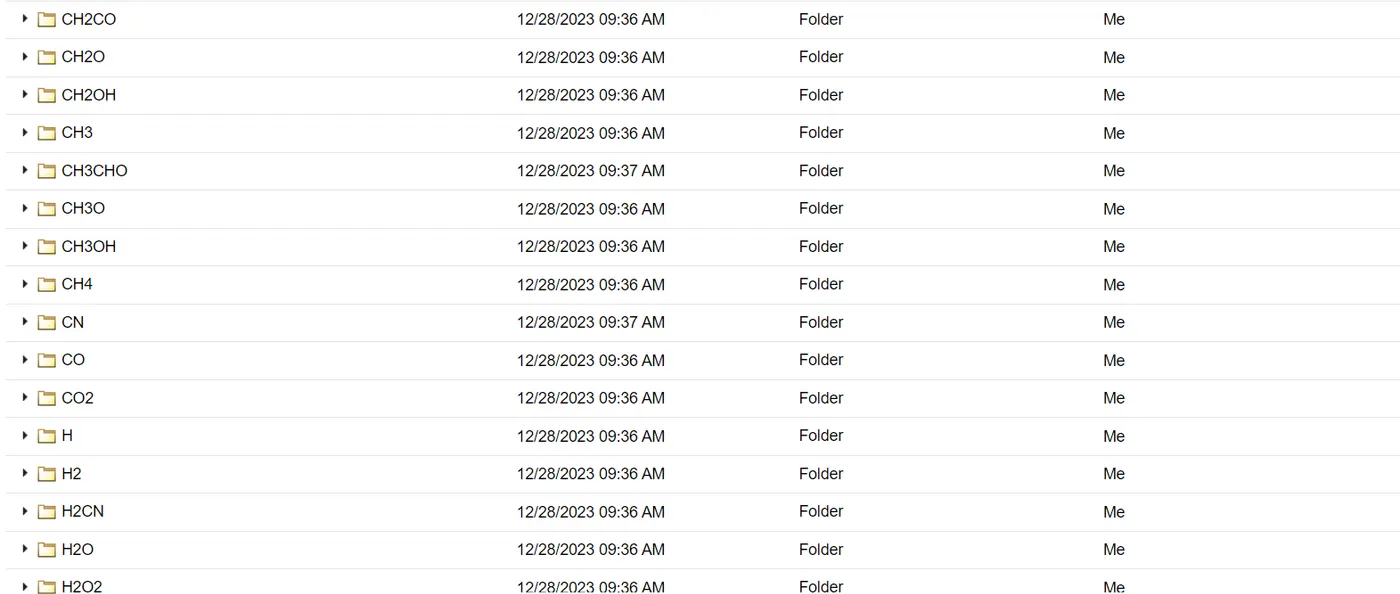

Plots :
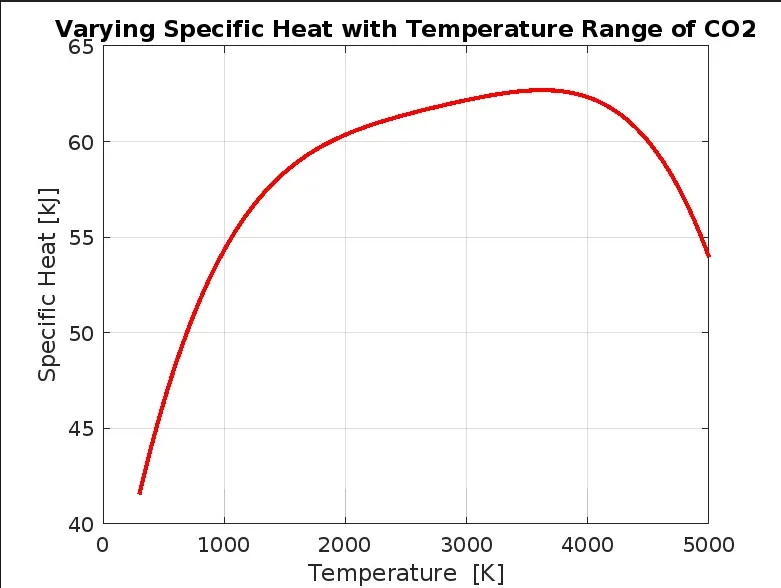
Specific heat plot for CO2
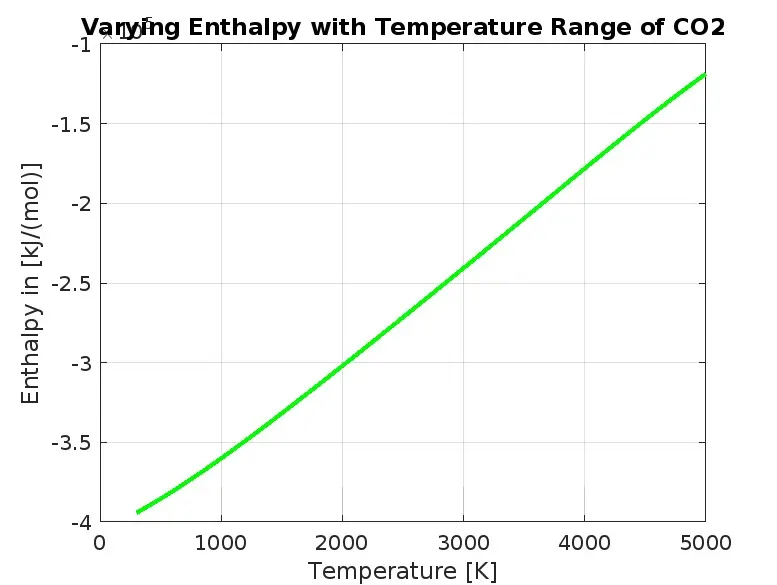
Enthalpy plot for CO2
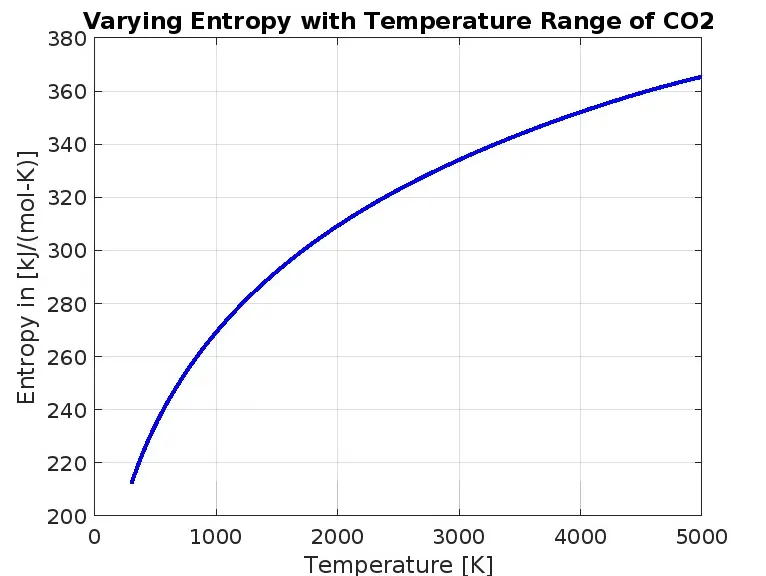
Entropy plot for CO2
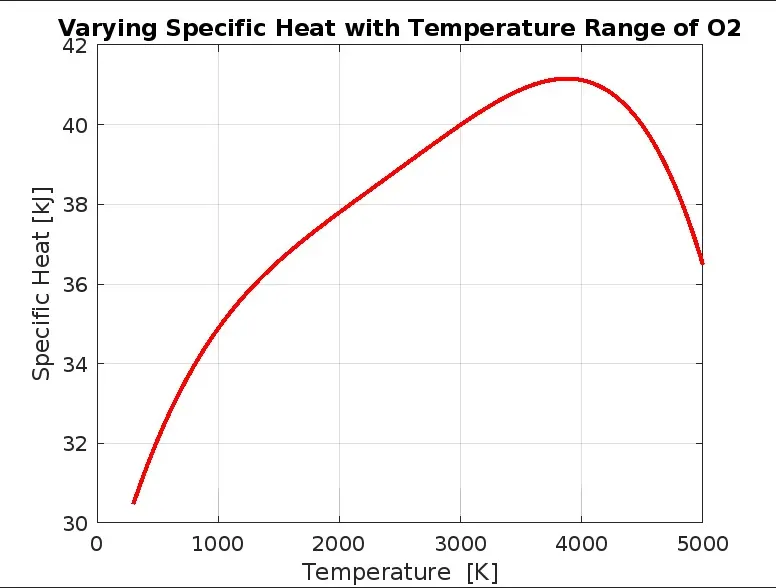
Specific plot for O2
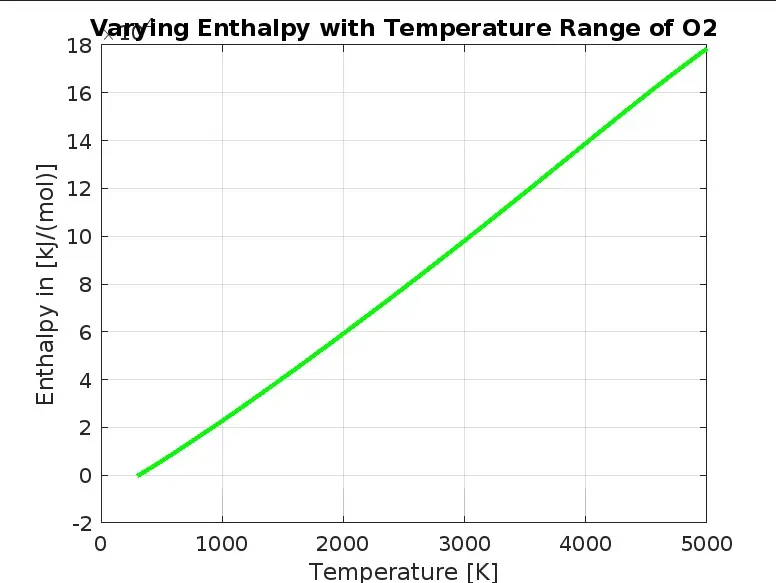
Enthalpy plot for O2
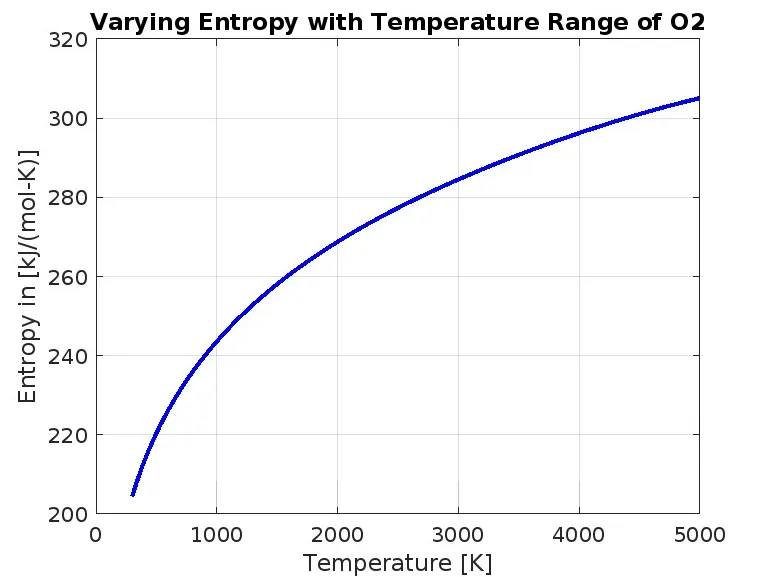
Entropy plot for O2
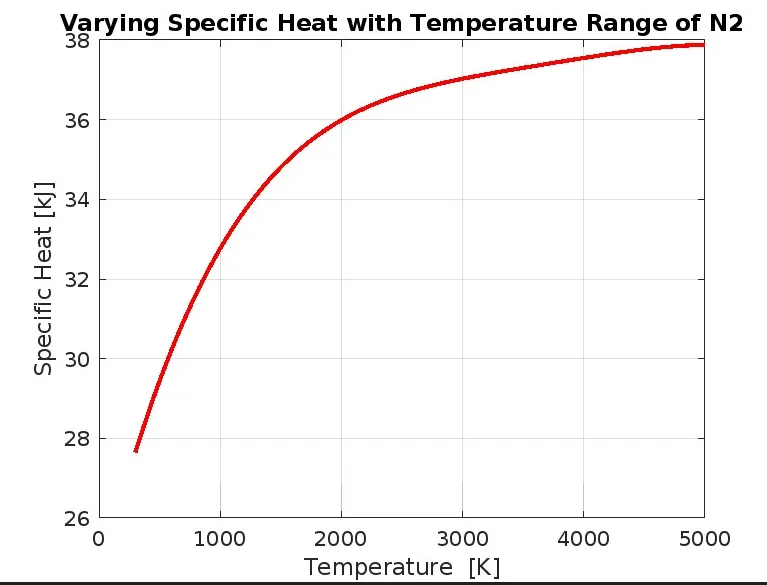
Specific plot for N2
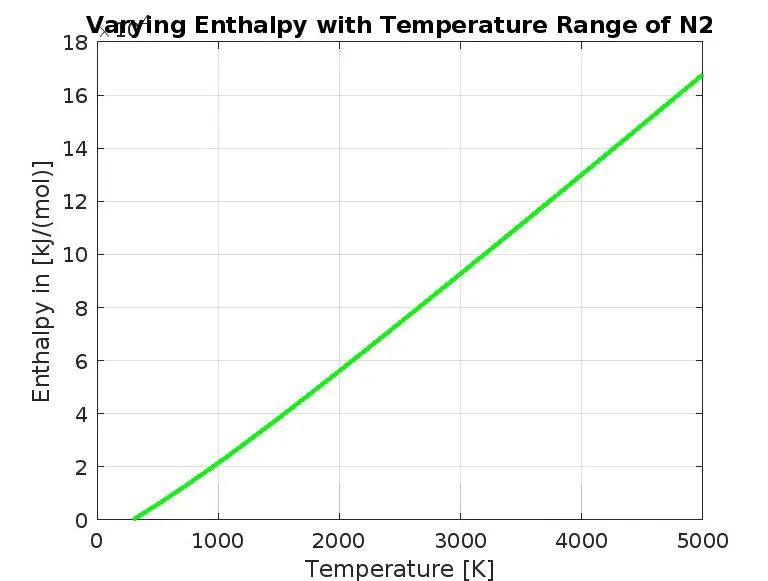
Enthalpy plot for N2
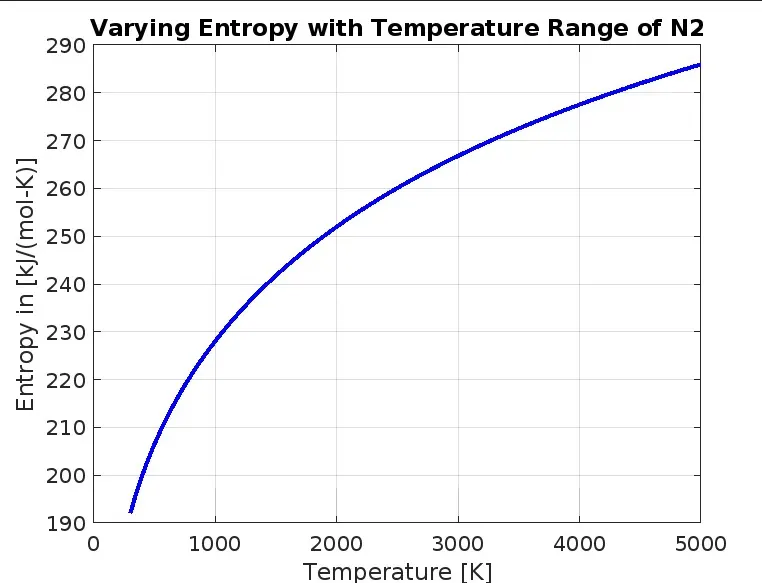
Entropy plot for N2
Observations :
1. CO2 (Carbon Dioxide):
Specific Heat (Cp) vs. Temperature:
- CO2's specific heat might exhibit distinct features due to its molecular structure, potentially showing variations with temperature changes.
Enthalpy (H) vs. Temperature:
- The enthalpy plot for CO2 could show more complexity compared to diatomic gases, potentially indicating phase transitions.
Entropy (S) vs. Temperature:
- CO2's entropy plot may demonstrate a distinctive behavior, especially around phase transition temperatures.
- Changes in entropy would reflect the molecular disorder associated with temperature variations.
2. O2 (Oxygen):
Specific Heat (Cp) vs. Temperature:
- O2's specific heat typically shows a characteristic behavior with increasing temperature.
- There might be a noticeable increase in specific heat as temperature rises, indicating increased energy absorption.
Enthalpy (H) vs. Temperature:
- The enthalpy plot for O2 is expected to exhibit a gradual rise with increasing temperature.
- Enthalpy reflects the heat content of the system, and for O2, this would increase with temperature.
Entropy (S) vs. Temperature:
- The entropy plot may show an increasing trend with temperature, representing the dispersal of energy as the system heats up.
- Higher temperatures might result in higher entropy values for O2.
3. N2 (Nitrogen):
Specific Heat (Cp) vs. Temperature:
- Similar to O2, N2's specific heat is likely to increase with temperature.
- Nitrogen's molecular structure may influence the rate of change in specific heat with temperature.
Enthalpy (H) vs. Temperature:
- Enthalpy for nitrogen should exhibit a gradual increase with rising temperatures.
- The plot reflects the heat content associated with the phase transitions and temperature changes.
Entropy (S) vs. Temperature:
- Nitrogen's entropy may follow an increasing trend with temperature.
- The plot would showcase the degree of disorder or randomness in the molecular structure of nitrogen.