Project 1 - Parsing NASA thermodynamic data
The NASA polynomials formulae are shown below -
Cp/R = a1 + a2 T + a3 T^2 + a4 T^3 + a5 T^4
H/RT = a1 + a2 T /2 + a3 T^2 /3 + a4 T^3 /4 + a5 T^4 /5 + a6/T
S/R = a1 lnT + a2 T + a3 T^2 /2 + a4 T^3 /3 + a5 T^4 /4 + a7
Here,
R is the universal gas constant,
T is the temeprature,
Cp is Specific heat,
H is Enthalpy,
S is Entropy
FUNCTION CODE FOR SPECIFIC HEAT:
%Specific heat calculation function

function Cp = specific_heat(a1,a2,a3,a4,a5,a8,a9,a10,a11,a12,Temp,R,global_medium_temp)

%Comparing with global temperature
%if less than global temperature then minimum coffcients are taken
if Temp<=global_medium_temp
    Cp = R.*(a8+(Temp*(a9))+(Temp*(a10).^2)+(Temp*(a11).^3)+(Temp*(a12).^4));
%else maximum coffcients are taken
else
    Cp = R.*(a1+(Temp*(a2))+Temp*((a3).^2)+(Temp*(a4).^3)+(Temp*(a5).^4));
end
FUNCTION CODE FOR ENTHALPY:
%Enthalpy calculation function

function H = Enthalpy(a1,a2,a3,a4,a5,a6,a8,a9,a10,a11,a12,a13,Temp,R,global_medium_temp)

%Comparing with global temperature
%if less than global temperature then minimum coffcients are taken
if Temp<=global_medium_temp
    H = R*Temp.*(a8+(Temp*(a9))+((Temp*(a10).^2)/2)+((Temp*(a11).^3)/3)+((Temp*(a12).^4)/4)+(a13./Temp));
%else maximum coffcients are taken
else
    H = R*Temp.*(a1+(Temp*(a2))+((Temp*(a3).^2)/2)+((Temp*(a4).^3)/3)+((Temp*(a5).^4)/4)+(a6./Temp));
end
FUNCTION CODE FOR ENTROPY:
%Entropy calculation function

function S = Entropy(a1,a2,a3,a4,a5,a7,a8,a9,a10,a11,a12,a14,Temp,R,global_medium_temp)

%Comparing with global temperature
%if less than global temperature then minimum coffcients are taken
if Temp<=global_medium_temp
    S = R.*(a8.*log(Temp)+(Temp*(a9))+((Temp*(a10).^2)/2)+((Temp*(a11).^3)/3)+((Temp*(a12).^4)/4)+a14);
%else maximum coffcients are taken
else
    S = R.*(a1.*log(Temp)+(Temp*(a2))+((Temp*(a3).^2)/2)+((Temp*(a4).^3)/3)+((Temp*(a5).^4)/4)+a7);
end
FUNCTION CODE FOR MOLECULAR WEIGHT:
%Molecular weight calculation fuction

function Molecularweight = Molecular_weight(Species_SP)

atomic_name = ['H','C','O','N','A'];
%Hyderogen Oxygen Carbon Nitrogen Argon
fprintf('Molecular weight of %s : ',Species_SP);

%Standard atomic number
atomic_weight = [1.008 12.011 15.999 14.007 39948];
%starting range of molecule
Molecularweight = 0;

%adding atomic number to obtain perticular value
for i=1:length(Species_SP)
    for j=1:length(atomic_name)
        if strcmpi(Species_SP(i),atomic_name(j))
            Molecularweight = Molecularweight+atomic_weight(j);
            position = j;
        end
    end
    n= str2num(Species_SP(i));

    if n>1
        Molecularweight = Molecularweight+atomic_weight(position);
    end
end

fprintf('Molecular weight of %s : ',Species_SP);
fprintf('%d',Molecularweight);
disp(' ');
MAIN PROGRAM:
clear all
close all
clc

%  Reading Data file - NASA Thermodynamic
% Open a file reading ('r')
f1=fopen('THERMO.dat','r')
gt=fgetl(f1);

% Obtaining Temperatures by Reading Header Information
global_temp=fgetl(f1);

% Spliting the strings
t=strsplit(global_temp);

% Converting string cells to numbers using str2num
global_low_temp = str2num(t{2});
global_medium_temp = str2num(t{3});
global_high_temp = str2num(t{4});

% Dividing the Temperature Range in 100o numbers
temp=linspace(global_low_temp,global_high_temp,1000);

% Universal Gas Constant J/(mol-K)
R = 8.314;

% skipping three lines in the file
for i = 1:3
    gt=fgetl(f1);
end

 for i = 1:53
gt=fgetl(f1);
A=strsplit(gt,' ');
Species_SP=(A{1});

line_1=fgetl(f1);
a=strfind(line_1,'E');

% Extracting higher and lower temperature coefficients

% Extracting first 7 coefficients - HIGH-temperature coefficients
a1=line_1(1:a(1)+3);
a1=str2num(a1);              %1
a2=line_1(a(1)+4:a(2)+3);
a2=str2num(a2) ;             %2
a3=line_1(a(2)+4:a(3)+3);
a3=str2num(a3)  ;            %3
a4=line_1(a(3)+4:a(4)+3);
a4=str2num(a4);              %4
a5=line_1(a(4)+4:a(5)+3);
a5=str2num(a5)  ;            %5

line_2=fgetl(f1);
b=strfind(line_1,'E');
a6=line_2(1:b(1)+3);
a6=str2num(a6)  ;            %6
a7=line_2(a(1)+4:b(2)+3);
a7=str2num(a7);              %7

 % Extracting second 7 coefficients -  low temperature coefficients
a8=line_2(b(2)+4:b(3)+3);
a8=str2num(a8);              %8
a9=line_2(b(3)+4:b(4)+3);
a9=str2num(a9) ;             %9
a10=line_2(b(4)+4:b(5)+3);
a10=str2num(a10) ;           %10

line_3=fgetl(f1);
c=strfind(line_1,'E');

a11=line_3(1:c(1)+3);
a11=str2num(a11);               %11
a12=line_3(c(1)+4:c(2)+3);
a12=str2num(a12);               %12
a13=line_3(c(2)+4:c(3)+3);
a13=str2num(a13);               %13
a14=line_3(c(3)+4:c(4)+3);
a14=str2num(a14);               %14

    % Specific heat calculation
    Cp = specific_heat(a1,a2,a3,a4,a5,a8,a9,a10,a11,a12,temp,R,global_medium_temp);

    % Enthalpy calculation
    H = Enthalpy(a1,a2,a3,a4,a5,a6,a8,a9,a10,a11,a12,a13,temp,R,global_medium_temp);

    % Entropy calculation
    S = Entropy(a1,a2,a3,a4,a5,a7,a8,a9,a10,a11,a12,a14,temp,R,global_medium_temp);

    % Calculating molecular weight of species
    Molecularweight(i) = Molecular_weight(Species_SP);

    % Read & Write Molecular list
     Molecular_list = fopen('Molecular weight.txt','a+');
         fprintf( Molecular_list,'Molecular weight of %s is %d \n',Species_SP,Molecularweight);
         fclose(Molecular_list);

     % plotting(CP,H,S,Temp,Species_SP)
     % Saving as a folder

       cur_dir=pwd;
       cd(Species_SP);

     % Plot 1, Specific heat vs Temperature

        figure(1)
        plot(temp,Cp,'linewidth',2,'color','r');
        xlabel('Temperature  [K]');
        ylabel('Specific Heat [kJ]');
        title(sprintf('Specific heat vs Temperature of %s',Species_SP));
        grid on
        saveas(figure(1),'Specific Heat.jpg');

        % Plot 2, Enthalpy vs Temperature

        figure(2)
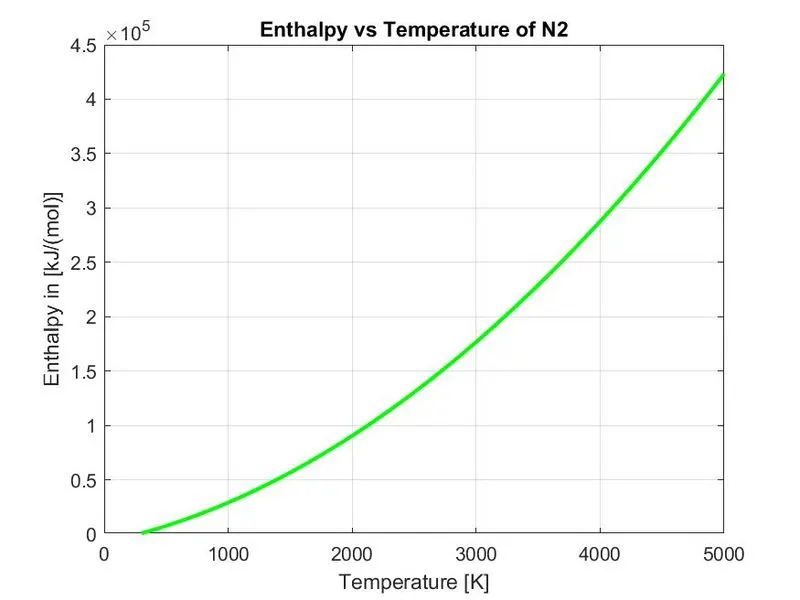
        plot(temp,H,'linewidth',2,'color','g');
        xlabel('Temperature [K]');
        ylabel('Enthalpy in [kJ/(mol)]');
        title(sprintf('Enthalpy vs Temperature of %s',Species_SP));
        grid on
        saveas(figure(2),'Ethalpy.jpg');

        % Plot 3, Entropy vs Temperature

        figure(3)
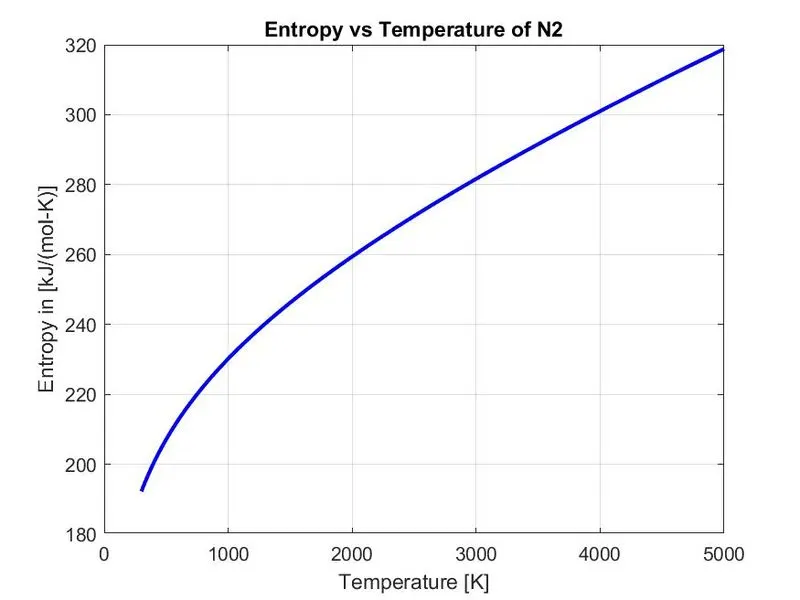
        plot(temp,S,'linewidth',2,'color','b');
        xlabel('Temperature [K]');
        ylabel('Entropy in [kJ/(mol-K)]');
        title(sprintf('Entropy vs Temperature of %s',Species_SP));
        grid on
        saveas(figure(3),'Entropy.jpg');

        cd(cur_dir);

        % Molecular weight

        M = Molecular_weight(Species_SP)
        f2 = fopen('molecular mass','w');
        fprintf('%s n %s n %f n','species','Molecular mass',M);
        fclose(f2)
end
Code Explanation:
- First I read the text file 'Thermo.dat' file and opening and reading it by using ‘fopen’, 'r'.
- ‘fgetl’ is used to read the line.
- ‘strsplit’ command is used to split the temperature into a particular string cell from the Thermo.dat file
- ‘str2num’ used for converting string cell to numbers.
- Temperature is converted from string to a number so that temperature values can be used separately to solve the NASA thermodynamics.
- ‘for' loop used to skip the next three lines in the text file.
- Specific heat(cp), enthalpy(H), and entropy(S), with temperature values, and to find the molecular weights for all the 53 species.
- ‘for’ loop used to read 53 species.
- ‘strfind’ command used to find string.
- 'linspace' used to specified the temperature range from low to high.
- Universal gas constant value ‘R’ is defined.
- Extracted higher and lower temperature coefficient by reading line by line from the species.
- Calling specific heat, enthalpy, entropy function codes and Molecular weight.
- Calculating Molecular weight.
OUTPUT:
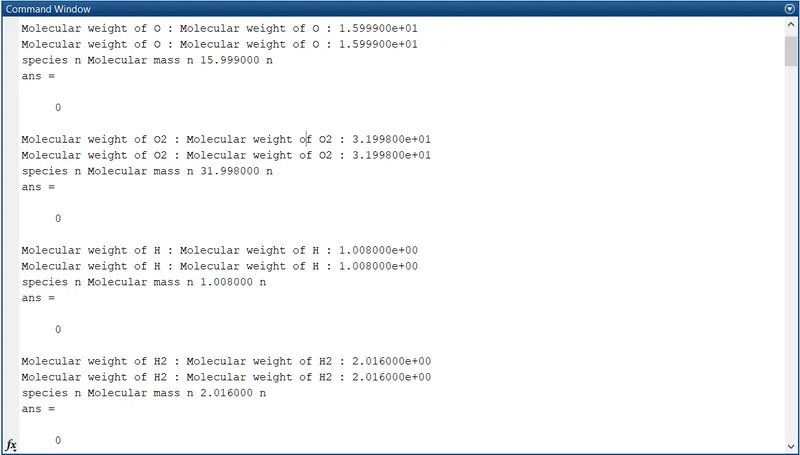
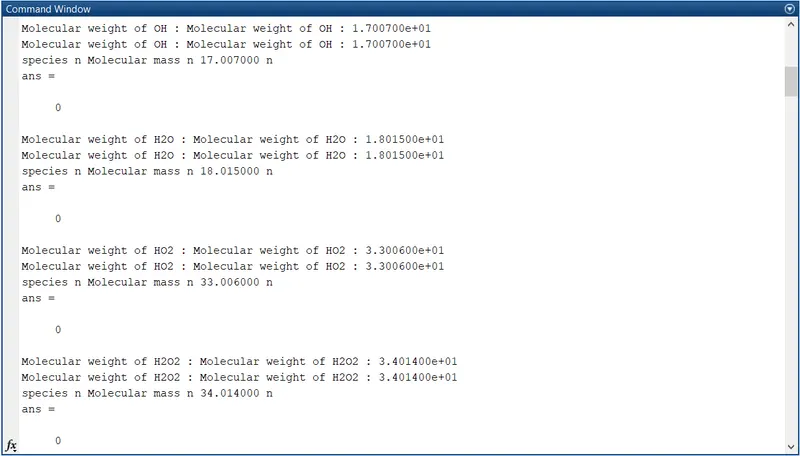
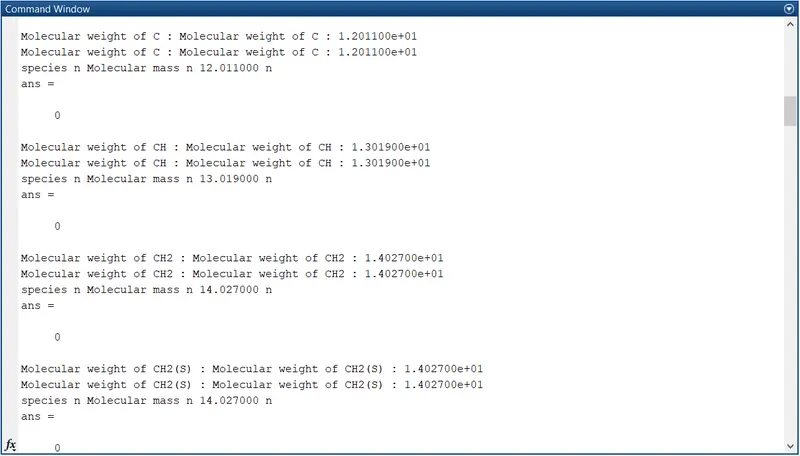
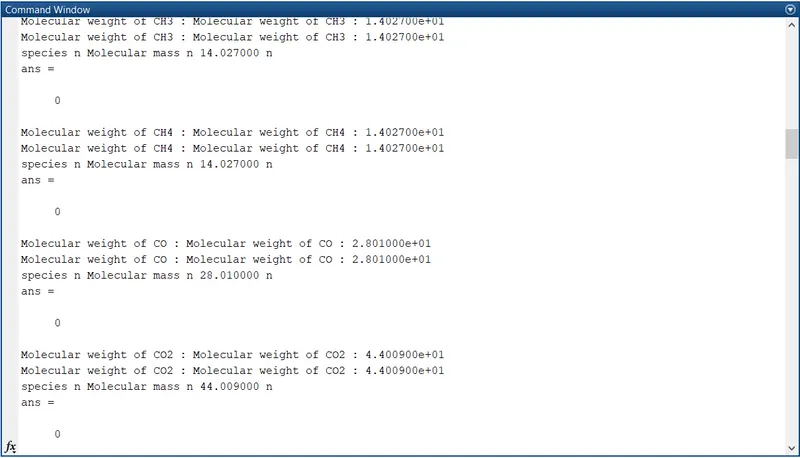
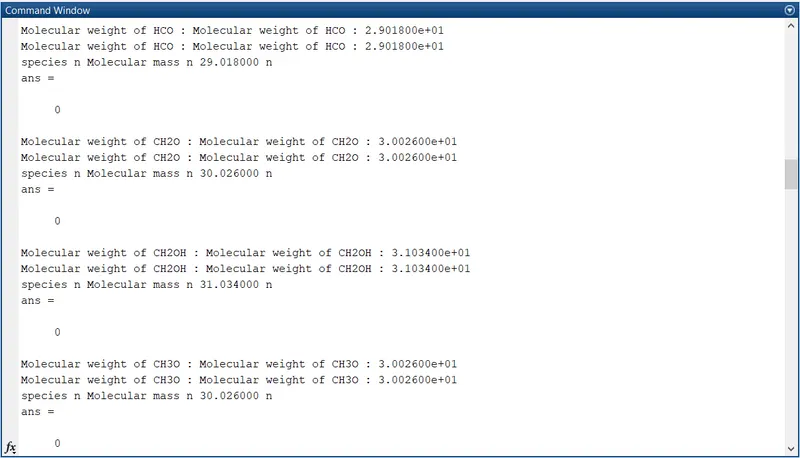
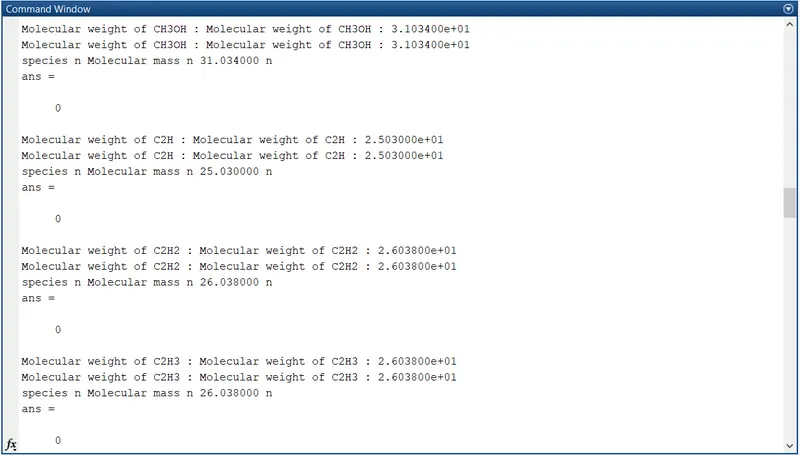
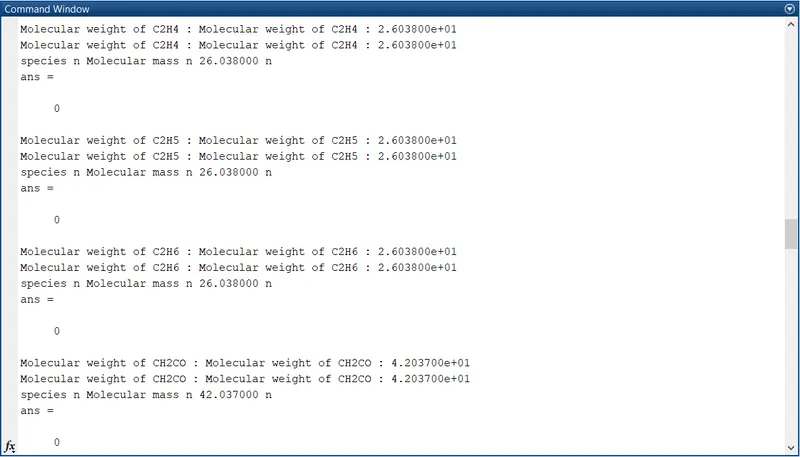
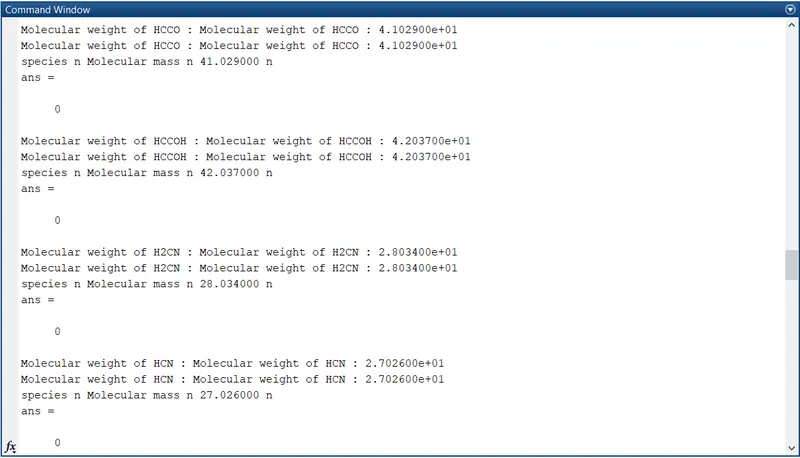
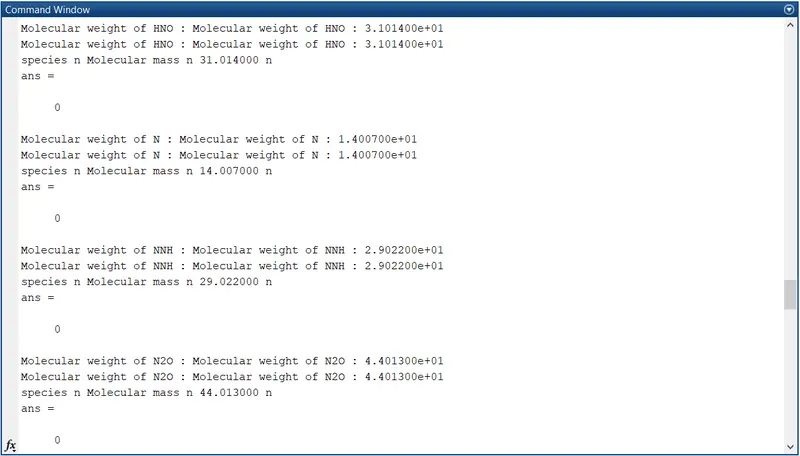
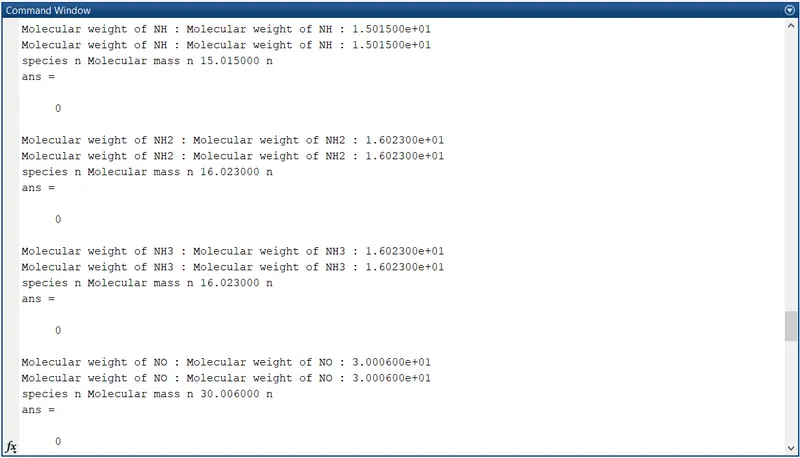
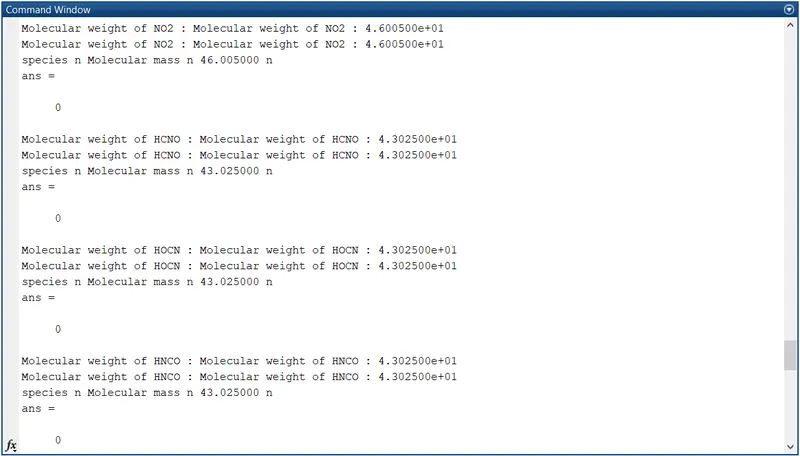
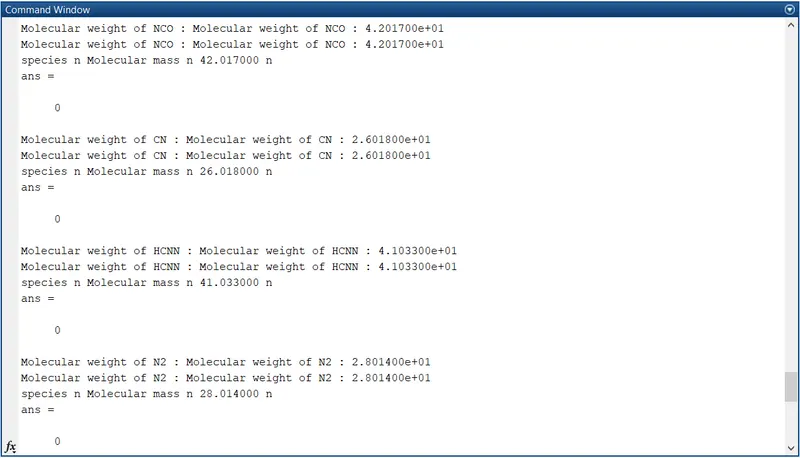
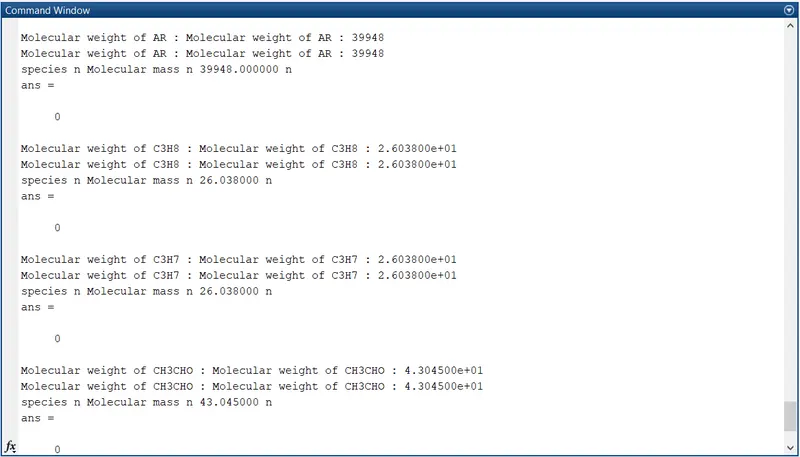

Results:
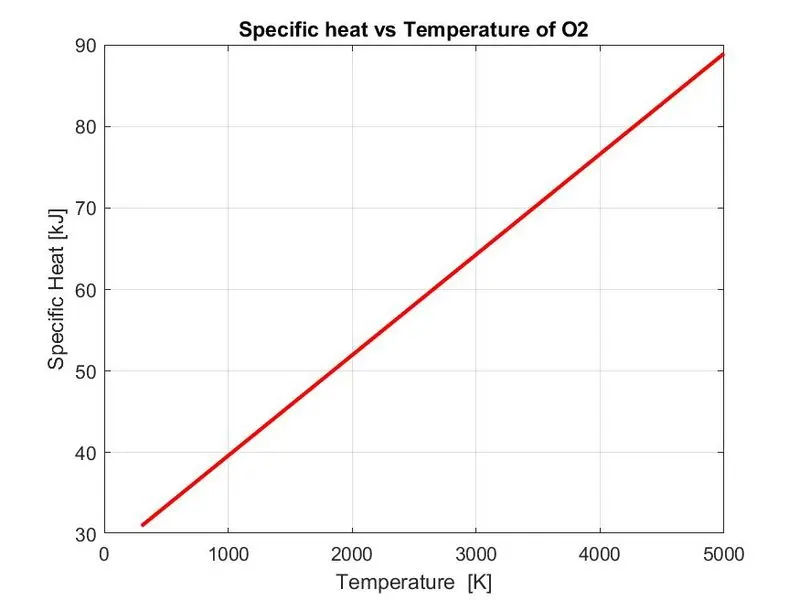
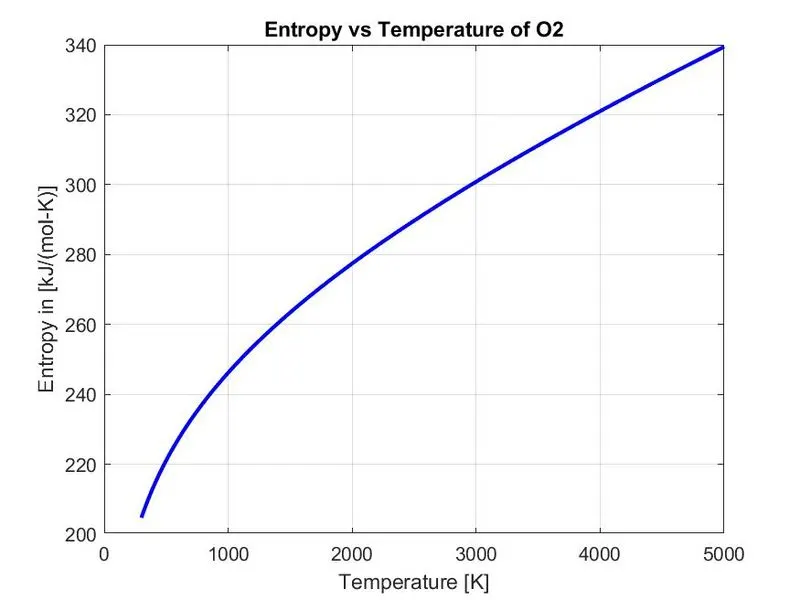
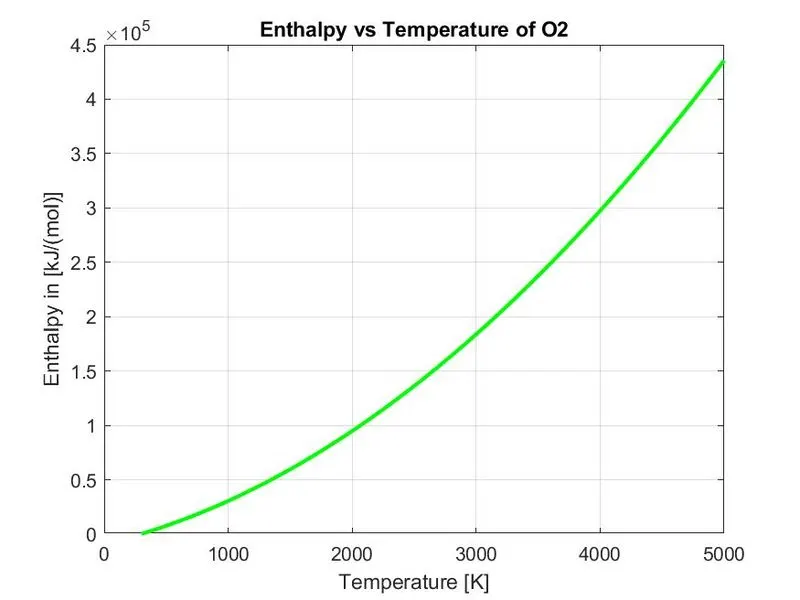
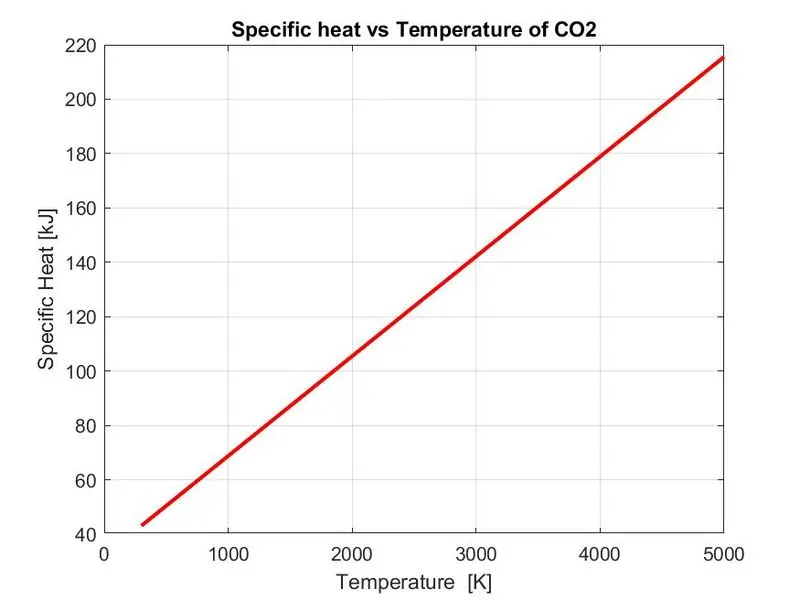
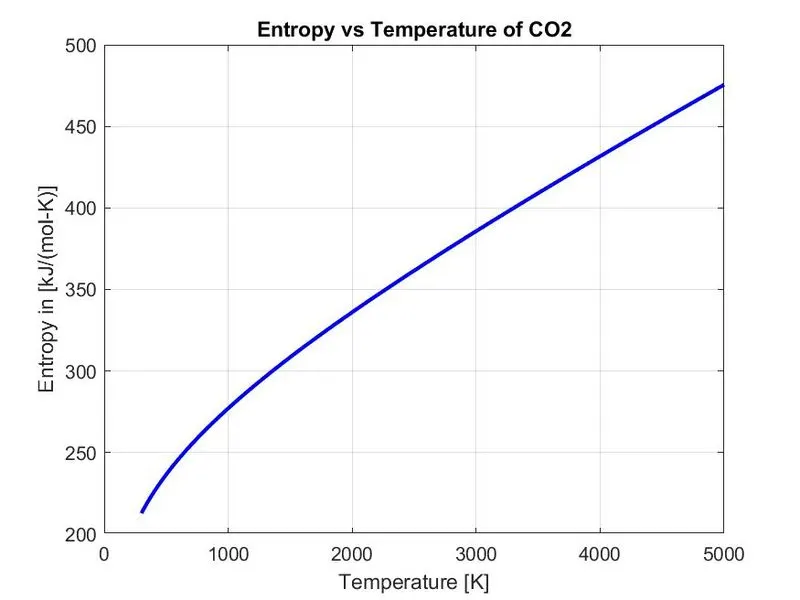
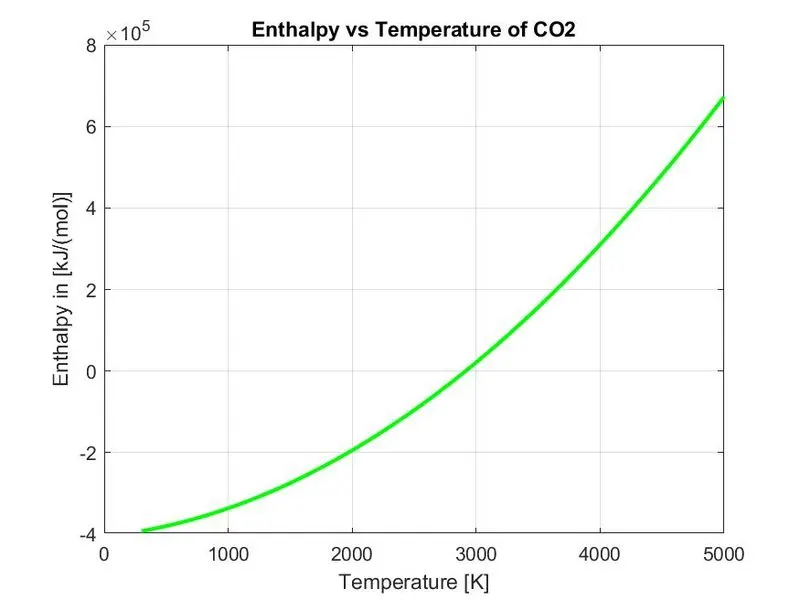
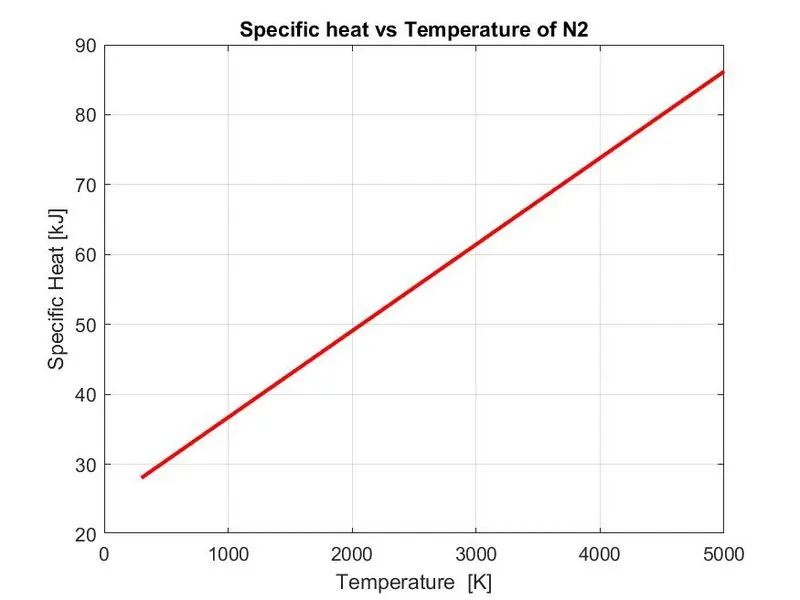
Specific Heat, Entropy and Enthalpy Plots for O2, N2 and CO2 :
Plots for O2:
Plots for CO2:
Plots for N2
Screenshot of the window where all the folders are saved:

Conclusion :
The necessary coefficients are are extracted from NASA thermodynamic data file required to evaluate various thermodynamic parameters for different species. The specific heat, entropy and enthalpy for all the species are calculated and plotted against the local temperature range. The molecular weight for all the species is calculated .