Project 1 - Parsing NASA thermodynamic data
Code for calling Moleculer weight
% Function for Moleculer weight

function Moleculer_Weight=wt(name_ofthe_species)

Elements=['H','C','N','O','A','S'];
Atomic_weight=[1 12 16 14 40 32];    % Atomic weight of elements
species=upper(name_ofthe_species)    % upper is an inbuilt command

Moleculer_Weight=0;

for i=1:length(name_ofthe_species)
    for j=1:length(Elements)

        if strcmp(name_ofthe_species(i),Elements(j))
            Moleculer_Weight=Moleculer_Weight+Atomic_weight(j);
            k=j;
        else
            n=str2double(name_ofthe_species(i));
            if (n>1)
                Moleculer_Weight=Moleculer_Weight+Atomic_weight(k)*(n-1);
                break
            end
        end
    end
end
end
Code for calling Enthalpy
% Function for Enthalpy

function H=Enthalpy(a1,a2,a3,a4,a5,a6,a8,a9,a10,a11,a12,a13,T,R,mid_temp);

% calculating the enthalpy for lower and higher temp respectively

if(T<=mid_temp)
    H=R*((a8*T)+((a9*(T).^2)/2)+((a10*(T).^3)/3)+((a11*(T).^4)/4)+((a12*(T).^5)/5)+a13);
else
    H=R*((a1*T)+((a2*(T).^2)/2)+((a3*(T).^3)/3)+((a4*(T).^4)/4)+((a5*(T).^5)/5)+a6);

end
end
Code for calling Entropy
% Function for Entropy

function S=Entropy(a1,a2,a3,a4,a5,a7,a8,a9,a10,a11,a12,T,R,mid_temp);

% calculating lower and higher temperature.

if(T<=mid_temp);
    S=R*(a8.*log(T)+(a9*T)+((a10*(T).^2)/2)+((a11*(T).^3)/3)+((a12*(T).^4)/4))
else
    S=R*(a1.*log(T)+(a2*T)+((a3*(T).^2)/2)+((a4*(T).^3)/3)+((a5*(T).^4)/4)+a7)


end
end
Code for calling specific heat
% calculate specific heat.

function Cp=specific_heat(a1,a2,a3,a4,a5,a8,a9,a10,a11,a12,T,R,mid_temp)

% calculating specific heat for higher temp and lower temp respectively
if (T<=mid_temp)
    Cp=R*(a8+(a9*T)+(a10*(T).^2)+(a11*(T).^3)+(a12*(T).^4));
else
    Cp=R*(a1+(a2*T)+(a3*(T).^2)+(a4*(T).^3)+(a5*(T).^3)+(a5*(T).^4));
end
end
The Main Code
clear all
close all
clc


file=fopen('THERMO.dat','r')
line1=fgetl(file)
line2=fgetl(file)
extract_values_line2=strsplit(line2)
low_temp=str2num(extract_values_line2{2})
mid_temp=str2num(extract_values_line2{3})
high_temp=str2num(extract_values_line2{4})

% R is molar gas constant
R=8.314;
%temperature range
T=linspace(low_temp,high_temp,1000);

%skip other lines
line3=fgetl(file)
line4=fgetl(file)
line5=fgetl(file)
%now entering the 6th line
for i=1:53
    tline=fgetl(file);
    extractvalues_tline=strsplit(tline,' ');
    name_ofthe_species=(extractvalues_tline{1});
    species_lowtemp=str2num(extractvalues_tline{end-3});
    species_midtemp=str2num(extractvalues_tline{end-1});
    species_hightemp=str2num(extractvalues_tline{end-2});


%Finding 7 coefficients

    tline1=fgetl(file);
    a=findstr(tline1,'E');

    a1=tline1(1:a(1)+3);
    a1=str2num(a1)
    a2=tline1(a(1)+4:a(2)+3);
    a2=str2num(a2)
    a3=tline1(a(2)+4:a(3)+3);
    a3=str2num(a3)
    a4=tline1(a(3)+4:a(4)+3);
    a4=str2num(a4)
    a5=tline1(a(4)+4:a(5)+3);
    a5=str2num(a5)


    tline2=fgetl(file);
    b=findstr(tline2,'E');

    a6=tline2(1:a(1)+3);
    a6=str2num(a6)
    a7=tline2(a(1)+4:a(2)+3);
    a7=str2num(a7)
    a8=tline2(a(2)+4:a(3)+3);
    a8=str2num(a8)
    a9=tline2(a(3)+4:a(4)+3);
    a9=str2num(a9)
    a10=tline2(a(4)+4:a(5)+3);
    a10=str2num(a10)

    tline3=fgetl(file);
    c=findstr(tline,'E');
    a11=tline3(1:a(1)+3);
    a11=str2num(a11)
    a12=tline3(a(1)+4:a(2)+3)
    a12=str2num(a12)
    a13=tline3(a(2)+4:a(3)+3)
    a13=str2num(a13)
    a14=tline3(a(3)+4:a(4)+3)
    a14=str2num(a14)

    % calculate specific heat(cp), Enthalpy (H) and Entropy (s)
    Cp=specific_heat(a1,a2,a3,a4,a5,a8,a9,a10,a11,a12,T,R,mid_temp)
    H=Enthalpy(a1,a2,a3,a4,a5,a6,a8,a9,a10,a11,a12,a13,T,R,mid_temp)
    S=Entropy(a1,a2,a3,a4,a5,a7,a8,a9,a10,a11,a12,T,R,mid_temp)


    % Calculating moleculer weight and printing it
    Moleculer_Weight=wt(name_ofthe_species);
    fprintf('Moleculer weight of %s=%f\n',name_ofthe_species,Moleculer_Weight);


% Plotting T vs Cp
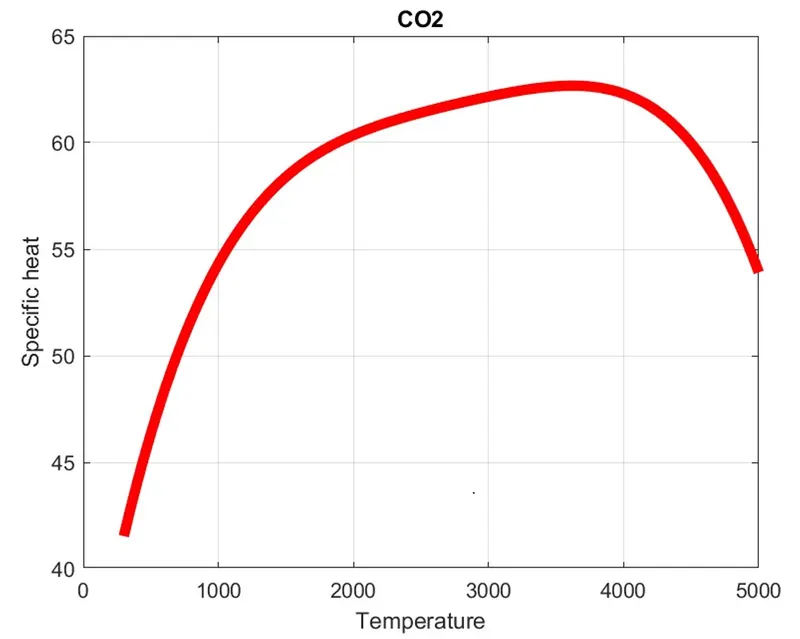
figure(1)
plot(T,Cp,'linewidth',5,'Color','red')
xlabel('Temperature')
ylabel('Specific heat')
grid on
title('name of species')

% Plotting T vs H
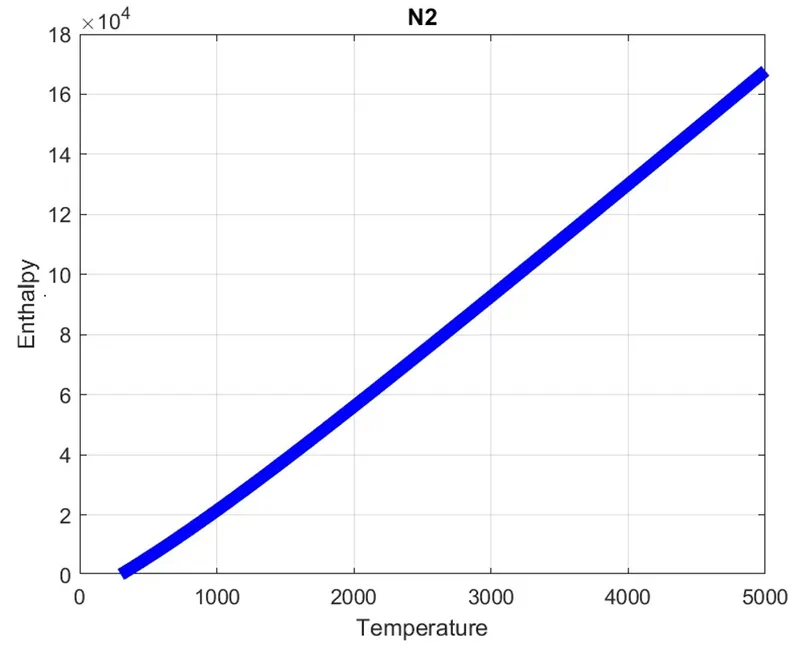
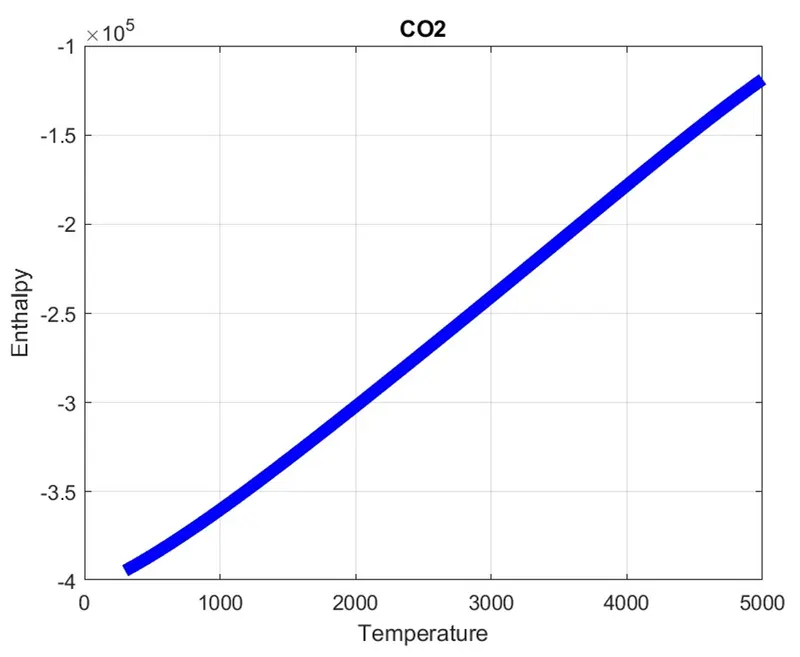
figure(2)
plot(T,H,'linewidth',6,'Color','blue')
xlabel('Temperature')
ylabel('Enthalpy')
grid on
title('name of species')

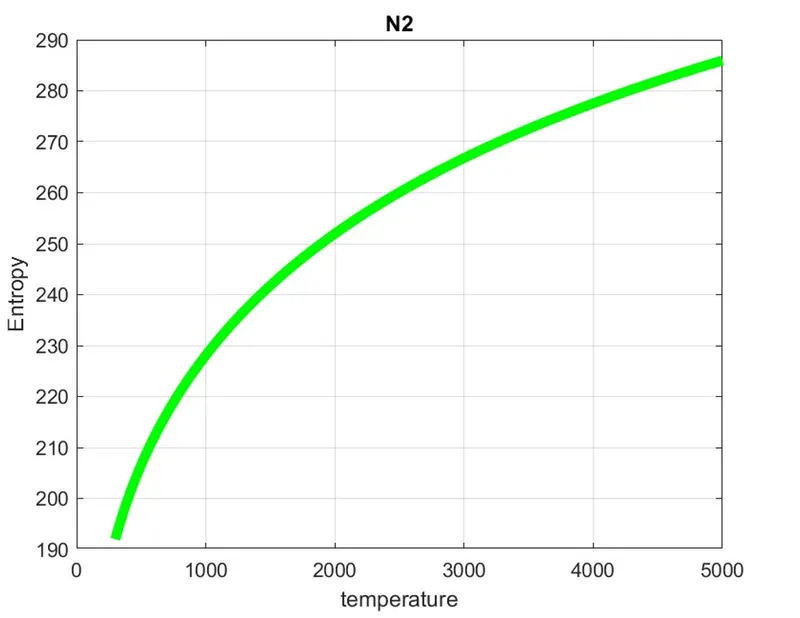
%plotting T vs S
figure(3)
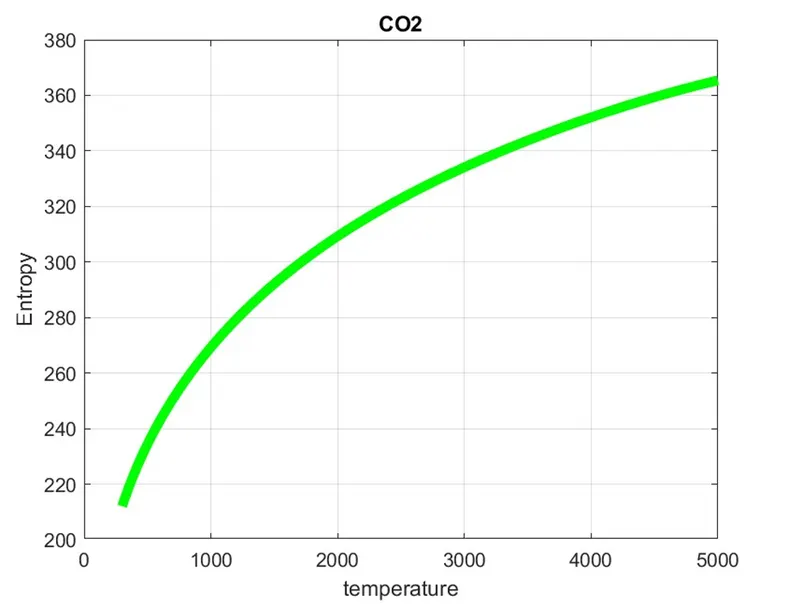
plot(T,S,'linewidth',5,'color','green')
xlabel('temperature')
grid on
ylabel('Entropy')

mkdir(name_ofthe_species)
cd(name_ofthe_species)
saveas(figure(1),'T vs Cp.jpg')
saveas(figure(2),'T vs H.jpg')
saveas(figure(3),'T vs S.jpg')
cd ..
end
Plots:-
plots for Oxygen
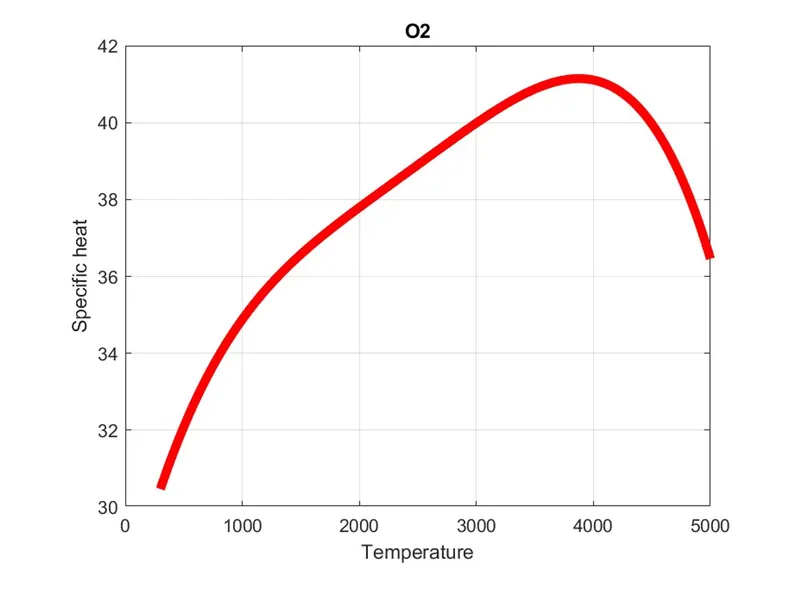
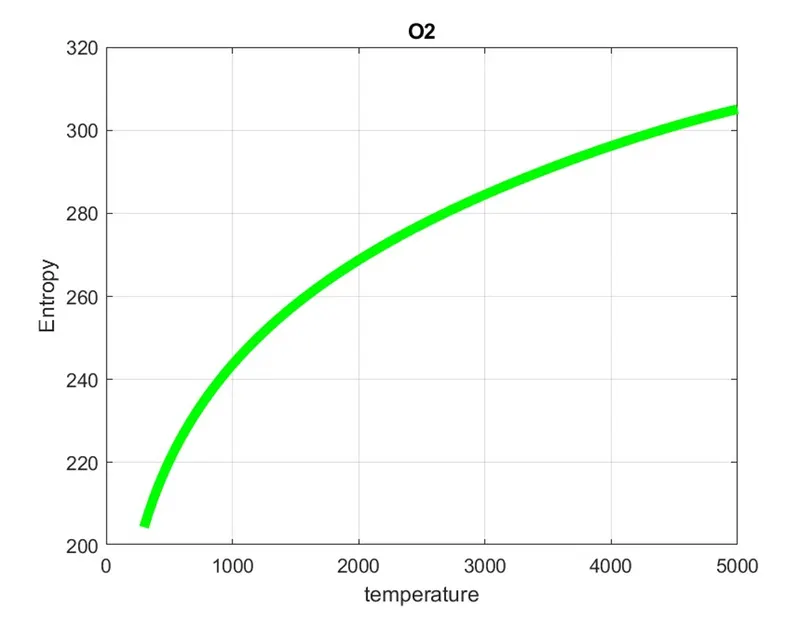
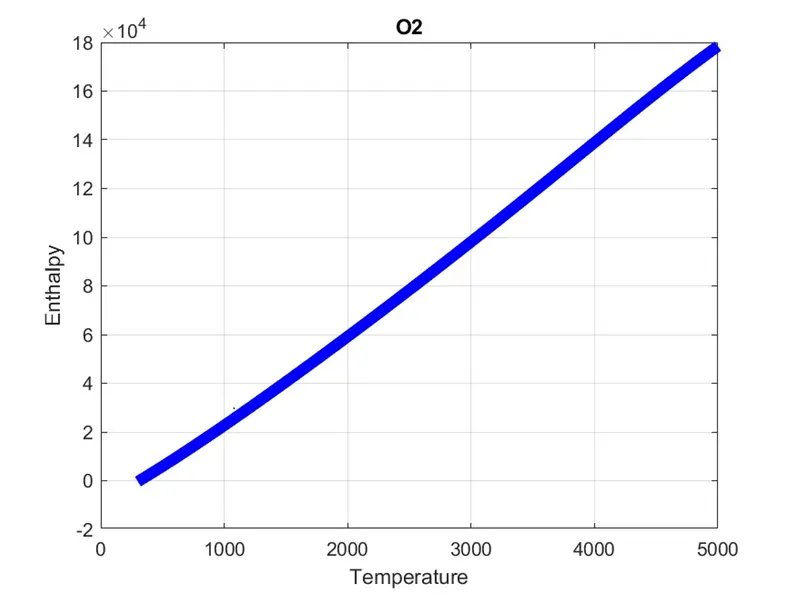
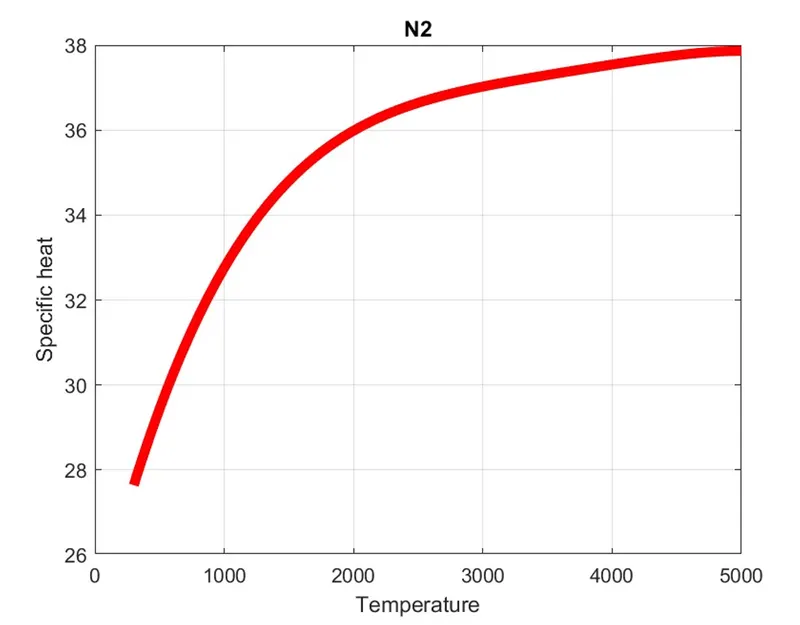
Plot for Nitrogen(N2)
Plot for Carbon Dioxide(CO2):-
Screenshot of folder:-

Main code explanation:-
1) Open the file ‘thermo.dat’ as ‘r’ and considering inputs R= 8.314 and T with linspace command.
2) Skipping the starting two lines by using fgetl() command.
3) Further line, split the values and extracting the low, mid and high temp values
4) Again splitting the next three lines by fgetl() command
5) At next line from where the species are gained
6) Species are gained, requires to extract the low, mid and high temp.
7) Followed by finding 14 coefficients from 3 lines.
8) Calculating Cp, H and S in other tab using function command. The derivations of mentioned are available in challenge page.
8) Calculating and printing Moleculer weight.
9) Plotting begins from here.
a) T vs Cp
b) T vs H
c) T vs S
10) Making a folder and saving all species file using mkdir, cd and saveas commands.
Errors
