Project 1 - Parsing NASA thermodynamic data
MATLAB CODES

Function program for calculating Specific heat

%function program for Specific Heat


function[Cp] = Specific_heat(a1,a2,a3,a4,a5,a8,a9,a10,a11,a12,R,temp,global_mid_temp)

if temp >= global_mid_temp

    Cp = R*(a1+(a2*temp)+(a3*(temp).^2)+(a4*(temp).^3)+(a5*(temp).^4));
else
   Cp = R*(a8+(a9*temp)+(a10*(temp).^2)+(a11*(temp).^3)+(a12*(temp).^4));

end
end


Function program for calculating Enthalpy

%function program for Enthalpy


function[h] = Enthalpy(a1,a2,a3,a4,a5,a6,a8,a9,a10,a11,a12,a13,R,temp,global_mid_temp)  %function name and input values

if temp >= global_mid_temp

    h = R.*temp.*(a1+(a2.*(temp./2))+(a3.*(temp./3))+(a4.*(temp./4))+(a5.*(temp./5))+(a6.*(temp./6)));
else
     h = R.*temp.*(a8+(a9.*(temp./2))+(a10.*(temp./3))+(a11.*(temp./4))+(a12.*(temp./5))+(a13.*(temp./6)));

end
end


Function program for calculating Entropy

%function program for Entropy


function [s] = Entropy(a1,a2,a3,a4,a5,a7,a8,a9,a10,a11,a12,a14,R,temp,global_mid_temp)

if temp >= global_mid_temp

    s = R.*(a1.*log(temp) + (a2.*temp) + (a3.*(((temp)./2)./2)) + (a4.*(((temp)./3)./3)) + (a5.*(((temp)./4)./4)) + a7);
else
    s = R.*(a8.*log(temp) + (a9.*temp) + (a10.*(((temp)./2)./2)) + (a11.*(((temp)./3)./3)) + (a12.*(((temp)./4)./4)) + a14);

end
end


Function program for calculating Molecular weight

%function program for calculating Molecular weight

function[Mw] = Molecular_weight(Species_name)

element = {'H' 'C' 'N' 'O' 'Ar'};   %elements
atomic_weight = [1.00784 12.0107 14.0067 15.999 39.948];    %Atomic weights

Mw=0;

for i = 1:length(Species_name)  %To calculate molecular weight for loop is used

    for j = 1:length(atomic_weight)
        if strcmp(Species_name(i), element(j));
        Mw = Mw + atomic_weight(j);

        u = j;

        end

    end

    n = str2num(Species_name(i));
    if n>1
        Mw = Mw + (atomic_weight(u)*(n-1));
    end

end
end
MAIN CODE----
clear all
close all
clc

f1 = fopen('THERMO.dat','r');   %To read the file
file_name = fgetl(f1);          %To get the first line of the file
line1 = fgetl(f1);              %To get the second line
A = strsplit(line1,' ');        %To split and converting it to string


global_min_temp = str2num(A{2}); %To convert the string as number and assigning as global minimum temperature
global_mid_temp = str2num(A{3}); %To convert the string as number and assigning as global mid temperature
global_max_temp = str2num(A{4}); %To convert the string as number and assigning as global maximum temperature

for i = 1:3
    comments = fgetl(f1)        %To get the next three lines
end

for j = 1:53
    species = fgetl(f1);
    B = strsplit(species);
    Species_name = (B{1});

    line_1 = fgetl(f1);
    l1 = strfind(line_1,'E');
    a1 = str2num(line_1(1:(l1(1)+3)));
    a2 = str2num(line_1((l1(1)+4):(l1(2)+3)));
    a3 = str2num(line_1((l1(2)+4):(l1(3)+3)));
    a4 = str2num(line_1((l1(3)+4):(l1(4)+3)));
    a5 = str2num(line_1((l1(4)+4):(l1(5)+3)));

    line_2 = fgetl(f1);
    l2 = strfind(line_2,'E');
    a6 = str2num(line_2(1:(l2(1)+3)));
    a7 = str2num(line_2((l2(1)+4):(l2(2)+3)));
    a8 = str2num(line_2((l2(2)+4):(l2(3)+3)));
    a9 = str2num(line_2((l2(3)+4):(l2(4)+3)));
    a10 = str2num(line_2((l2(4)+4):(l2(5)+3)));

    line_3 = fgetl(f1);
    l3 = strfind(line_3,'E');
    a11 = str2num(line_3(1:(l3(1)+3)));
    a12 = str2num(line_3((l3(1)+4):(l3(2)+3)));
    a13 = str2num(line_3((l3(2)+4):(l3(3)+3)));
    a14 = str2num(line_3((l3(3)+4):(l3(4)+3)));


    R = 8.314;              %Gas constant
    temp = linspace(global_min_temp,global_max_temp, 100); %creating an array of temperature

    mkdir('D:\MATLAB Training',Species_name) %Creating a folder

    Cp = Specific_heat(a1,a2,a3,a4,a5,a8,a9,a10,a11,a12,R,temp,global_mid_temp);        %Calling Specific heat function
    h = Enthalpy(a1,a2,a3,a4,a5,a6,a8,a9,a10,a11,a12,a13,R,temp,global_mid_temp);       %Calling Entropy function
    s = Entropy(a1,a2,a3,a4,a5,a7,a8,a9,a10,a11,a12,a14,R,temp,global_mid_temp);        %Calling Enthalpy function


    %plotting the graph between temp vs Cp

    figure(1)
    plot(temp, Cp, 'linewidth', 3 , 'color','k');
    xlabel("Temperature")
    ylabel("Specific Heat")
    title(Species_name,'Specific Heat vs Temperature')
    grid on


    %plotting the graph between temp vs enthalpy
    figure(2)
    plot(temp, h, 'linewidth', 3 , 'color','g');
    xlabel("Temperature")
    ylabel("Enthalpy")
    title(Species_name,'Enthalpy vs Temperature')
    grid on


    %plotting the graph between temp vs entropy
    figure(3)
    plot(temp, s, 'linewidth', 3 , 'color','r');
    xlabel("Temperature")
    ylabel("Entropy")
    title(Species_name,'Entropy vs Temperature')
    grid on


    %Saving the figure
    saveas(figure(1),'Specific Heat.jpg')
    saveas(figure(2),'Enthalpy.jpg')
    saveas(figure(3),'Entropy.jpg')

    cd('D:\MATLAB Training')


    Mw = Molecular_weight(Species_name);
    fprintf('Molecular weight of %s is %d',Species_name,Mw);    %To print the molecular weight of each element
    disp(' ')
end

fclose(f1)
With the calculated Cp, h and s values graphs were plotted for all the 53 species and saved in their appropriate files. here are the graphs plotted for O2,N2,CO2
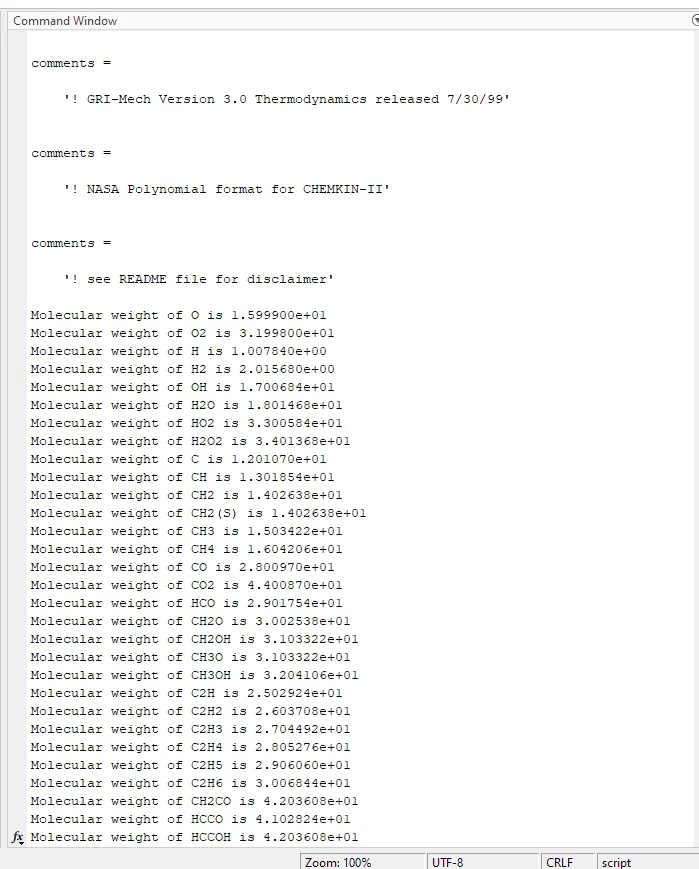
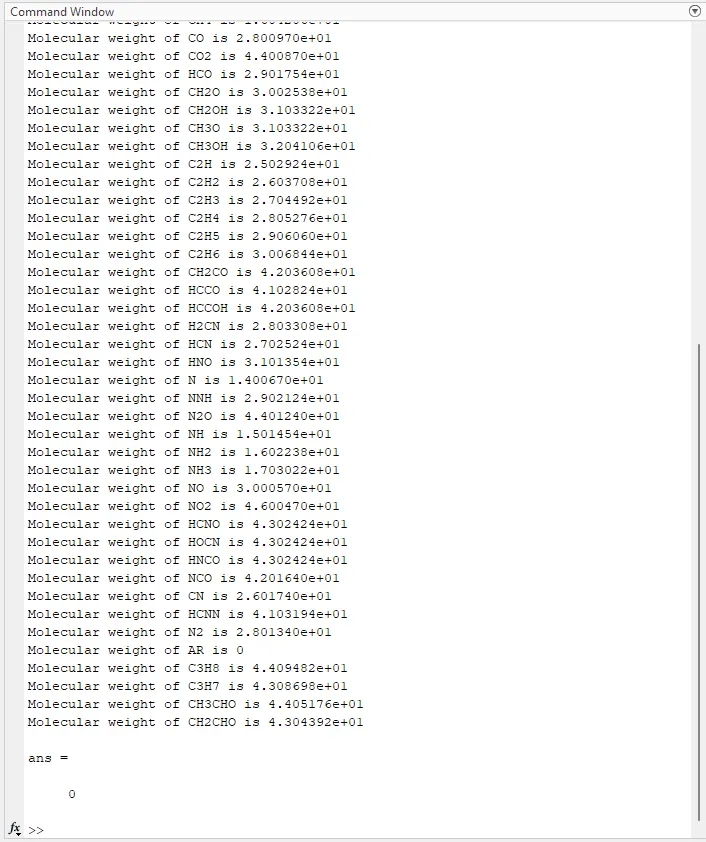
SNAPSHOT OF COMMAND WINDOW
SNAPSHOT of FILES FOLDER