Project 1 - Parsing NASA thermodynamic data
1. Write a function that extracts the 14 co-efficients and calculates the enthalpy, entropy and specific heats for all the species in the data file. You will be reading this file NASA thermodynamic data(Tip: use fopen and fgetl). The formulae are shown below.
Here R is the universal gas constant, T is the temeprature
clear
close
clc
%file reading
f=fopen('THERMO.DAT','r');
for i=1:5
fgetl(f);
end
%To the next line of the given data in a new variabla
a=fgetl(f) ;
b=strsplit(a,' '); %[by using this comand strsplit we can split into cell array]
% To find the exact location of species name(oxygen)
species_name=b{1};
%to extract the temperatures and also command str2num used to get whole
%number values
lowtemp =str2num(b{6});
midtemp =str2num(b{8});
hightemp=str2num(b{7});
%To extract the CO_EFFICIENTS
co_eff=fgetl(f);
% (strfind command is used to position of co_efficienTS with respect to E)
pos=strfind(co_eff,'E');
%FIND CO_EFFICIENTS(a1,a2,a3,a4,a5)
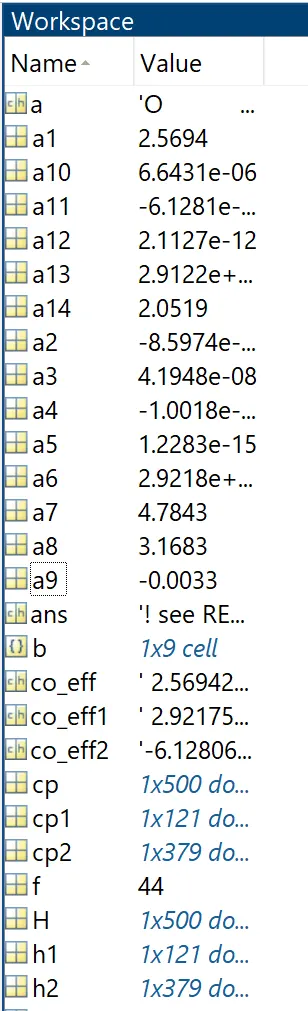
a1=str2double(co_eff(1:(pos(1)+3)));
a2=str2double(co_eff(pos(1)+4:(pos(2)+3)));
a3=str2double(co_eff(pos(2)+4:(pos(3)+3)));
a4=str2double(co_eff(pos(3)+4:(pos(4)+3)));
a5=str2double(co_eff(pos(4)+4:(pos(5)+3)));
%FIND the remaining co_efficients1(a6,a7,a8,a9,a10)
co_eff1=fgetl(f);
%command=strfind is used to get the position of remaimg co_eff
pos1=strfind(co_eff1,'E');
%find co_eff(a6,a7,a8,a9,a10)
a6=str2double(co_eff1(1:(pos1(1)+3)));
a7=str2double(co_eff1(pos1(1)+4:(pos1(2)+3)));
a8=str2double(co_eff1(pos1(2)+4:(pos1(3)+3)));
a9=str2double(co_eff1(pos1(3)+4:(pos1(4)+3)));
a10=str2double(co_eff1(pos1(4)+4:(pos1(5)+3)));
%to find c0_eff2(a11,a12,a13,a14)
co_eff2=fgetl(f);
%positin of co_eff respect to E(command=strfind)
pos2=strfind(co_eff2,'E');
a11=str2double(co_eff2(1:(pos2(1)+3)));
a12=str2double(co_eff2(pos2(1)+4:(pos2(2)+3)));
a13=str2double(co_eff2(pos2(2)+4:(pos2(3)+3)));
a14=str2double(co_eff2(pos2(3)+4:(pos2(4)+3)));
%calculation of cp,H,S
%temperature array creation
T=linspace(lowtemp,hightemp,500);
for i=1:length(T)
t=T(i)
if (t<midtemp)
ltr(i)=t
else
htr1(i)=t
end
end
htr=htr1(122:500);
%universal gas constant(R)
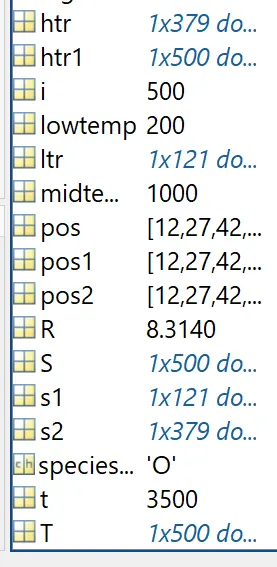
R=8.314 %unit is J.(mol)^-1.(k)^-1
%calculation of cp,H,S(ltr)
cp1=(a8+a9.*ltr+a10.*ltr.^2+a11.*ltr.^3+a12.*ltr.^4+a13.*ltr.^5+a14.*ltr.^6).*R;
h1=R.*ltr.*(a8+(a9.*(ltr)./2)+(a10.*(ltr).^2/3)+(a11.*(ltr).^3/4)+(a12.*(ltr).^4/5)+(a13.*(ltr).^5/6)+(a14./ltr));
s1=(a8.*log(ltr)+a9.*ltr+(a10.*ltr.^2)/2+(a11.*ltr.^3)/3+(a12.*ltr.^4)/4+(a13.*ltr.^5)/5+a14).*R;
%calculation of cp,H,S(htr)
cp2=(a1+a2.*htr+a3.*htr.^2+a4.*htr.^3+a5.*htr.^4+a6.*htr.^5+a7.*htr.^6).*R
h2=R.*htr.*(a1+(a2.*(htr)./2)+(a3.*(htr).^2/3)+(a4.*(htr).^3/4)+(a5.*(htr).^4/5)+(a6.*(htr).^5/6)+(a7./htr));
s2=(a1.*log(htr)+a2.*htr+(a3.*htr.^2)/2+(a4.*htr.^3)/3+(a5.*htr.^4)/4+(a6.*htr.^5)/5+a7).*R;
%we have to combine the two individual array into single array cell
cp=[cp1,cp2];
H=[h1,h2];
S=[s1,s2];
%plotting
figure(1)
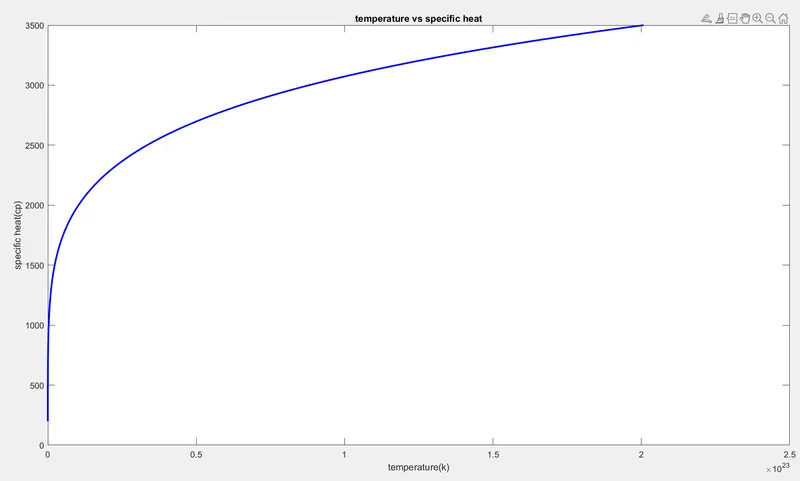
plot(cp,T,'linewidth',2,'color','b')
xlabel('temperature(k)')
ylabel('specific heat(cp)')
title('temperature vs specific heat')
saveas(1,'sample.jpg')
figure(2)
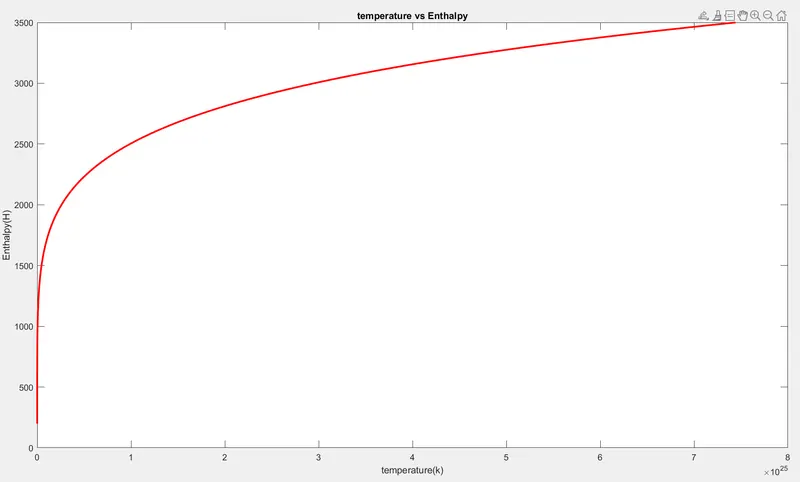
plot(H,T,'linewidth',2,'color','r')
xlabel('temperature(k)')
ylabel('Enthalpy(H)')
title('temperature vs Enthalpy')
saveas(2,'sample.jpg')
figure(3)
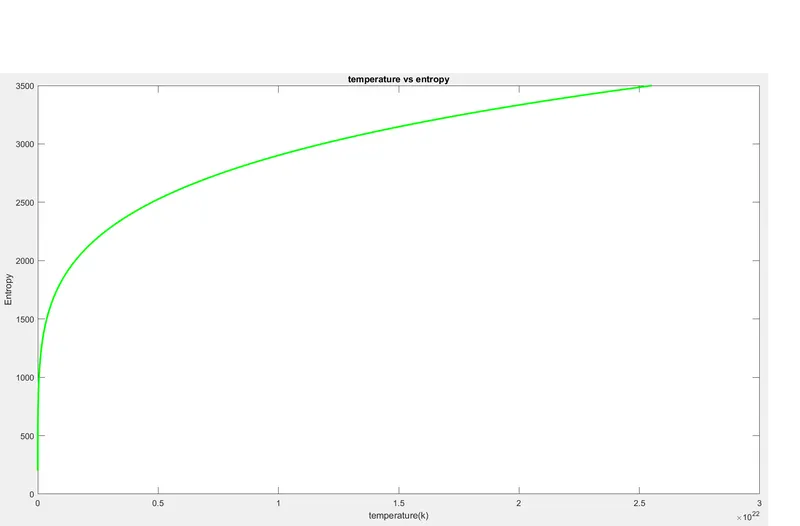
plot(S,T,'linewidth',2,'color','g')
xlabel('temperature(k)')
ylabel('Entropy')
title('temperature vs entropy')
saveas(2,'sample.jpg')
%creation of folders
mkdir(['C:\Users\mohan\OneDrive\Desktop\','speciesname-O'])
cd(['C:\Users\mohan\OneDrive\Documents\MATLAB\','speciesname-O'])
%explanation of code
1.In challenges we have to download the thermo data file and it must be in same path of matlab file for ease access
2.By using 'fopen' command we get the data file stored
3.To avoid the first 5 lines because we need species oxygen so that
we use
for i=1:5
fgetl(f);
end
4.By using a='fgetl'command ,we get the next line (i,e)-oxygen species
5.By using 'strsplit'(assigned into new variable) command ,we can split the 6th line single one
6.EXTRACTION OF TEMPERATURES
while extracting temperatures use command ('str2num')command to get the whole numbers not in decimal values
1.low temp
2.mid temp
3.high temp
7.To get the line of COEFFICIENTS;
we use co_eff='fgetl(f) (because we need the co_eff line from thermo data file)
8.The command 'strfind'is used to find thr coefficients based on 'E' value because 'E' is the common for coefficient values.
we have totally 14 coefficients,in that first 7 are high temperature coefficient and next 7 are low temperature coefficients
9. a1=(co_eff(1:(pos(1)+3) ,this one is used to get the first coefficient values(a1)
10.Here we use command'STR2DOUBLE'
[a1=str2double(co_eff(1:(pos(1)+3)
"double" is used for faster performance.
finally we have (lowtemp,midtemp,hightemp,a1-a14)
%%CALCULATION OF CP,H,S
1.Create a temperature array(by using linspace)
2.
for i=1:length(T)
t=T(i)
if (t<midtemp)
ltr(i)=t
else
htr1(i)=t
end
end
3.we have to first calculate the CP,H,S for (ltr and htr)
where ltr ranges from(t<midtemp) and htr ranges from (t>midtemp)
4.generally we have CP1,H1,S1 and CP2,H2,S2 values,so we have to combine into single array by using
cp=[cp1,cp2];
H=[h1,h2];
S=[s1,s2];
5.Then we plot the curve for [cp vs T],[H vsT],[S VS T].
%creation of folders
By using command 'mkdir' and 'cd' we can save the image into a single folder which as follows
%creation of folders
mkdir(['C:\Users\mohan\OneDrive\Desktop\','speciesname-O'])
cd(['C:\Users\mohan\OneDrive\Documents\MATLAB\','speciesname-O'])
%ERROR FACED WHILE CODING
1.while extracting species name ,we have to use{ },but I use [ ] square brackets
2.Error in fileparsing (line 60)
a11=(co_eff2(1:(pos2(1)+3))),which shows error due to mismatching of command'str2double'
a11=(co_eff2(1:(pos2(1)+3))),which shows error due to mismatching of command'str2double'
3.in CP,H,S equations ,we have to use (.) element wise dot multiplication and also for division ,we have to use (./(ltr)
%overcome from errors
1.Error in fileparsing (line 86)
h1=R.*ltr.*(a8+(a9.*(ltr)./2)+(a10.*(ltr).^2/3)+(a11.*(ltr).^3/4)+(a12.*(ltr).^4/5)+(a13.*(ltr).^5/6)+(a14/ltr));.....Here I have to use (.) in division of array.
h1=R.*ltr.*(a8+(a9.*(ltr)./2)+(a10.*(ltr).^2/3)+(a11.*(ltr).^3/4)+(a12.*(ltr).^4/5)+(a13.*(ltr).^5/6)+(a14/ltr));.....Here I have to use (.) in division of array.
2.To get the whole number values by using command'str2double'
3.use {} (these brackets).
%GRAPHS
'TEMPERATURE VS SPECIFIC HEAT'
%%/TEMPERATURE VS ENTHALPY
%%TEMPERATURE VS ENTROPY
%OUTPUT