Project 1 - Parsing NASA thermodynamic data
Aim – To write a program in MATLAB to parse the NASA thermodynamic data file and then calculate the thermodynamic properties of various gas species.
Objective -
-
To write a function that extract the 14 – coefficient and calculate the enthalpy, entropy and specific heats for all species in the data file.
-
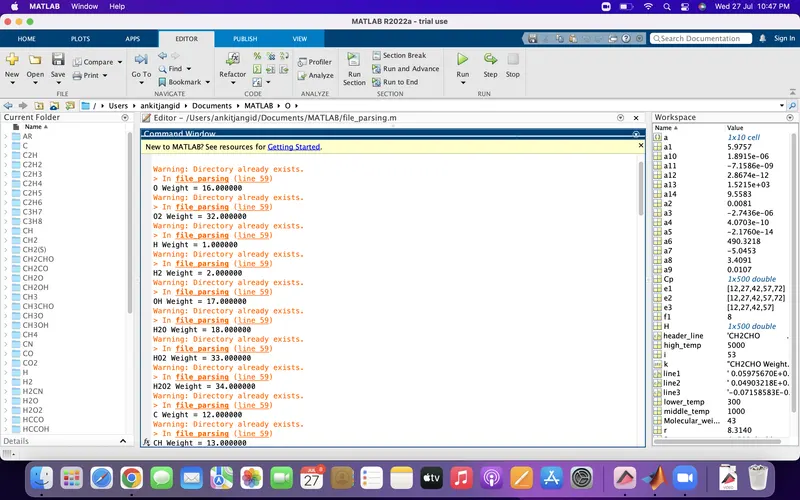
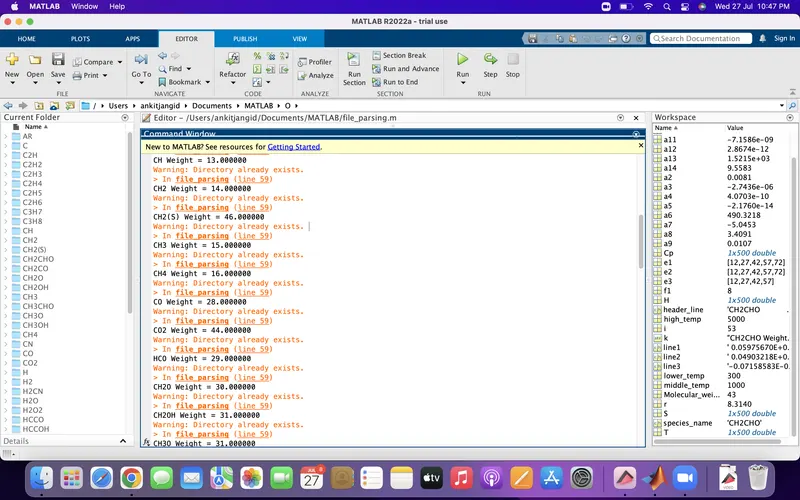
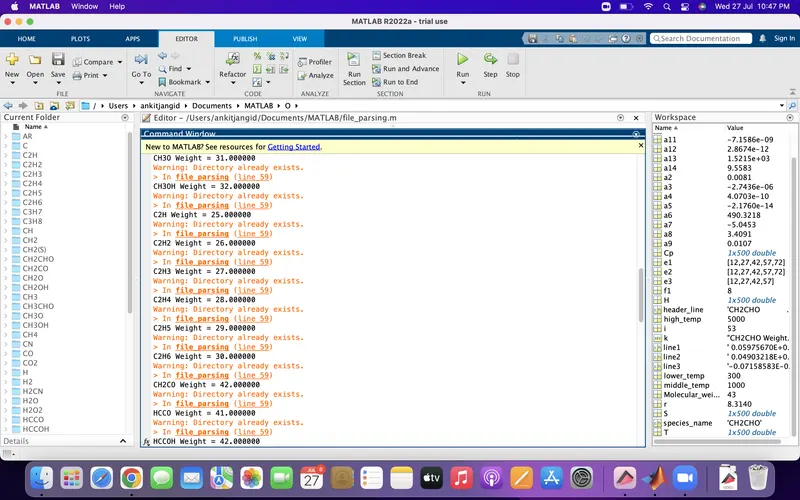
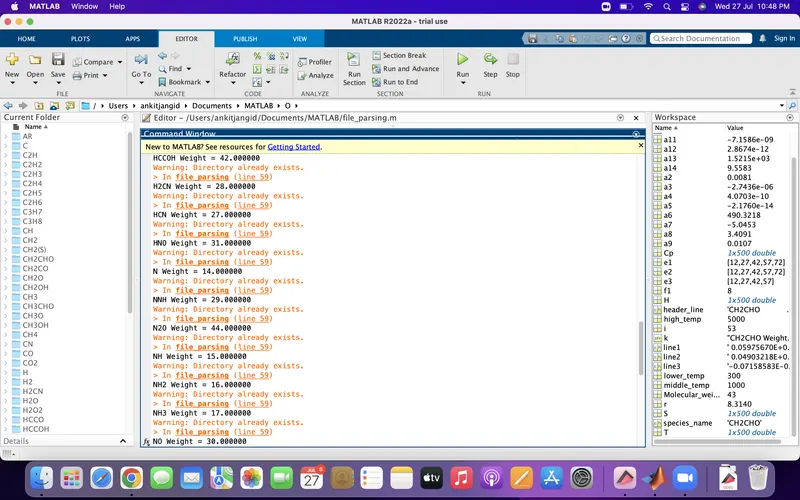
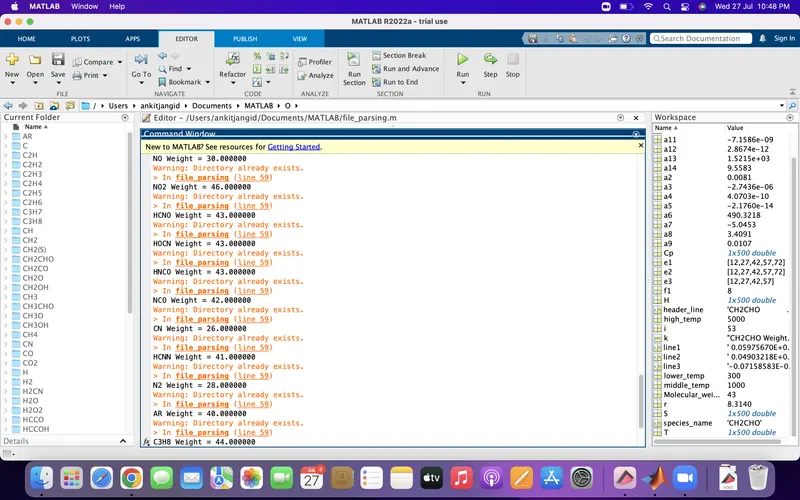
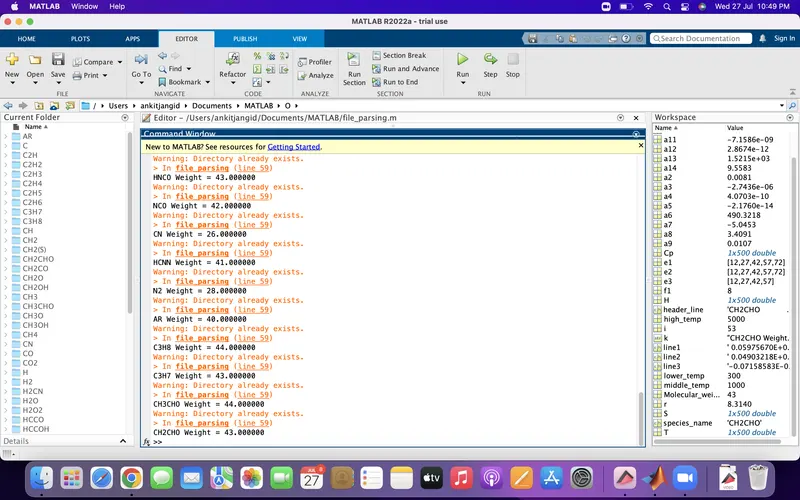
Calculating the molecular weight of each species and displaying it in command window.
-
Plotting cp, enthalpy and entropy for local temperature range specific for each species.
-
Save the plot as images with appropriate names and dump them in separate folders for each species with suitable name.
Introduction -
Parsing data -
- Parsing means to make something understandable. For programming this means to convert information represented in one form into another form that’s easier to work with. This is done by partially analyzing the data, understanding it’s underlying structure (by making some assumptions based on what you’re expecting to see), as then explicitly representing that structure in the code.
- Parsing a file means reading in a data stream of some sort and building an in memory model of the semantic content of that data. The aims at facilitating performing some kind of transformation on the data
Equations -
The equation that we are going to use in the function to calculate Cp, H, S are -
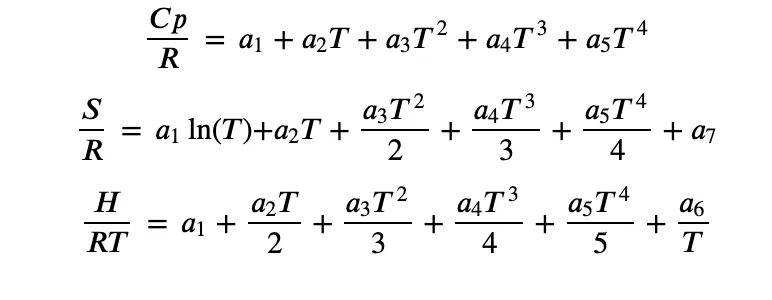
Where,
Cp = specific heat
R = molar gas constant
T = temperature
S = Entropy
H = Enthalpy
a = coefficient
Body of the contant -
Code for calling function specific_heat() -
function [Cp] = Specific_heat(a1,a2,a3,a4,a5,a8,a9,a10,a11,a12,a13,temp,high_temp,const_R)
if temp <= high_temp
    Cp = (a8+(a9*temp)+(a10*(temp.^2))+(a11*(temp.^3))+(a12*(temp.^5))).*const_R;
else
    Cp = (a1+(a2*temp)+(a3*(temp.^2))+(a4*(temp.^3))+(a5*(temp.^5))).*const_R;
end
end- From the above given equation for Specific heat, we program a function for [Cp].
- This can be calculate with respect to high temp.
- in this first 5 values are for high temp. and last 5 are for low temp. values.
Code for calling function Enthalpy() -
function [H] = enthalpy(a1,a2,a3,a4,a5,a6,a8,a9,a10,a11,a12,a13,temp,lower_temp,const_R)
if temp <= lower_temp
    H = (a8+(a9*(temp/2))+(a10*(temp.^2/3))+(a11*(temp.^3/4))+(a12*(temp.^4/5))+(a13./temp)).*temp*const_R;
else
        H = (a1+(a2*(temp/2))+(a3*(temp.^2/3))+(a4*(temp.^3/4))+(a5*(temp.^4/5))+(a6./temp)).*temp*const_R;
end
end- From the above given equation for Enthalpy we write a function program for [H].
- At hear we compair the values with respect to low temp.
- in this first 5 values are for high temp. and last 5 are for low temp. values
Code for calling function Entropy() -
function [S] = Entropy(a1,a2,a3,a4,a5,a7,a8,a9,a10,a11,a12,a13,temp,middle_temp,const_R)
if temp <= middle_temp
    S = (a8*log(temp)+(a9*temp)+(a10*(temp.^2/2))+(a11*(temp.^3/3))+(a12*(temp.^4/4))+a13).*const_R;
else
    S = (a1*log(temp)+(a2*temp)+(a3*(temp.^2/2))+(a4*(temp.^3/3))+(a5*(temp.^4/4))+a7).*const_R;
end
end- From the above given equation for Entropy we write a function program for [S].
- We calculate the values with given respect to middle temp.
- in this first 5 values are for high temp. and last 5 are for low temp. values
Code for Calculating molecular weight by calling function wt() -
function [Molecular_weight] = wt(species_names)

elements = ['H' 'C' 'O' 'N' 'A' 'S'];
atomic_weight = [1 12 16 14 40 32];
species = upper(species_names);
molicular_weight = 0;

for i = 1:length(species)
    for j = 1:length(elements)
        if strcmp(species(i),elements(j))
            molicular_weight = molicular_weight + atomic_weight(j);
            k = j;
        end
    end
            n = str2double(species(i));
            if (n>1)
                molicular_weight = molicular_weight + atomic_weight(k)*(n-1);
            end
            Molecular_weight = molicular_weight;

end
end- Hear we write a program function for molecular weight for all species.
- First we take few species for check purpose with his atmoic weight.
- And decleared molecular weight = 0.
- We taking equation in 'for' loop and compeir species and elements with 'strcmp' command.
- After that we decleared the values molecular weight for one more time in the loop with respect to atomic weight.
- Now we change string to desimal or numeric values with 'str2double' command.
- Again one more time we found molecular weight for n values.
Main code -
clear
close
clc

% opening the file
f1 = fopen('THERMO.dat','r')

% using for loop to read 1st 5 lines
for i=1:5
    % fgetl reads lines from a file each
a = fgetl(f1);
end
for i=1:53
    % getting first header line, which is a character with different data's
header_line = fgetl(f1);
% splitting the string based on the delimiter
% our delimeter is space
a = strsplit(header_line,' ');

% 1st cell of a represents the species_name
species_name = a{1};
% local lower, medium, higher temperature, we are converting string to numbers
lower_temp = str2double(a{end-3});
middle_temp = str2double(a{end-1});
high_temp = str2double(a{end-2});
T = linspace(lower_temp,high_temp,500);
% getting species with exponential coefficient
line1 = fgetl(f1);
% finding the location of exponent(E)
e1 = strfind(line1,'E');
% we are converting string to number
a1 = str2double(line1(1:e1(1)+3));
a2 = str2double(line1(e1(1)+4:e1(2)+3));
a3 = str2double(line1(e1(2)+4:e1(3)+3));
a4 = str2double(line1(e1(3)+4:e1(4)+3));
a5 = str2double(line1(e1(4)+4:e1(5)+3));

line2 = fgetl(f1);
e2 = strfind(line2,'E');
a6 = str2double(line2(1:e2(1)+3));
a7 = str2double(line2(e2(1)+4:e2(2)+3));
a8 = str2double(line2(e2(2)+4:e2(3)+3));
a9 = str2double(line2(e2(3)+4:e2(4)+3));
a10 = str2double(line2(e2(4)+4:e2(5)+3));

line3 = fgetl(f1);
e3 = strfind(line3,'E');
a11 = str2double(line3(1:e3(1)+3));
a12 = str2double(line3(e3(1)+4:e3(2)+3));
a13 = str2double(line3(e3(2)+4:e3(3)+3));
a14 = str2double(line3(e3(3)+4:e3(4)+3));

r= 8.314;
[H] = enthalpy(a1,a2,a3,a4,a5,a6,a8,a9,a10,a11,a12,a13,T,lower_temp,r);
[S] = Entropy(a1,a2,a3,a4,a5,a7,a8,a9,a10,a11,a12,a13,T,middle_temp,r);
[Cp] = Specific_heat(a1,a2,a3,a4,a5,a8,a9,a10,a11,a12,a13,T,high_temp,r);

% creating the folder
mkdir(species_name);
cd(species_name);
% plotting
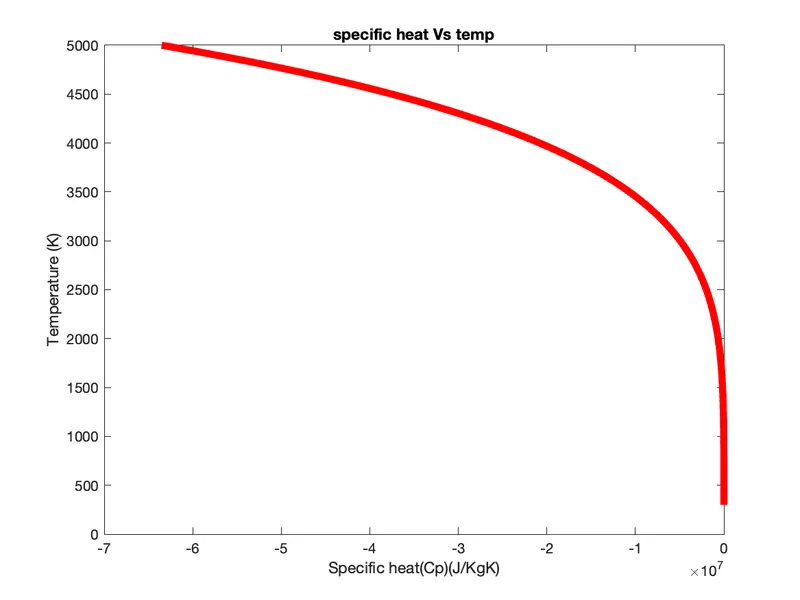
% ploting T Vs Cp
figure(1)
plot(Cp,T,'linewidth',5,'color','r')
xlabel('Temperature(K)')
ylabel('Specific heat(Cp)(J/KgK)')
title('specific heat Vs temp')
saveas(figure(1),'Cp vs T.png')

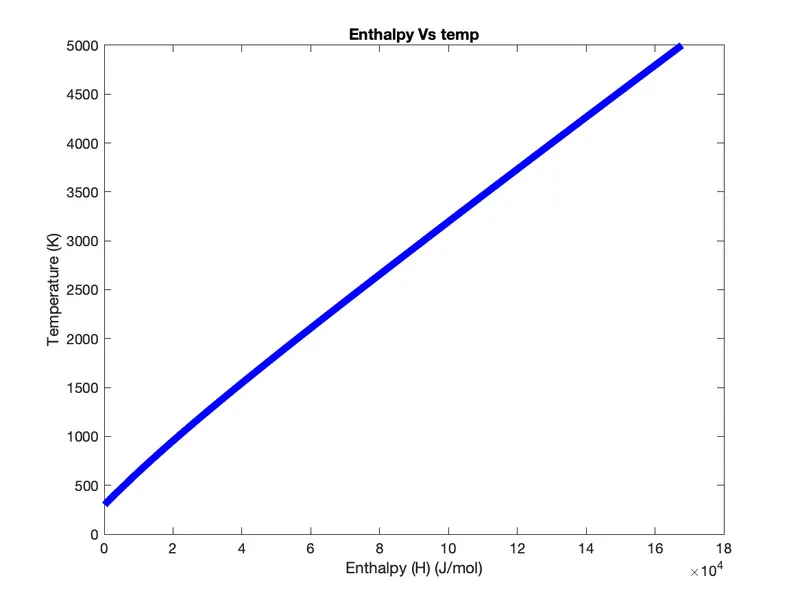
% plotting T Vs H
figure(2)
plot(H,T,'linewidth',5,'color','b')
xlabel('Temperature (K)')
ylabel('Enthalpy (H) (J/mol)')
title('Enthalpy Vs temp')
saveas(figure(2),'H vs T.png')

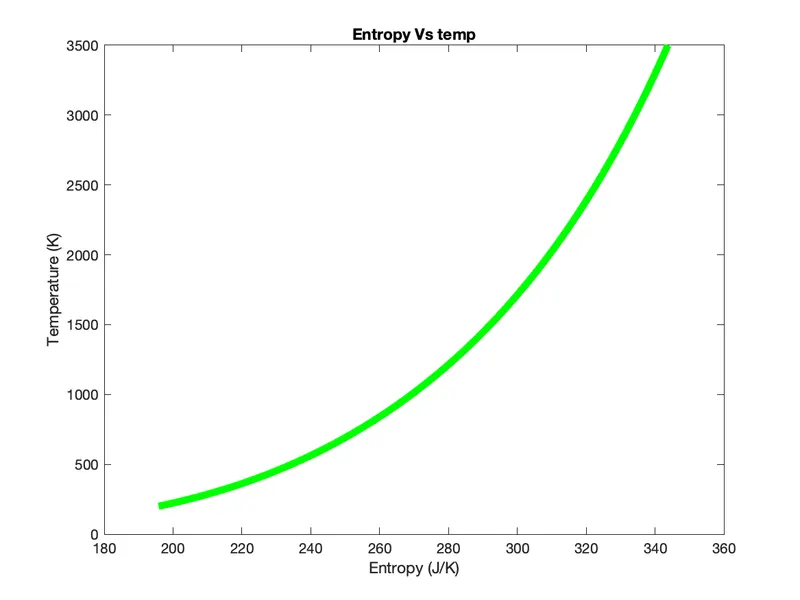
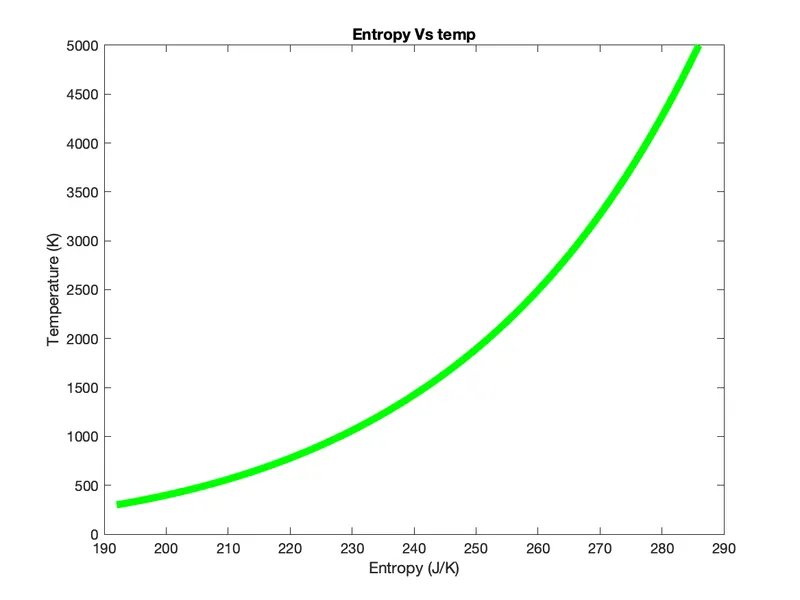
% plotting T Vs S
figure(3)
plot(S,T,'linewidth',5,'color','g')
xlabel('Temperature (K)')
ylabel('Entropy (J/K)')
title('Entropy Vs temp')
saveas(figure(3),'S vs T.png')

% changing back to working directory
cd ..

% calculating the molicular weight
[Molecular_weight] = wt(species_name);
k = sprintf("%s Weight = %f",species_name,Molecular_weight);
disp(k)
end
Explanation for code -
- Initially we use 'fopen' command to open the file 'THERMO.dat'.
- We taking 'for' loop for removing first 5 lines which are global temperature values, but we need local temperature as par challege.
- Further we use the 'fgetl' command to start the lines and after reading the first lines it converting the strings to numbers and assigning local (low, middle, and high) temperature.
- Then we have written a command to get the temperature range for calculation and plotting purpose.
- We splitting the header line string based on delimiter with 'strsplit' command.
- Then we represent 1st cell of the species names with 'a{1}'
- Then we declear the all three temperature - lower temp., middle temp., and high temp. and taking range 500 for temperature between lower temp. and high temp. with 'linspace' command.
- After that we find 'E' in thermo file with 'strfind' command.
- then we converting all string to number like (a1,a2,a3......a14).
- Then we decleared r = 8.314.
- And call function for H,S, and Cp.
- Further we used command to change the directory so that we can save the files at a particular location. After changing the directory we have used 'mkdir' command to create a new folder with the name of the current species asd then a 'cd' command use to make 'mkdir' as. the current directory.
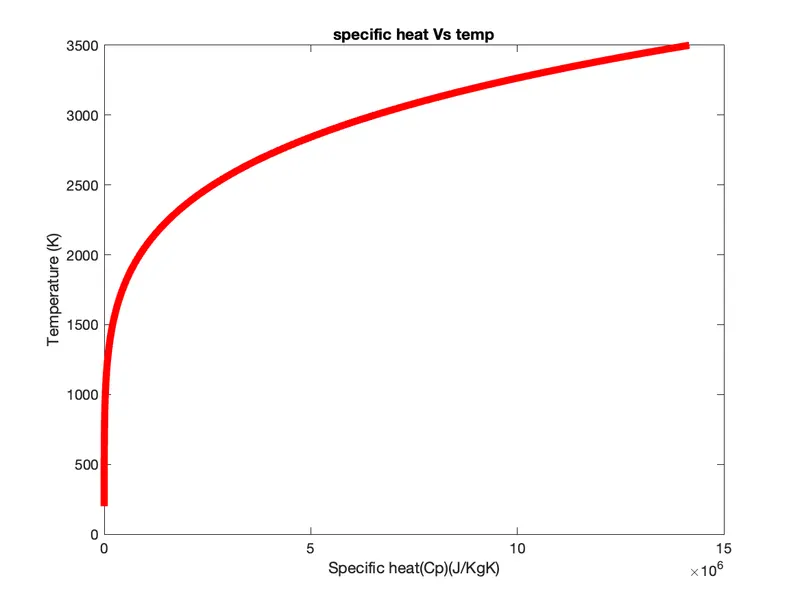
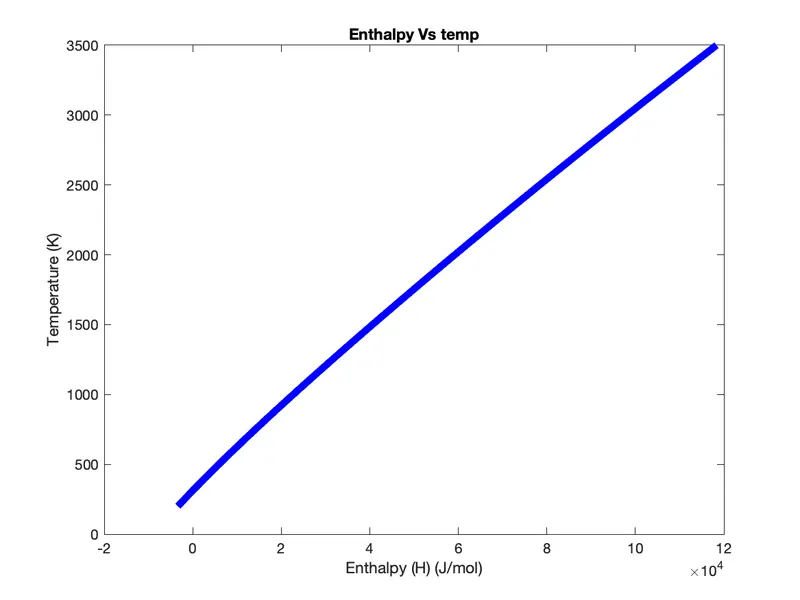
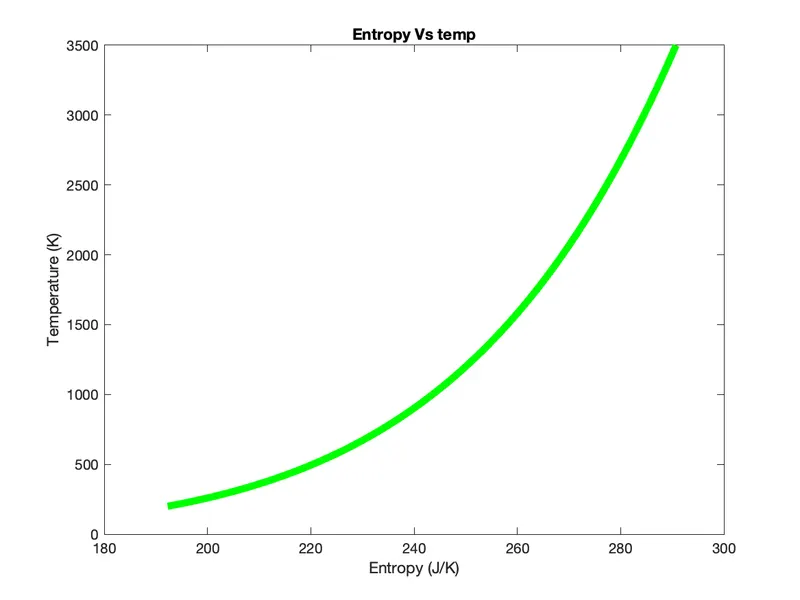
- Then we plotting graph for-
- 1. Specific heat and Temperature,
- 2. Enthalpy and Temperature, and
- 3. Entropy and Temperature.
- In each plot we de decleared x and y axis with 'xlabel' and 'ylabel' command.
- Then we give title for figure with 'title' command.
- We save this plots with 'saveas' command.
- Then we call Molecular weight function for calculation of all species molecular weight.
Errors -

- In this error we use extra clsoing braket for syntax so this error come

- This error comes while we run program without closing 'for' loop, so we use end command to complete this program and again run then this error solved.
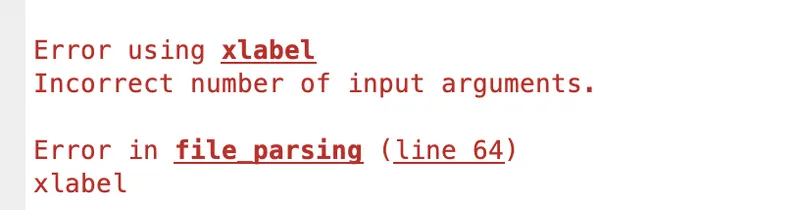
- This error comes while we using xlabel command and not declear inner values or names so this error comes, this error comes while we checking program.
- We decleared xlabel and ylabel and error resolved.

- This error comes while we closing the file folder with 'cd' command, for this we use .. for resolve this issue.
Output -
1. Plotting for CO2 -
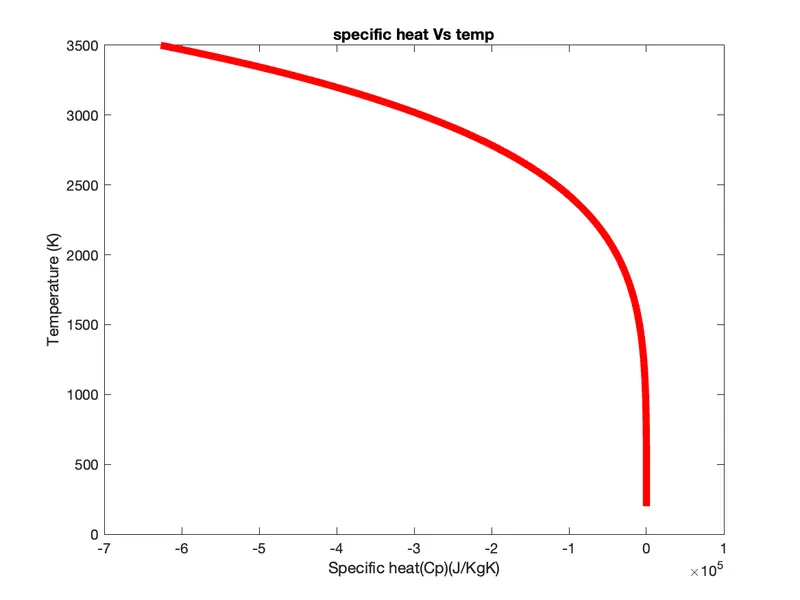
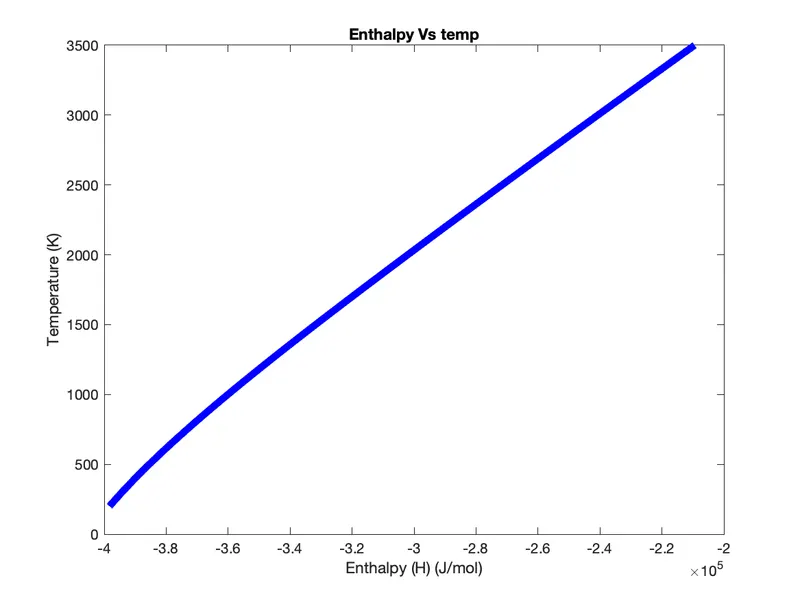
2. Plotting for N2 -
3. Plooting for O2 -
- Screenshot of the folder -

- Molecular weight -
Conclusion -
So, here we were able to parse the data from the 'THERMO.dat' file. Then using this data we were able to calculate the thermodynamic properties and also make plots for these properties with respect to the temperature.
Referance -
- Skill-lync help desk.
- Matlab help portal.