Project 1 - Parsing NASA thermodynamic data
AIM : Write a function that extracts the 14 co-efficients and calculates the enthalpy, entropy and specific heats for all the species in the data file.
How to read Thermo.dat file :
. In our data file 1st line is the title & 3,4,5 line are just comments which are not is used.
.The 2 nd line has 3 temperature value which are the global temperature for the data file. this value stored in variable.
. The 6 line the species data starts & goes upto end of the data.Its is easily to noted significant pattern in the species data.
. Each species has 4 lines of data.
1. The 1 st line showes the local low , mid & high temp.
2. The 2nd & 4thspecies line has 14 coefficient values.
3. 1st 7 coefficient shows high temp coeff.
4. Last 7 coefficient shows low temp coeff.
PROGRAM :
clear all
close all
clc
% opening the file and extracting the data
f1 = fopen('THERMO.dat','r');
q = fgetl(f1);
w = fgetl(f1);
A = strsplit(w,' ');
% Extracting the global temperature
global_low_temp = str2double(A{2});
global_mid_temp = str2double(A{3});
global_high_temp = str2double(A{4});
fgetl(f1);
fgetl(f1);
fgetl(f1);
% Extracting individual species information
% Total 53 individual species
for i=1:53
     species = fgetl(f1);
 T1 = strsplit(species,' ');
temp1= str2double(T1{end-3});
% local min temp
temp2= str2double(T1{end-1});
% local high temp
temp3= str2double(T1{end-2});
% local mid temperature
species_name = T1{1};

line_1 = fgetl(f1);
% Extracting the constant
L1 = strfind (line_1,'E');
a1 =  str2double(line_1(1:(L1(1)+3)));
a2 = str2double(line_1((L1(1)+4):(L1(2)+3)));
a3 = str2double(line_1((L1(2)+4):(L1(3)+3)));
a4 = str2double(line_1((L1(3)+4):(L1(4)+3)));
a5 = str2double(line_1((L1(4)+4):(L1(5)+3)));

line_2 = fgetl(f1);
% Extracting the constant a6 to a10 from 2nd species line using "E" as
% indicator
L2 = strfind(line_2,'E');
a6 = str2double(line_2 (1:(L2(1)+3)));
a7 = str2double(line_2((L2(1)+4):(L2(2)+3)));
a8 = str2double(line_2((L2(2)+4):(L2(3)+3)));
a9 = str2double(line_2((L2(3)+4:(L2(4)+3))));
a10 = str2double(line_2((L2(4)+4:(L2(5)+3))));

line_3 = fgetl(f1);
% Extracting the constant a11 to a14  from 3rd species line using "E" as
% indicator
L3 = strfind(line_3,'E');
a11 = str2double(line_3(1:(L3(1)+3)));
a12 = str2double(line_3((L3(1)+4):(L3(2)+3)));
a13 = str2double(line_3((L3(2)+4):(L3(3)+3)));
a14 = str2double(line_3((L3(3)+4):(L3(4)+3)));

% Range of temperaturefor which the Cp,H & S are calulated
T = linspace(temp1,temp3,100);
for i = 1:length(T)
   [c_p,H,S]= calculating_therm_properties(a1,a2,a3,a4,a5,a6,a7,a8,a9,a10,a11,a12,a13,a14,T,global_mid_temp);
end
% changing the directory and save the plots in that directory
mkdir(species_name)
cd(species_name)

%Creating the plots

figure(1)
plot(T,c_p,'linewidth',1.5,'color','r')
xlabel('Temperature(K)');
ylabel('Specific Heat(J/kgK)');
title('Specific Heat vs Temperature Plot')
grid on
m1 = 'Specific Heat of %s';
m2 = species_name;
m3 = sprintf(m1,m2);
saveas(figure(1),sprintf('%s.png',m3))

figure (2)
plot(T,H,'linewidth',1.5,'color','g')
xlabel('Temperature(K)');
ylabel('Enthalpy(J/mol)');
title('Enthalpy vs Temperature Plot')
grid on
m4 = 'Enthaply(H) of %s';
m5 = species_name;
m6 = sprintf(m4,m5);
saveas(figure(2),sprintf('%s.png',m6))


figure(3)
plot(T,S,'linewidth',1.5,'color','b')
xlabel('Temperature(K)');
ylabel('Entropy(J/K)');
title('Entropy vs  Temperature plot')
grid on
m7 = 'Entropy of %s';
m8 = species_name;
m9 = sprintf(m7,m8);
saveas(figure(3),sprintf('%s.png',m9))

% Changing back to the working directory
cd ..

%Calculating the molecular weight
[Mole_Wt] = Mol_wt(species_name);
end

fclose(f1)
EXPLANATION :
. The first we open the data file using fopen command & the 'r' shows reading the file.
. Using fgetl command the first line data.
. For next line again using fgetl command reading the data file.
. We using strsplit command for extract the global temp seperatately. The space between each global temp is used as an indicator for the strsplit command.
. There are totally 53 species.
. Using for loop , for 53 species & with fgetl command for each line of species read & the coeff value are stored frrom a1 to a14.
. We using strfind command for found the coeff value 'E' as indicator.
. The data is in the directory with species name using 'mkdir' command.
. The graphs for each species are plotted & images are saved in the directory using saveas command.
FUNCTION :
function [c_p,H,S] = calculating_therm_properties( a1,a2,a3,a4,a5,a6,a7,a8,a9,a10,a11,a12,a13,a14,T,global_mid_temp)
R = 8.314;
 if (T>=global_mid_temp)
     c_p = R.*(a1+a2*T+a3*T.^2+a4*T.^3+a5*T.^4);
     H = R.*T.*(a1+a2*(T/2)+a3*((T.^2)./3)+a4*((T.^3)./4)+a5*((T.^4)./5)+a6./T);
     S = R.*(a1*log(T)+a2*T+a3*((T.^2)./2)+a4*((T.^3)./3)+a5*((T.^4)./4)+a7);
 else
     c_p = R.*(a8+a9*T+a10*T.^2+a11*T.^3+a12*T.^4);
     H = R.*T.*(a8+a9*(T./2)+a10*((T.^2)./3)+a11*((T.^3)./4)+a12*((T.^4)./5)+(a13./T));
     S = R.*(a8*log(T)+a9*T+a10*((T.^2)./2)+a11*((T.^3)./3)+a12*((T.^4)./4)+a14);

 end
EXPLANATION :
. We write function program because we calculate the specific heat , enthalpy & entropy.
. We use for loop to calculate for each species.
. Also we use if & else command to calculate high temp for 7 element & low temp for last 7 element.
MOLECULAR WEIGTH CALCULATION :
function [Mole_Wt] = Mol_wt(species_name)
Mole_Wt = 0;
elements = ['H','C','N','O','A'];
mass = [1,12,14,16,40];
for i = 1:length(species_name)
    for j = 1:length(elements)
        if strcmpi(species_name(i),elements(j))
            Mole_Wt = Mole_Wt+mass(j);
            y = j;
        end
    end
number = str2double(species_name(i));
if (number>1)
    Mole_Wt = Mole_Wt+mass(y)*(number-1);
end
sprintf('The molecular weight of %s is %d', species_name, Mole_Wt)
end
EXPLANATION :
- we using 'strcmp' command for the species name and array elements are compared.
- Then the atomic weight is added according to the compared string element value.
- To find the repetiton of elements of the same species, the numerical value is extracted using the str2double
- Then the atomic weight of the previous element is added to 'n-1' times.
RESULT :
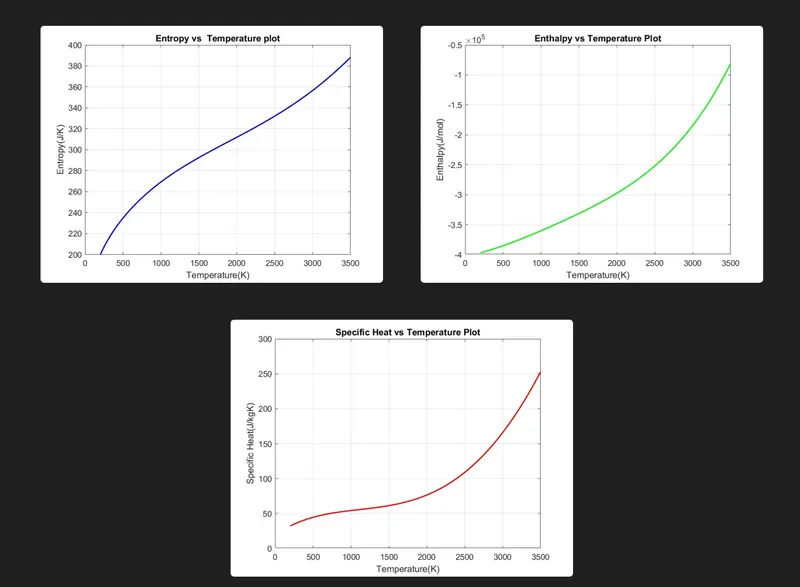
1) Plot for Oxygen:
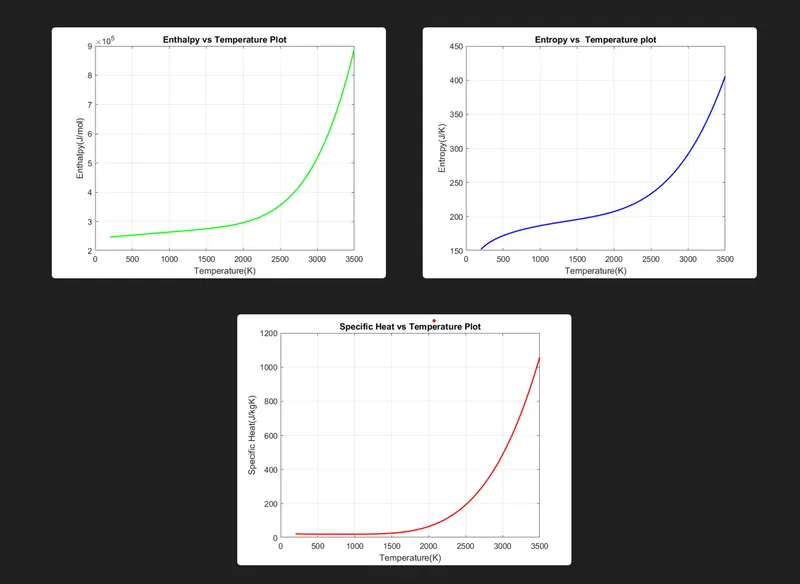
2) Plot for Nitrogen:
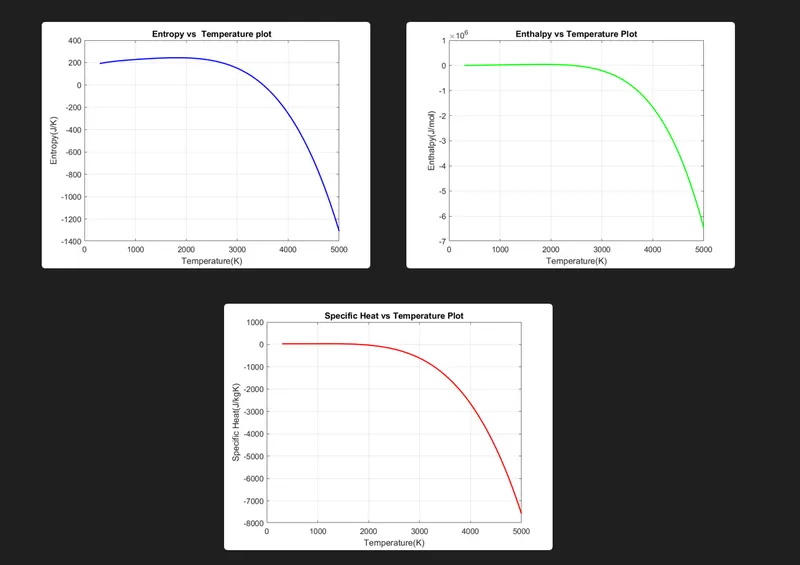
3) Plot for Carbon dioxide: