Project 1 - Parsing NASA thermodynamic data
AIM:
A program in matlab to function that extracts the 14 co-efficients and calculates the enthalpy, entropy and specific heats for all the species in the data file.
CONCEPT:
File parsing is a process of talking input data and breaking it down to appropriate compants and using this data.for data interprecation and data analysis. In matlab various file related and string related componds can be used for parsing here NASA polynomials are provided which are essentially used for curve fitting of Cp,S andH. various species the data file contains the global temperature range local temperature range and coefficient for low and high temperature ranges are provided.all this data needs to be accessed from the data file and broken down to usefull bits of information. and for that purpose stored in variables. then this values need to be supplied to given formulae and plots need to be generated.
BODY OF THE CONTENT:
- SOFTWARE USER -MATLAB
{MAIN CODING OF THE PROGRAM}
% Parsing_NASA_thermodynamic_data
clear all
close all
clc

% Reading the 'THERMODYNAMIC NASA' file
%using fopen to read the file
f = fopen('THERMO.dat','r');

% Skiping the first 5 lines using for loop

for i = 1:5

     fgetl(f);
 end

%  Parsing of all the species from the file
for i = 1:53

    % Using fget1 to access the first line of the first species 'o'
    a= fgetl(f);
    % Splitting the string a
    b = strsplit(a,' ');

     species_name = b{1};

    % Defining the length of 'b' to variable 'z', to position
    z = length(b);


    %Breaking the header information


    low_temp=str2double(b{z-3});
    high_temp=str2double(b{z-2});
    mid_temp=str2double(b{z-1});

   % Extraction the co_efficient
   % line 1
   co_line1 = fgetl(f);

    % Finding the position of E in 'line 1'
    pos_e1 = strfind(co_line1,'E');
    % we are converting string to number
    a1 = str2double(co_line1(1:pos_e1(1)+3));
    a2 = str2double(co_line1(pos_e1(1)+4:pos_e1(2)+3));
    a3 = str2double(co_line1(pos_e1(2)+4:pos_e1(3)+3));
    a4 = str2double(co_line1(pos_e1(3)+4:pos_e1(4)+3));
    a5 = str2double(co_line1(pos_e1(4)+4:pos_e1(5)+3));

    % Line 2
    co_line2 = fgetl(f);
    % Finding the position of E in 'line 2'
    pos_e2 = strfind(co_line2,'E');

    a6 = str2double(co_line2(1:pos_e2(1)+3));
    a7 = str2double(co_line2(pos_e2(1)+4:pos_e2(2)+3));
    a8 = str2double(co_line2(pos_e2(2)+4:pos_e2(3)+3));
    a9 = str2double(co_line2(pos_e2(3)+4:pos_e2(4)+3));
    a10 = str2double(co_line2(pos_e2(4)+4:pos_e2(5)+3));

    % line 3
    co_line3 = fgetl(f);
    % Finding the position of E in 'line 3'
    pos_e3 = strfind(co_line3,'E');

    a11 = str2double(co_line3(1:pos_e3(1)+3));
    a12 = str2double(co_line3(pos_e3(1)+4:pos_e3(2)+3));
    a13 = str2double(co_line3(pos_e3(2)+4:pos_e3(3)+3));
    a14= str2double(co_line3(pos_e3(3)+4:pos_e3(4)+3));


    %creating folder
    mkdir(['c:\Users\yukes\OneDrive\Documents\MATLAB\',species_name]);


     % Defining universal gas constant 'r'
    R = 8.314;

    % Calculate of Cp, H, S (specific Heat, Entropy, Entholphy)
    % a1-a7 (Hight temperature  coeffecient), a8-a14 (low temperature coeffecient)
    T = linspace(low_temp,high_temp,1000);

    for k=1:length(T)

        if T(k)>mid_temp

            %high temperature coeffeceints.
            Cp(k)= (a1 +a2*T(k) + a3*T(k)^2+ a4*T(k)^3 +a5*T(k)^4)*R;
            H(k)= (a1 + (a2*T(k))/2+ (a3*T(k)^2)/3+ (a4*T(k)^3)/4+ (a5*T(k)^4)/5+ a6/T(k))*R*T(k);
            S(k)=(a1*log(T(k))+ a2*T(k)+(a3*T(k)^2)/2+(a4*T(k)^3)/3+(a5*T(k)^4)/4+ a7)*R;
        else
            %low temperature coeffecients
            Cp(k) = (a8 +a9*T(k) +a10*T(k)^2 + a11*T(k)^3 +a12*T(k)^4)*R;
            H(k) = (a8+ (a9*T(k))/2+ (a10*T(k)^2)/3+ (a11*T(k)^3)/4+ (a12*T(k)^4)/5+ a13/T(k))*R*T(k);
            S(k) = (a8*log(T(k)) + a9*T(k)) + (a10*T(k)^2)/2 + (a11*T(k)^3)/3 +(a12*T(k)^4)/4+a14*R;
        end
    end

    %changing the directory and saving the file

     cd(['c:\Users\yukes\OneDrive\Documents\MATLAB\',species_name]);

    %plotting
    figure(1);
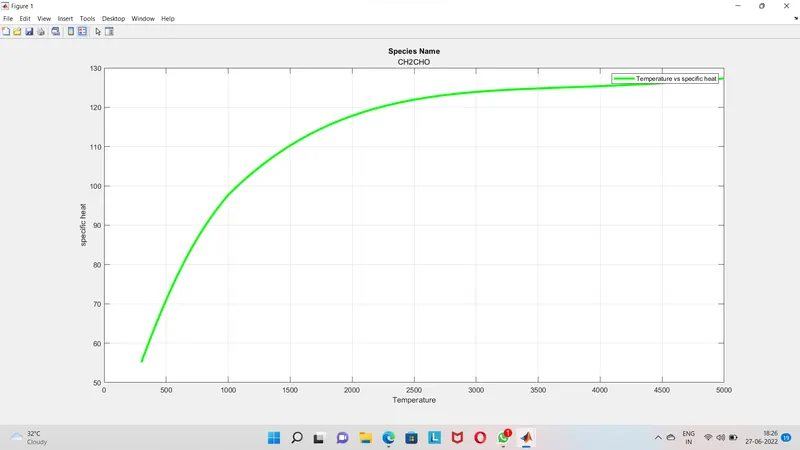
    plot(T,Cp,'LineWidth',3,'Color','g');
    grid on ;
    title('Species Name',species_name);
    xlabel('Temperature');
    ylabel('specific heat');
    legend('Temperature vs specific heat');
    saveas(1,'specific heat','jpg');


    figure(2);
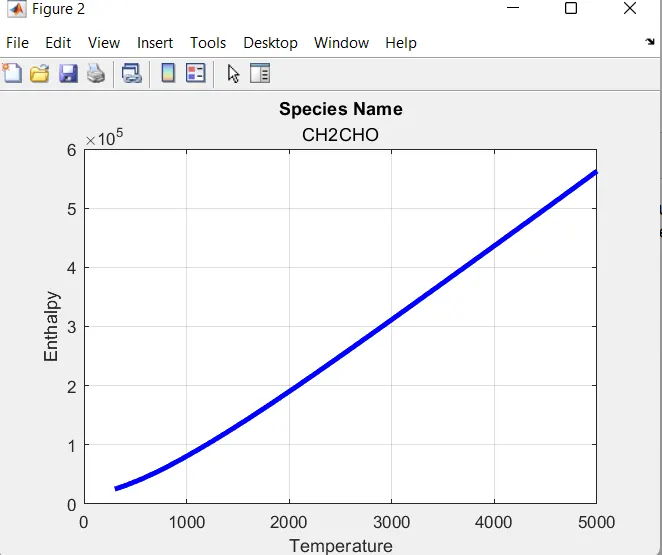
    plot(T,H,'LineWidth',3,'Color','b');
    grid on ;
    title('Species Name',species_name);
    xlabel('Temperature');
    ylabel('Enthalpy');
    saveas(2,'enthalpy','jpg');

    figure(3);
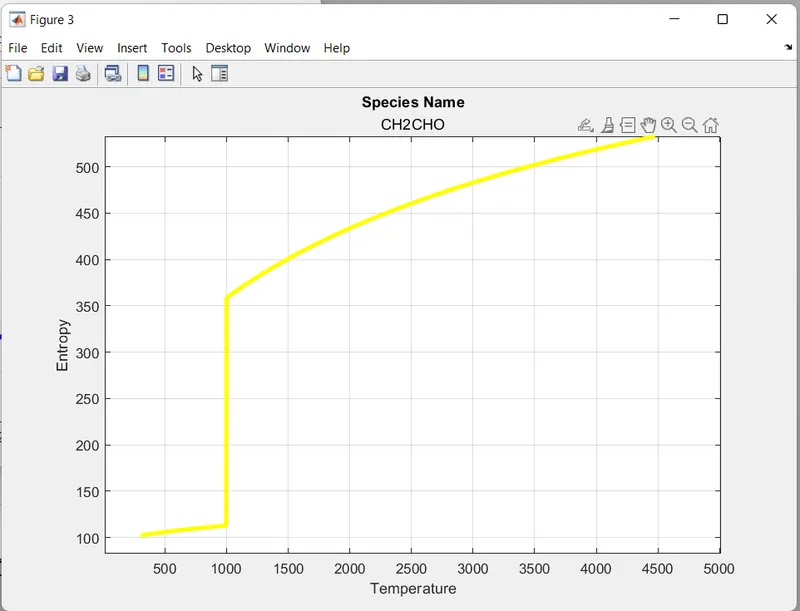
    plot(T,S,'LineWidth',3,'Color','y');
    grid on ;
    title('Species Name',species_name);
    xlabel('Temperature');
    ylabel('Entropy');
    saveas(3,'entropy','jpg');


    %molecular_masscalculation
    elements=['H','C','N','O','A'];
    atomic_wt=[1,12,14,16,40];
    mol_wt=0;

    for l = 1:length(species_name)
        for m=1:length(elements)
            if strcmp(species_name(l),elements(m))
                mol_wt=mol_wt+atomic_wt(m);
                position=m;
            end
        end
        p = str2double(species_name(l));
        if p>1
            mol_wt=mol_wt+atomic_wt(position)*(p-1);
        end
    end
    sprintf('Molecular weight of %s is %d ',species_name,mol_wt)

end

fclose(f)
- First few lines are the 'Basic commands' of the coding.
- clear all command is used to clear all the variables from the current workspace.
- close all command is useed to close all figures whose handles are visible.
- using For Loop function is used to skip the first 5 lines of the data.
- perform the loop variables properly inside the for loop command.
- IF & else command is used to skiped the data if values are grater are lower then high are lower temperature
- f=fopen(THERMO.dat):fopen command is used to open the specific file mentioned in the parenthesis.in the readed or write mode in which data is fetched are datab is writted to the file respectively. generated and stored in filed.
- fget1(f);this command is used to read the next line from the file.It is in the form of character vector excluding the new line character.
- feof(f);it indicates the position of the end_of_filemaker,it returs value l if pointer is at the end and o is the pointer if not yet at the end.
- fclose(f);it closes the file.
- strsplite(a,' ');it breaks the string input into many parts based on the belimiter.Belimiter specifed the pattern where the string needs to be a separated the broken bits are stored in the cell array.cell array is a special kind of array in which data of various type can be stored.It takes white space as the default delimiter and eliminates all the white space betten the other charaters.
- string(a);it is used to convert the input data type to string type.
- str2double(pos_e).Here the inputs is string of digits and this command is used to convert the string into double data type
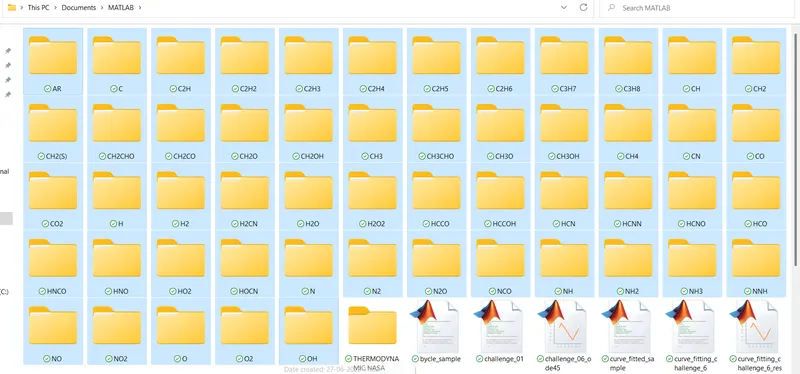
- mkdir parentfolder foldername it create a directory. A new folder is created by the name provided with in the parentfolder.
- saveas(gcf.species_name(species_name1,species_name2,...species_namepng)); this command is used to save the plotting figure window fullfile command is used to store the file of png format in the directory of the user choice folder names are provided in the species_name() to enter into it and store new life.
- linewidth command is used to given the width of the line which is going to be plotted on a graph.
- title is for giving title to the graph.
- close command closes the file in the end.
FORMULAS USED IN CODIND:
- In the programing points i learnt a bit more clear about the FOR LOOP function and how it works with this animation part. that was really awesome.
- Eventhough i am new to programing the tutorial video was very clear and helped me a lot to understand this functioning.