Project 1 - Parsing NASA thermodynamic data
Objectives:
1. To write a function that extracts the 14 co-efficients and calculates the enthalpy, entropy and specific heats for all the species in the data file. where the first 7 coefficients are HIGH-temperature coefficients and the second 7 coefficients are LOW-temperature coefficients.
2. To calculate the molecular weight of each species and display it in the command window.
3.To plot the Cp, Enthalpy and Entropy for the local temperature range (low temperature : high temperature) specific for each species.
4. To save the plots as images with appropriate names and dump them in separate folders for each species with suitable name. All these should be generated automatically.
- Function code of calculating the molecular weight of species is shown below:
function mole_wt = mol_wt(species_name)
weight = 0;
atoms = ['H','C','N','O','A'];
atom_weight = [1.008,12.011,14.007,15.999,39.948];

for i = 1:length(species_name)
    for j = 1: length(atoms)
        if strcmpi(species_name(i),atoms(j))
            weight = weight + atom_weight(j);
          y= j;
        end
    end
    number = str2double(species_name(i));
    if (number>1)
        weight = weight + (atom_weight(y)*(number-1));
    end
    mole_wt = weight;
end- The main program code is shown below:
clear all
close all
clc

% File reading

f= fopen('THERMO.dat','r');

% skipping the first 5 lines

for i= 1:5

    fgetl(f);

end

for i= 1:53
    a= fgetl(f);
    b = strsplit(a,' ');
 % extracting the local temperatures:
 species_name = b{1};

 z= length(b);
low_temp = str2double(b{z-3});
high_temp =str2double(b{z-2});
mid_temp = str2double(b{z-1});

co_line1 = fgetl(f);

position_E = strfind(co_line1,'E');

a1= str2double(co_line1(1:(position_E(1)+3)));
a2= str2double(co_line1((position_E(1)+4):(position_E(2)+3)));
a3= str2double(co_line1((position_E(2)+4):(position_E(3)+3)));
a4= str2double(co_line1((position_E(3)+4):(position_E(4)+3)));
a5= str2double(co_line1((position_E(4)+4):(position_E(5)+3)));

co_line2 = fgetl(f);

position_E1 = strfind(co_line2,'E');

a6= str2double(co_line2(1:(position_E1(1)+3)));
a7= str2double(co_line2((position_E1(1)+4):(position_E1(2)+3)));
a8= str2double(co_line2((position_E1(2)+4):(position_E1(3)+3)));
a9= str2double(co_line2((position_E1(3)+4):(position_E1(4)+3)));
a10= str2double(co_line2((position_E1(4)+4):(position_E1(5)+3)));


co_line3 = fgetl(f);
position_E2 = strfind(co_line3,'E');

a11= str2double(co_line3(1:(position_E2(1)+3)));
a12= str2double(co_line3((position_E2(1)+4):(position_E2(2)+3)));
a13= str2double(co_line3((position_E2(2)+4):(position_E2(3)+3)));
a14= str2double(co_line3((position_E2(3)+4):(position_E2(4)+3)));


% calculation of Specific heat , enthalpy and entropy:

R = 8.314;

T = linspace(low_temp,high_temp,500);

for k= 1:length(T)
    if T(k)>=mid_temp

        cp(k)= R*(a1 + (a2*T(k))+ a3*T(k).^2 + a4*T(k).^3 + a5*T(k).^4);
        H(k)= R* T(k)*(a1 + (a2*T(k))/2+ (a3*T(k).^2)/3 + (a4*T(k).^3)/4 + (a5*T(k).^4)/5 + a6./T(k));
        s(k)= R*(a1*log(T(k))+ a2*T(k)+ (a3*T(k).^2)/2 + (a4*T(k).^3)/3 + (a5*T(k).^4)/4 + a7);


    else
                cp(k)= R*(a8 + (a9*T(k))+ a10*T(k).^2 + a11*T(k).^3 + a12*T(k).^4);
        H(k)= R* T(k)*(a8 + (a9*T(k))/2+ (a10*T(k).^2)/3 + (a11*T(k).^3)/4 + (a12*T(k).^4)/5 + a13./T(k));
        s(k)= R*(a8*log(T(k))+ a9*T(k)+ (a10*T(k).^2)/2 + (a11*T(k).^3)/3 + (a12*T(k).SS^4)/4 + a14);
    end
end
mkdir(species_name)
cd(species_name)
figure(1)
plot(T,cp,'LineWidth',2,'Color','r')
xlabel('Temperature')
ylabel('Specific Heat')
title('Specific Heat vs Temperature')
grid on

figure(2)
plot(T,H,'LineWidth',2,'Color','r')
xlabel('Temperature')
ylabel('Enthalpy')
title('Enthalpy vs Temperature')
grid on


figure(3)
plot(T,s,'LineWidth',2,'Color','r')
xlabel('Temperature')
ylabel('Entropy')
title('Entropy vs Temperature')
grid on


saveas(1,'specificheat','jpg')
saveas(2,'enthalpy','jpg')
saveas(3,'entropy','jpg')
cd ..
% Calculating the Molecular weight of species:
    [M]=mol_wt(species_name);
    K = sprintf('%s Weight = %f',species_name,M);
    disp(K)

end
% fclose(f)
- Explaination of the code:
- Firstly, I have saved NASA thermodynamic data file in the same folder of programing code where is going to be saved. After that, I used 'f' variable to read the data file to be able to access its data in further porocess.
- Nextly, I used a for loop to skip the first 5 lines which are unnecessary.
- The second for loop I used to get the values of various species, extracting the local temperature values and define the position of 'E' in order to get to know the position of species coefficients. Furthermore, 'str2double' command was used to convert the strings into numbers.
- After the position of each species coefficients were defined, if loop was needed to calculate the specific heat, enthalpy and entropy values of each species.
- In order to save the files of species, I have created a file first using 'mdkir' command.
- After cp,h and s values were calculated, these values were assigned to plot them against various temperatures values and saved in species file as well using 'saveas' command.
- Last step, the molecular weight function was called to calculate molecular weight of species.
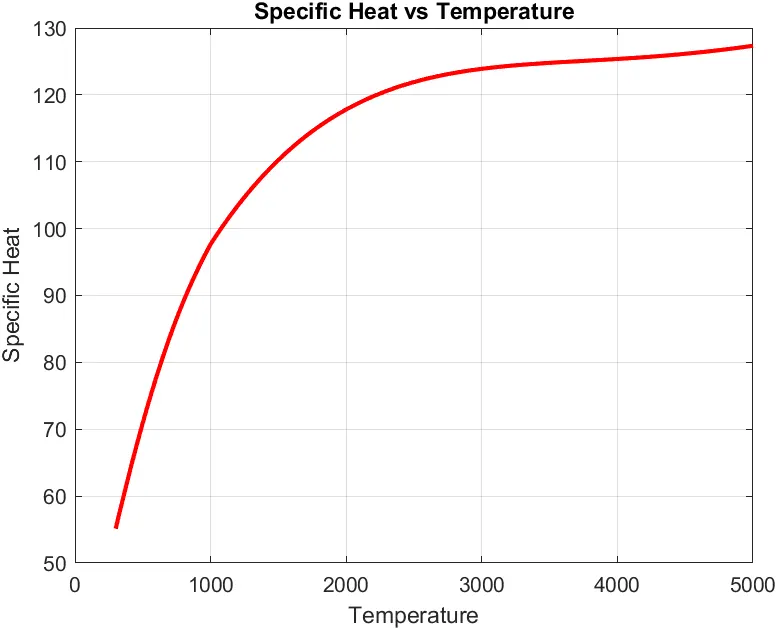
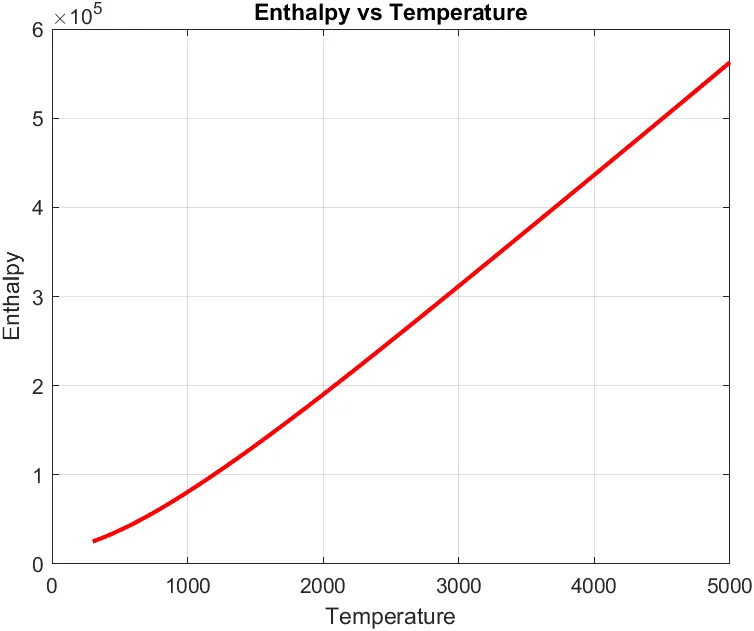
-Sample Plots
- specific heat vs Temperature plot:
- Enthalpy vs Temperature plot :
- Entopy vs Temperature plot:
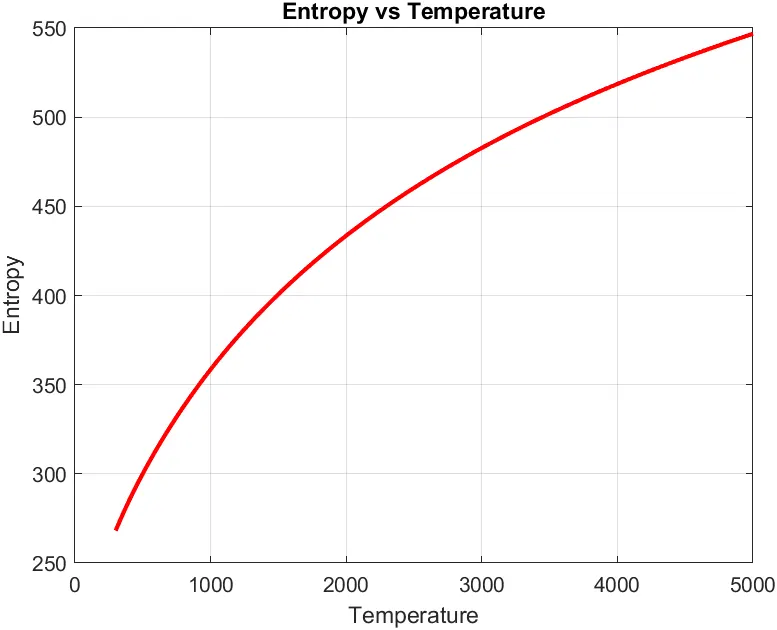
Note: The attached screenshots show that all graphs of species were automatically generated when the program was excuted, and also show the molecular weight values of all species which were printed in the command window.