Project 1 - Parsing NASA thermodynamic data
Aim: Write a code in Matlab to parse the NASA thermodynamic data and then calculate the thermodynamic properties of various gas species.
Objective:
1. Write a function that extracts the 14 coefficients and calculates the enthalpy, entropy, and specific heats for all the species in the data file. You will be reading this file NASA thermodynamic data (Tip: use fopen and fgetl).
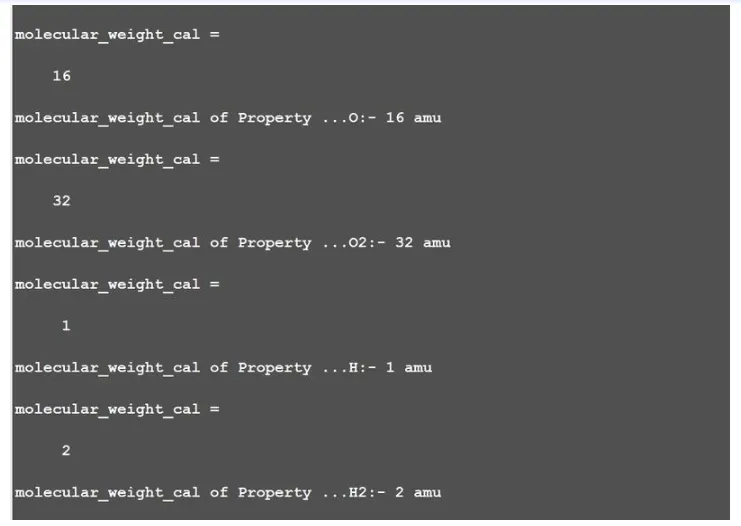
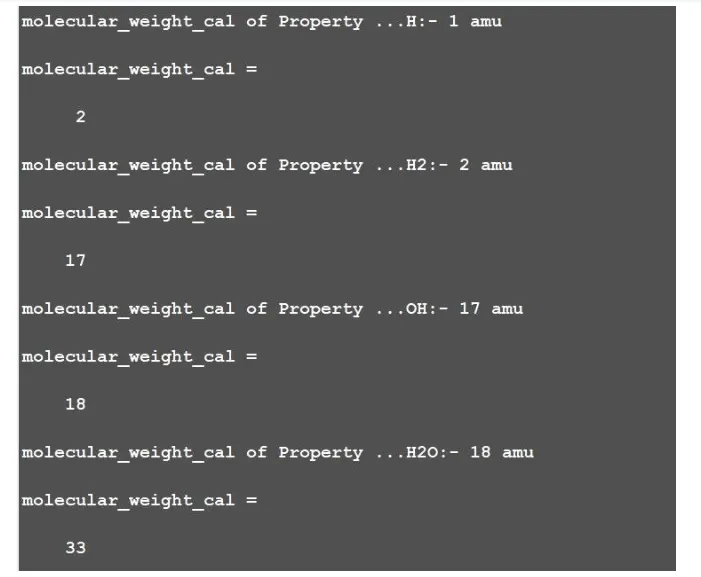
2. Calculate the molecular weight of each species and display it in the command window.
3. To plot the Cp, Enthalpy, and Entropy for the local temperature range (low temperature: high temperature) specific for each species.
4. Save the plots as images with appropriate names and dump them in separate folders for each species with a suitable name. All these should be generated automatically.
5. The main program that you will submit will just take the "THERMO.dat" file as an input and generate Cp, H, and Splots.
6. Screenshot of the window where all the folders are saved.
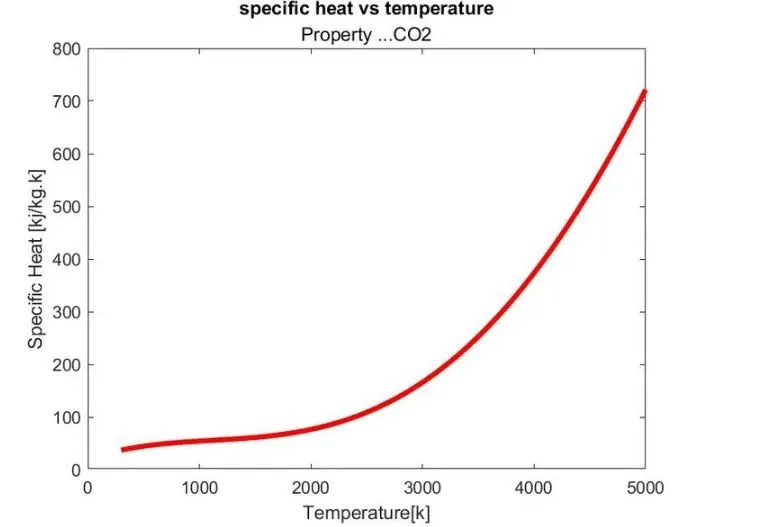
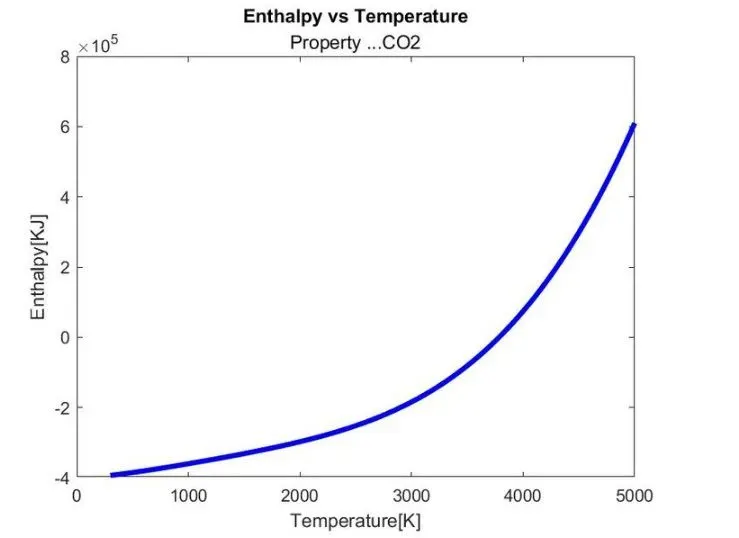
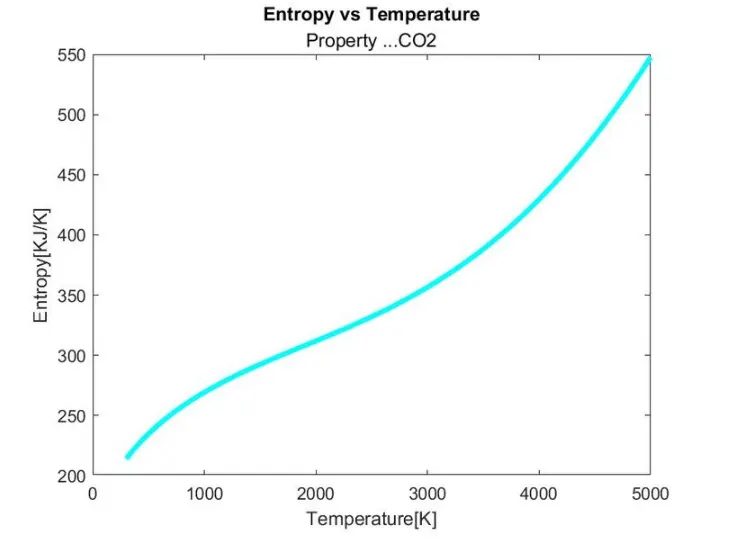
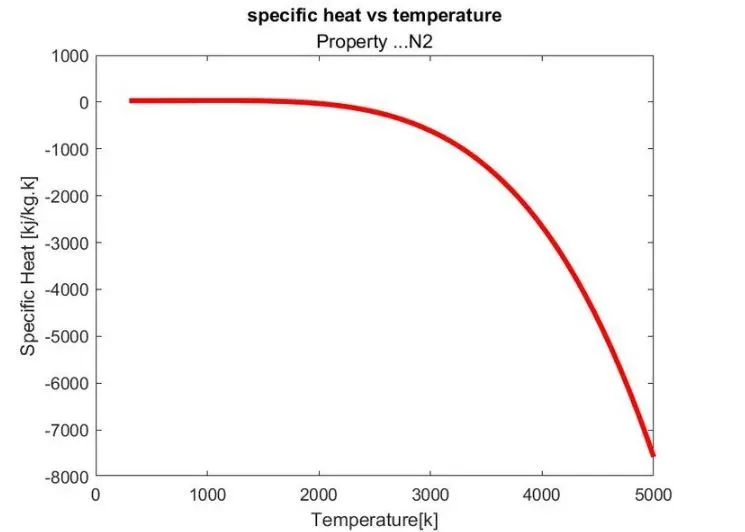
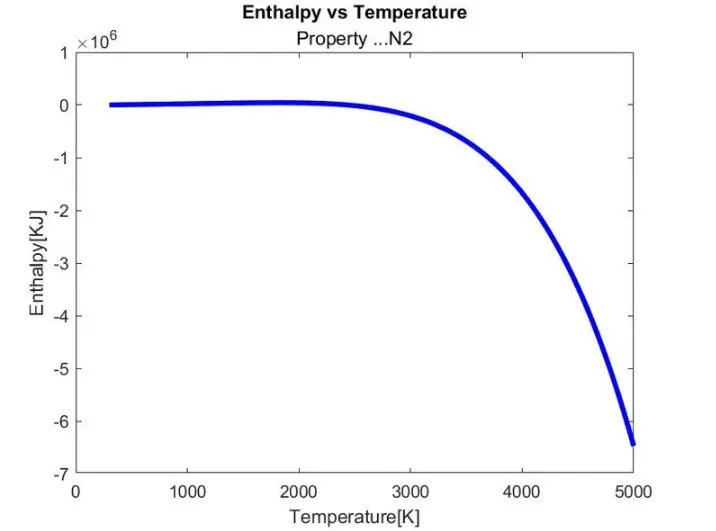
7. Plots for o2, N2, and Co2 species.
The Formula:
Where
R=Universal gas constant
T=Temperature
Cp= Specific heat(KJ)
S=Entropy(KJ/mol-K)
H=Enthalpy(KJ/mol)
a(i)=cooficients wher i=1 to 14
Theory:
File Parsing: Parsing, syntax analysis, or syntactic analysis is the process of analyzing a string of symbols, either in natural language, computer languages, or data structures, conforming to the rules of formal grammar. The term 'parsing' comes from Latin pars (orationis), meaning part (of speech). Within computational linguistics the term is used to refer to the formal analysis by a computer of a sentence or other string of words into its constituents, resulting in a parse tree showing their syntactic relation to each other, which may also contain semantic and other information (p-values). Some parsing algorithms may generate a parse forest or list of parse trees for a syntactically ambiguous input.
Parsing a file means reading in a data stream of some sort and building an in-memory model of the semantic contant of that data. This aims at facilitating performing some kind of transformation on the data.
Specific Heat:
The specific heat capacity (symbol cp) of a substance is the heat capacity of a sample of the substance divided by the mass. It is the amount of heat that must be added to one unit of mass of the substance in order to cause an increase of one unit in temperature. The SI unit of specific heat capacity is joule per kelvin per kilogram, J⋅kg−1⋅K−1. For example, the heat required to raise the temperature of 1 kg of water by 1 K is 4184 joules, so the specific heat capacity of water is 4184 J⋅kg−1⋅K−1.
Enthalpy:
Enthalpy a property of a thermodynamic system is the sum of the system's internal energy and the product of its pressure and volume. It is a state function used in many measurements in chemical, biological, and physical systems at a constant pressure, which is conveniently provided by the large ambient atmosphere.In the (SI), the unit of measurement for enthalpy is the joule.
Entropy: It is a scientific concept as well as a measurable physical property that is most commonly associated with a state of disorder, randomness, or uncertainty. The term and the concept are used in diverse fields, from classical thermodynamics, where it was first recognized, to the microscopic description of nature in statistical physics, and to the principles of information theory.
Explanation:
- Getting the heading of the file
- The given program will get the header of the file which starts with clear all, close all,clc.
- The command fopen will be used for reading the thermodynamic data.
- The fgetl command returns the next line of the specified file, removing the newline characters.
- If the file is nonempty, then fgetl returns the line as the character vector.
- If the file is empty and contains only the end-of-file marker, then fget returns the line as a numeric value -1.
Code:
% NASA Thermodynamic data and calculate the molecular weight

clear all
close all
clc

diary Results_NASA_Thermo_Data.txt;
%Getting the header info
f1 = fopen('THERMO.data','r');

header = fgetl(f1);
Getting the global temperature:
- The global temperature info is stored in the string so we use the command str2double so that it returns the value in {} as a string.
- Which gives us the cell array. From which we can get the global temperature value.
- for skipping the next three comments we use fgetl command.
Code:
%Geting the temperature data

global_temp = fgetl(f1);

x = strsplit(global_temp);

global_temp_low = str2double(x{2});
global_temp_mid = str2double(x{3});
global_temp_high = str2double(x{4});

fgetl(f1);
fgetl(f1);
fgetl(f1);
Getting the temperature info of individual species:
- The species name is stored in the length of 6 for that I use line1 (1:6) Matlab will get me the value and so on for getting the low_temp value which is on 49 to 55th location I used the command line 1 (49:55)Matlab will get me the value. As well as for higher temp and mid temp.
- Hear in this section I have to use the terms local_temp which shows I'm targeting the temperature of the species.
- And then converting to the string by using again str2double command. with giving temperature name low_temp,high_temp,mid_temp.
Code:
%getting the line
for i = 1:53
    line1=fgetl(f1);
    species_name = line1(1:6);

    %getting local temp
    local_temp1=line1(49:55);
    low_temp = str2double(local_temp1);

    local_temp2=line1(58:65);
    mid_temp = str2double(local_temp2);

    local_temp3=line1(68:75);
    high_temp = str2double(local_temp3);
Extracting the co-efficient values:
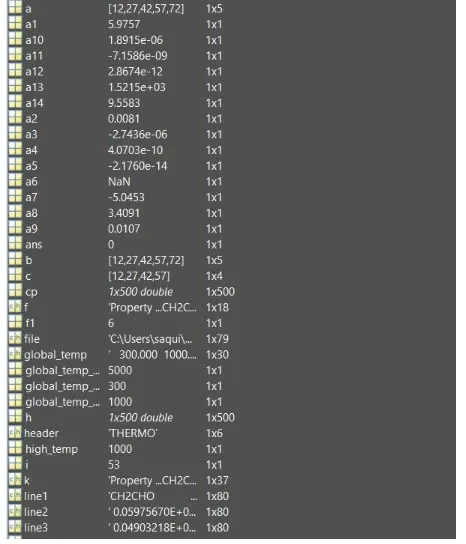
- In order to extract co-efficient values, I got the lines by fgetl command and marked the lines as line2, line3, and line4 and I use these lines to extract the co-efficient.
- By using line2, line3, and line4 I will try to separate the co-efficient by taking a constant E and I will use the command strfind to find E, which lies at the same position at every length.
- So I target E as the extractor of my co-efficient plus the extra numbers. and the same for all the 14 co-efficient.
- And to convert the string I have used the command str2double.
Code:
%Extraction the main coefficients from the data

    %coefficient

    line2 = fgetl(f1);
    line3 = fgetl(f1);
    line4 = fgetl(f1);

    a = strfind(line2, 'E');
    b = strfind(line3, 'E');
    c = strfind(line4, 'E');

    %For low temp

    a1 = str2double(line2(1:a(1)+3));
    a2 = str2double(line2(a(1)+4:a(2)+3));
    a3 = str2double(line2(a(2)+4:a(3)+3));
    a4 = str2double(line2(a(3)+4:a(4)+3));
    a5 = str2double(line2(a(4)+4:a(5)+3));
    a6 = str2double(line3(1:b(2)+3));
    a7 = str2double(line3(b(1)+4:b(2)+3));
    a8 = str2double(line3(b(2)+4:b(3)+3));
    a9 = str2double(line3(b(3)+4:b(4)+3));
    a10 = str2double(line3(b(4)+4:b(5)+3));
    a11 = str2double(line4(1:c(1)+3));
    a12 = str2double(line4(c(1)+4:c(2)+3));
    a13 = str2double(line4(c(2)+4:c(3)+3));
    a14 = str2double(line4(c(3)+4:c(4)+3));
Specific heat function:
- Here I have used the same formula as mentioned above. To calculate the cp, h and s value.
- 'For' loop is for representing these conditions for all three at once cp, hand s.
- 'If' loop is used here because there are conditions applied for finding the value of all 7 co-efficient of higher temperature and the value of 7 coefficients of lower temperature.
Code:
function[cp, h, s] = coeff(a1, a2, a3, a4, a5, a6, a7, a8, a9, a10, a11, a12, a13, a14,T);
%given conditions
R=8.314;
for j = 1:length(T)
if T(j)<300
cp = (a1+a2.*T+a3.*T.^2+a4.*T.^3+a5.*T.^4).*R;
h = (a1+(a2.*T)./2+(a3.*T.^2)./3+(a4.*T.^3)./4+(a5.T.^4)./5+(a6./T)).*R.*T;
s = (a1.*log(T)+a2.*T+(a3.*T.^2)./2+(a4.*T.^3)./3+(a5.*T.^4)./4+a7).*R;
else
cp=(a8+a9.*T+a10.*T.^2+a11.*T.^3+a12.*T.^4).*R;
h = (a8+(a9.*T)./2+(a10.*T.^2)./3+(a11.*T.^3)./4+(a12.*T.^4)./5+(a13./t)).*R.*T;
s = (a8.*log(T)+a9.*T+(a10.*T.^2)./2+(a11.*T.^3)./3+(a12.*T.^4)./4+a14).*R;
end
end
end
Molecular Weight function:
- Hence we can see the thermodynamic data contains 5 species that are oxygen, carbon,nitrogen, hydrogen, and argon.
- these are named as elements and are stored in an array.
- Whereas their atomic masses are stored in an atomic mass array.
- Here I have used the 'For' loop so that the process is to be repeated for each and every species.
- strcmp command is used to compair the elements and corresponding atomic mass.
- and the molecular weight is stored in mol_wt.
Code:
function [molecular_weight-cal] = mole_wt(species_name)
elements = {'H','N', 'O','C','A'};
atomic_mass = [1 14 16 12 40];

mol_wt = 0;
for i=1:length(species_name)
    for j=1:length(elements)
        if strcmp(species_name(i),elements(j))
            mol_wt = mol_wt+atomic_mass(j);
            m=j;
        end
    end

    s=str2double(species_name(i));
    if s>1
        mol_wt = mol_wt+(atomic_mass(m)*(s-1));
    end
end

molecular_weight_cal = mol_wt
fprintf('molecular_weight_cal of %s:-',species_name)
fprintf('%d',molecular_weight_cal)
fprintf('')
fprintf('amu')
fprintf('n')
end
Main Code:
% NASA Thermodynamic data and calculate the molecular weight

clear
close all
clc

diary Results_NASA_Thermo_Data.txt;
%Getting the header info
f1 = fopen('THERMO.dat','r');

header = fgetl(f1);

%Geting the temperature data

global_temp = fgetl(f1);

x = strsplit(global_temp);

global_temp_low = str2double(x{2});
global_temp_mid = str2double(x{3});
global_temp_high = str2double(x{4});

fgetl(f1);
fgetl(f1);
fgetl(f1);

%getting the line
for i = 1:53
    line1=fgetl(f1);
    species_name = line1(1:6);

    %getting local temp
    local_temp1 = line1(49:55);
    low_temp = str2double(local_temp1);

    local_temp2=line1(58:65);
    mid_temp = str2double(local_temp2);

    local_temp3=line1(68:75);
    high_temp = str2double(local_temp3);

    %Extraction the main coefficients from the data

    %coefficient

    line2 = fgetl(f1);
    line3 = fgetl(f1);
    line4 = fgetl(f1);

    a = strfind(line2, 'E');
    b = strfind(line3, 'E');
    c = strfind(line4, 'E');

    %For low temp

    a1 = str2double(line2(1:a(1)+3));
    a2 = str2double(line2(a(1)+4:a(2)+3));
    a3 = str2double(line2(a(2)+4:a(3)+3));
    a4 = str2double(line2(a(3)+4:a(4)+3));
    a5 = str2double(line2(a(4)+4:a(5)+3));
    a6 = str2double(line3(1:b(2)+3));
    a7 = str2double(line3(b(1)+4:b(2)+3));
    a8 = str2double(line3(b(2)+4:b(3)+3));
    a9 = str2double(line3(b(3)+4:b(4)+3));
    a10 = str2double(line3(b(4)+4:b(5)+3));
    a11 = str2double(line4(1:c(1)+3));
    a12 = str2double(line4(c(1)+4:c(2)+3));
    a13 = str2double(line4(c(2)+4:c(3)+3));
    a14 = str2double(line4(c(3)+4:c(4)+3));

    %Creating a folder 'Species' to save all the species_name
    species_name = strcat('property ...',species_name);

    file = pwd;
    %applying universal gas constant
    R = 8.314;
    T = linspace(global_temp_low,global_temp_high,500);

    %calculation speicfic heat
    [cp, h, s] = coeff(a1,a2,a3,a4,a5,a6,a7,a8,a9,a10,a11,a12,a13,a14,T);


    %plotting the graph
    %plotting between Temperature and specific heat

    figure(1)
    plot(T,cp,'linewidth',3,'color','r')
    title('specific heat vs temperature',species_name);
    xlabel('Temperature[k]');
    ylabel('Specific heat[kj/kg.k]');
    f = fullfile(species_name);
    cd(f);
    saveas(gcf,[pwd '/specific_heat vstemperature.jpg']);
    cd(file);

    %plotting between Temperature and Entropy

    figure(3)
    plot (T,s,'linewidth',3,'color','c');
    title('Entropy vs Temperature',species_name)
    xlabel('Temperature[K]')
    ylabel('Entropy[KJ/K]')
    f = fullfile(species_name);
    cd(f);
    saveas(gcf,[ped '/entropy vs temperature.jpg']);
    cd(file);


    molecular_weight_cal = mole_wt(species_name);
    k = sprintf('%s mol-wt = %f',species_name,molecular_weight_cal);
    disp(k);
end
fclose(f1);
Plots:
CO2: