Project 1 - Parsing NASA thermodynamic data
Aim:
- To write a MATLAB program to parse the NASA thermodynamic data file.
- Calculate thermodynamic properties of various gas species.
- Plot the Specific Heat(Cp),Enthalpy(H) and Entropy(S) for the local temperature range specific for each species.
Theory:
1) Parsing
parsing a file means reading in a data steam of some sort and building an in memory model of the semantic content of that data. IN otherwords, fle parsing refers to how information can be read from a particular text file or any type of file and how that information can be used to in a computer program.
Text parsing is a common programming task that splits the given sequence of characters or values(text) into smaller parts based on some rules.it has been used in a wide variety of applications ranging from simple file parsing to large scale natural language processing. For example, NASA came up with polynomials such as Cp,H and S. They have also documented the coefficients that are required to evaluate these polynomials for 1000+ species.
2) NASA Thermodynamic Data
'THERMO.dat' file is a data file containing 14 co-efficients for 53 different elements given by NASA. These co-efficients are uesd to calculate the enthalpy,entropy and specific heats for all the species in the data file. Each species also has own range of local temperatures.
3) Specific Heat Capaity,Cp(kj/kg-K)
Specific Heat capacity is the amount of heat to be suppiled to (or taken out of) the unit mass of a system in order to increase (or decrease) its temperature by one degree in a thermodynamic process in which quantity X is imposed.
`(Cp)/(R) = a1+a2*T+a3*T^2+a4*T^3+a5*T^4`
4) Enthalpy,H(kj)
It is a thermodynamic quantity equivalent to the total heat content of a system.It is equal to the internal energy of the system plus the product of pressure and volume.
`(H)/(RT) = a1+(a2*T/2)+(a3*(T^2)/3)+(a4*(T^3)/4)+(a5*(T^4)/5)+(a6*(1/T))`
5) Entropy,S(kj/K)
Entropy is the measure of a system thermal energy per unit temperature that is unavailable for doing useful work. Because work is ontained from ordered moplecular motion, the amout of entropy is also a measure of the molecular disorder, or randomness, of a system.`S/R = a1*lnT+a2*T+a3*(T^2)/2+a4*(T^3)/3+a5*(T^4)/4+a7`
List of User Defined Functions Used
- NASA_File_Parsing.m :Main program to perform all the tasks
- species_data_collect.m :Function to extract name,loacl temperatures and coefficients of each species in the data file
- specific_heat_calc.m :Function to calculate Specific Heat for 500 temperature values of each element.
- enthalpy_calc.m :Function to calculate enthalpy for 500 temperature values of each element.
- entropy_calc.m :Function to calculate entropy for 500 temperature values of each element.
- molecular_weight.m :Function to calculate Molecular Weigth of each element.
- plot_func.m :Function to plot(Cp,H,S) v/s T for each element.
- element_plot_showcase.m:Function to allow user to view the plots of a particular element of users choice.
MATLAB Code & Explanation
1. NASA-File_Parsing.m i.e Main Program
The program first opens the data file and extracts the global temperature values.Then it calculates the total number of element species by eliminating the number of unnecessary lines from total lines & dividing by number of lines containing the elements info.The program then callls the function species_data_collect.m for extacting the element name,loacl temperature values and the coefficients of each element from the file and stores the data in the data structure named 'species_data'.Then the program calls the functions specific_heat_calc.m,enthalpy_calc,entropy_calc.m & molecular_weight.m for calculating the specific heats,enthalpy,entropy and molecular weights of each element and stores in the structure 'species_data'.
Then the function plot_func.m is evoked for plotting Cp vs T,H vs T and S vs T graphs for each element and storing the graphs of each element in respective folders.
Finally the user is provided with the option to view the graphs of any partivular element by evoking the element_plot_showcase.m function.
%   NASA_File_Parsing.m
% Main program to parse the thermodynamic data file
clear all
close all
clc

R = 8.314;  %Universal Gas Constant in j/(mol*K)

%Opening data file in mode
f1 = fopen('THERMO.dat','r');
fgetl(f1);

%Extracting global temperatures data
global_temp_string = fgetl(f1);
global_temp = strsplit(global_temp_string,' ');
global_low_temp = str2double(global_temp{2});
global_mid_temp = str2double(global_temp{3});
global_high_temp = str2double(global_temp{4});
clear global_temp_string
clear global_temp

%calculating number of species
frewind(f1);
string = fgetl(f1);
i = 1;
while strcmp(string,'END')==0
    string = fgetl(f1);
    i = i + 1;
end
clear string
total_species = (i-6)/4;    %(i-6) for subtracting the first 5 and last line.
                            % division by 4 because each species have 4
                            % lines of data
frewind(f1);
for i = 1:5                 %Skipping first 5 lines
    fgetl(f1);
end
clear i
%Extracting data regarding all the species data form 'THERMO.dat' file
%into the structure 'species_data'

%Extraxting species name,local temperatures & coefficients
species_data = species_data_collect(f1,total_species);

%Calculation of Specific heat for 500 temperature values
species_data = specific_heat_calc(species_data,R);

%Calculation of Enthalpy for 500 temperature values
species_data = enthalpy_calc(species_data,R);

%Calculation of Entropy for 500 temperature values
species_data = entropy_calc(species_data,R);

%Calculation of Molecular weight for all species
species_data = molecular_weight(species_data);

%Plotting the Cp vs T,H vs T and S vs T plots for all the elements and
%saving them in seperate folders
plot_func(species_data)

%Displaying the Molecular Weights of elements
for i = 1:total_species
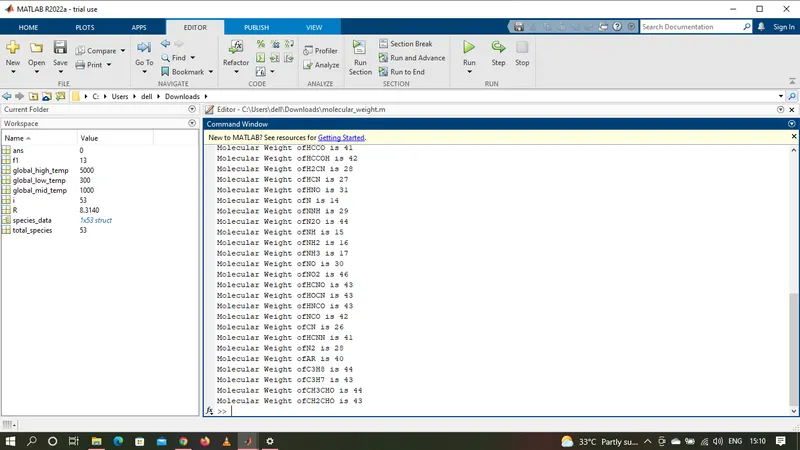
    disp(['Molecular Weight of',species_data(i).Name,' is ',num2str(species_data(i).Molec_Wt)])
end

fclose(f1);

%Asking user whether to show plots of any particular element or not
element_plot_showcase(species_data);
2. species_data_collect.m
i.e Function to extract the element name,local temperatures and coefficients
As input parameters the function accepts the file handle and number of element species. The function collects the element names,local temperatures and coefficients of each element and saves the data into a structure named 'maindata' under the fields 'Name','Local_Temp, and 'Coeff' respectively. Finally the function returns the structure which is saved into structure 'species_data'in the main program.
%     Species_data_collect.m
% This function extracts the species name,local temperatures and coefficients from the data file
function maindata = species_data_collect(f1,species_count)

% This function returns the species name,local temperatures and
% coefficients as the structre 'maindata'
for i = 1:species_count
    string = fgetl(f1);
    name = strtok(string);           %extracts the first token in 'string'
    temp_pos = strfind(string,'.');  %finding position of '.'in 'string'

    %Extracting the local temperatures
    local_low_temp = str2double(string(temp_pos(1)-3:temp_pos(1)+3));
    local_high_temp = str2double(string(temp_pos(2)-4:temp_pos(2)+3));
    local_mid_temp = str2double(string(temp_pos(3)-4:temp_pos(3)+3));

    %Saving the species name & local temperatures into the structure
    %'maindata'
    maindata(i).Name = name;
    maindata(i).Local_Temp = [local_low_temp,local_high_temp,local_mid_temp];

    %Extracting coefficients form first line
    line1 = fgetl(f1);
    E_pos1 = strfind(line1,'E');
    a1 = str2double(line1(1:E_pos1(1)+3));
    a2 = str2double(line1(E_pos1(1)+4:E_pos1(2)+3));
    a3 = str2double(line1(E_pos1(2)+4:E_pos1(3)+3));
    a4 = str2double(line1(E_pos1(3)+4:E_pos1(4)+3));
    a5 = str2double(line1(E_pos1(4)+4:E_pos1(5)+3));

    % Extracting coefficients from second line
    line2 = fgetl(f1);
    E_pos2 = strfind(line2,'E');
    a6 = str2double(line2(1:E_pos2(1)+3));
    a7 = str2double(line2(E_pos2(1)+4:E_pos2(2)+3));
    b1 = str2double(line2(E_pos2(2)+4:E_pos2(3)+3));
    b2 = str2double(line2(E_pos2(3)+4:E_pos2(4)+3));
    b3 = str2double(line2(E_pos2(4)+4:E_pos2(5)+3));

    % Extracting coefficients from third line
    line3 = fgetl(f1);
    E_pos3 = strfind(line3,'E');
    b4 = str2double(line3(1:E_pos3(1)+3));
    b5 = str2double(line3(E_pos3(1)+4:E_pos3(2)+3));
    b6 = str2double(line3(E_pos3(2)+4:E_pos3(3)+3));
    b7 = str2double(line3(E_pos3(3)+4:E_pos3(4)+3));

    % Saving the coefficients in the structure 'maindata'
    maindata(i).Coeff = [a1 a2 a3 a4 a5 a6 a7 b1 b2 b3 b4 b5 b6 b7];
end
3. specific_heat_calc.m i.e Function to calculate the specificic heat values for each element
The function accepts the structure 'species_data' and universal gas constant 'R' as inputs. The function first creates an array of temperature values for each element and calculates the specific heat values for each element and calculates the specific haet values for each temperature value using the data from the input structure.FInally the existing structure is updated with the temperature and corresponding specific heat values.
%  specific_heat_calc.m
%Function to calculate specific heat for 500 temperature values
%Cp = (a1 +_ a2*T + a3*T^2 + a4*T^3 + a5*T^4)*R

function maindata = specific_heat_calc(maindata,R)
struct_size = length(maindata);
for i = 1:struct_size
    llt = maindata(i).Local_Temp(1);
    lht = maindata(i).Local_Temp(2);
    lmt = maindata(i).Local_Temp(3);
    T = linspace(llt,lht,500);
    a = maindata(i).Coeff;
    for k = 1:length(T)
        % if condition: checks temperature with local mid temperature for
        % choosing the correct set of coefficients for Cp calculation
        if T(k)>= lmt
            % Here Cp will be calculated using high temperature
            % coefficents i.e a[1:7]
            Cp(k) = (a(1) + a(2)*T(k) + a(3)*T(k)^2 + a(4)*T(k)^3 + a(5)*T(k)^4)*R;
        else
            % Here Cp will be calculated using low temperature
            %coefficient i.e a[8:14]
            Cp(k) = (a(8) + a(9)*T(k) + a(10)*T(k)^2 + a(11)*T(k)^3 + a(12)*T(k)^4)*R;
        end
    end
    % Saving the Temperature values & Specific Heat Values of each species
    % in the structure 'maindata'
    maindata(i).Temp_Values = T;
    maindata(i).Sp_Heat_Values = Cp;
end
end
4 enthalpy_calc.m i.e Function to calculate the enthalpy values for each element
This function accepts the structure 'species_data' and universal gas constant 'R' as inputs. The function calculates the enthalpy values from the input structure. The structure is the then returned after updating it with the enthalpy values.
%                enthalpy_calc.m
% Function to calculate Enthalpy for 500 temperature values
% H = (a1 + a2*T/2 + a3*T^2/3 + a4*T^3/4 + a5*T^4/5 + a6/T)*R*T

function maindata = enthalpy_calc(maindata,R)
struct_size = length(maindata);
for i = 1:struct_size
    lmt = maindata(i).Local_Temp(3);
    T = maindata(i).Temp_Values;
    a = maindata(i).Coeff;
    for k = 1:length(T)
        % if condition: checks temperature with local mid temperature of
        % choosing the correct set of coefficients for H calculation
        if T(k)>=lmt
            % Here H will be calculated using high temperature
            %coefficients i.e a[1:7]
            H(k) = (a(1) + (a(2)*T(k))/2 + (a(3)*T(k)^2)/3 + (a(4)*T(k)^3)/4 + (a(5)*T(k)^4)/5 + a(6)/T(k))*R*T(k);
        else
            %Here H will be calculated using low temperature
            %coefficients i.e a[8:14]
            H(k) = (a(8) + (a(9)*T(k))/2 + (a(10)*T(k)^2)/3 + (a(11)*T(k)^3)/4 + (a(12)*T(k)^4)/5 + a(13)/T(k))*R*T(k);
        end
    end
    %Saving the Enthalpy Values of each species
    %in the structure 'maindata'
    maindata(i).Enthalpy_Values = H;
end
end
5 entropy_calc.m i.e Function to calculate the entropy values for each element
This function accepts the structure 'species_data' and universal gas constant 'R' as inputs. The function calculates the entropy values for each element using the temperature values and coefficent values from the input structure. The structre is the then returned after updating it with the entropy values.
%                entropy_calc.m
% Function to calculate Entropy for 500 temperature values
% H = (a1*logT + a2*T + (a3*T^2)/2 + (a4*T^3)/4 + (a5*T^4)/5 + a7)*R

function maindata = entropy_calc(maindata,R)
struct_size = length(maindata);
for i = 1:struct_size
    lmt = maindata(i).Local_Temp(3);
    T = maindata(i).Temp_Values;
    a = maindata(i).Coeff;
    for k = 1:length(T)
        % if condition: checks temperature with local mid temperature of
        % choosing the correct set of coefficients for S calculation
        if T(k)>=lmt
            % Here S will be calculated using high temperature
            %coefficients i.e a[1:7]
            S(k) = (a(1)*log(T(k)) + a(2)*T(k) + (a(3)*T(k)^2)/2 + (a(4)*T(k)^3)/3 + (a(5)*T(k)^4)/4 + a(7))*R;
        else
            %Here S will be calculated using low temperature
            %coefficients i.e a[8:14]
            S(k) = (a(8)*log(T(k)) + a(9)*T(k) + (a(10)*T(k)^2)/2 + (a(11)*T(k)^3)/3 + (a(12)*T(k)^4)/4 + a(14))*R;
        end
    end
    %Saving the Enthalpy Values of each species
    %in the structure 'maindata'
    maindata(i).Entropy_Values = S;
end
end
6. molecular_weight.m i.e Function to calculate the molecualr weigths of each element species
This fuction accepts the structure as input and calculates the molecular weigths of each element.To calculates the molecular weight,a character string of all the letters appearing in the name of element and an array of the atomic weight corresponding to the letters is required. A nested for loop & if statement is used to compare each letter of the element name by the character string. The moleculare weight is calculated letter by letter and if any numeric value came in between then it it is first converted from string to number and the atomic weight of the preceding elements is multiiplied by one value less than numerical value which is futher added to the molecular weight. This way the molecular weight of the element is calculated and is added into the data structure.
%            molecular_weight.m
%    Function to calculate Molecular Weight

function maindata = molecular_weight(maindata)

%Creating character vector  of all letters appering in the element name
std_element = {'C','H','O','N','A','S'};
%Creating atomic weight vector corresponding to the letters
atomic_wt = [12,1,16,14,40,32];

struct_size = length(maindata);
for i = 1:struct_size
    name = maindata(i).Name;
    mol_wt = 0;
    for j = 1:length(name)
        for k = 1:length(std_element)
            %Comparing the element name with vector-std_element
            if strcmp(name(j),std_element(k))==1
                mol_wt = mol_wt + atomic_wt(k);
                pos = k;
                break
            end
        end
        %Converting the number(but actually a string) in element name into
        num = str2double(name(j));
        if num>1
            mol_wt = mol_wt + (atomic_wt(pos).*(num-1));
        end
    end
    % Saving the Melocular Weight Values of each species
    % in the structure 'maindata'
    maindata(i).Molec_Wt = mol_wt;
end
end
7.plot_func.m i.e Function to plot (Cp,H,S) vs T graphs for each element
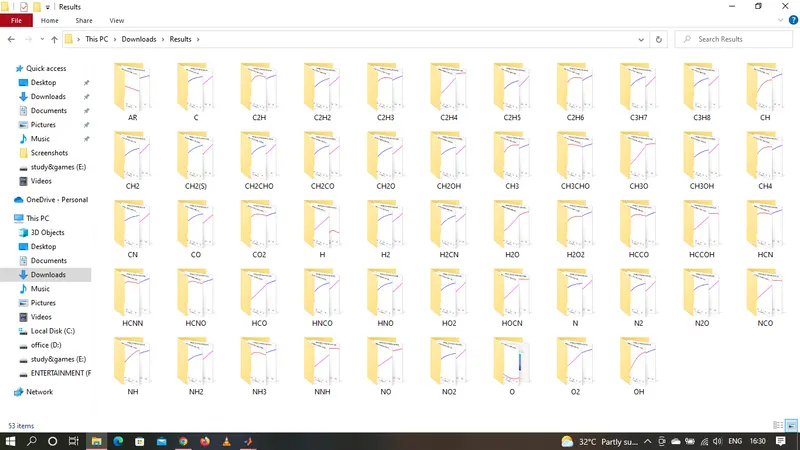
This function accepts the data structure as input parameter and plots the Specific Heat vs Temperature,Enthalpy vs Temperature,Entropy vs Temperature graphs for each element. Additionally,it creates a 'Results' folder under which a seperate folder for each element with element name. All 3 plots of an element is stored in its corresfonding folder.All these are generated automatically.
%           plot_func.m
% This function plots the Cp vs T , H vs T and T graphs for all elements in
% the input argument 'maindata' structre and saves them in seperate folders

function [] = plot_func(maindata)

struct_size = length(maindata);
for i = 1:struct_size
    name = maindata(i).Name;
    mkdir(['C:\Users\dell\Downloads\Results\',name]);     % Creates a new folder in the current directory
%     cd(name)
    % Plotting Specific Heat v/s Temperature Plot
    figure(1)
    plot(maindata(i).Temp_Values,maindata(i).Sp_Heat_Values,'Color','r','LineWidth',3)
    xlabel('Temperature T(K)')
    ylabel('Specific Heat Cp(kj/K)')
    title(sprintf('Specific Heat v/s Temperature plot for %s',name))

    %Plotting Enthalpy v/s Temperature plot
    figure(2)
    plot(maindata(i).Temp_Values,maindata(i).Enthalpy_Values,'Color','m','LineWidth',3)
    xlabel('Temperature T(K)')
    ylabel('Enthalpy(kj/kg)')
    title(sprintf('Enthalpy v/s Temperature plot for %s',name))

    %Plotting Entropy v/s Temperature plot
    figure(3)
    plot(maindata(i).Temp_Values,maindata(i).Entropy_Values,'Color','b','LineWidth',3)
    xlabel('Temperature T(K)')
    ylabel('Entropy(kj/K)')
    title(sprintf('Entropy v/s Temperature plot for %s',name))


    plot_1 = fullfile(path,name,'Specific_Heat_vs_Temperature_plot.jpg');
    plot_2 = fullfile(path,name,'Enthalpy_vs_Temperature_plot.jpg');
    plot_3 = fullfile(path,name,'Entropy_vs_Temperature_plot.jpg');

    cd(['C:\Users\dell\Downloads\Results\',name]);

    saveas(figure(1),'plot_1.jpg')
    saveas(figure(2),'plot_2.jpg')
    saveas(figure(3),'plot_3.jpg')
end
end
8. element_plot_showcase.m i.e Function to allow user to view the graphs of any particular element
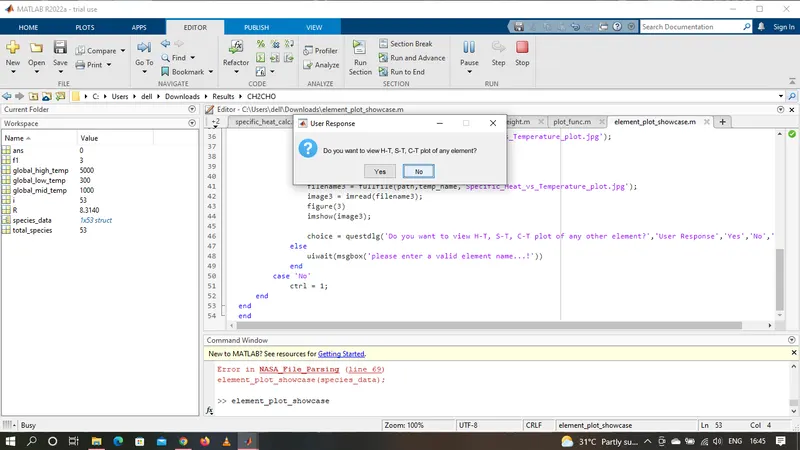
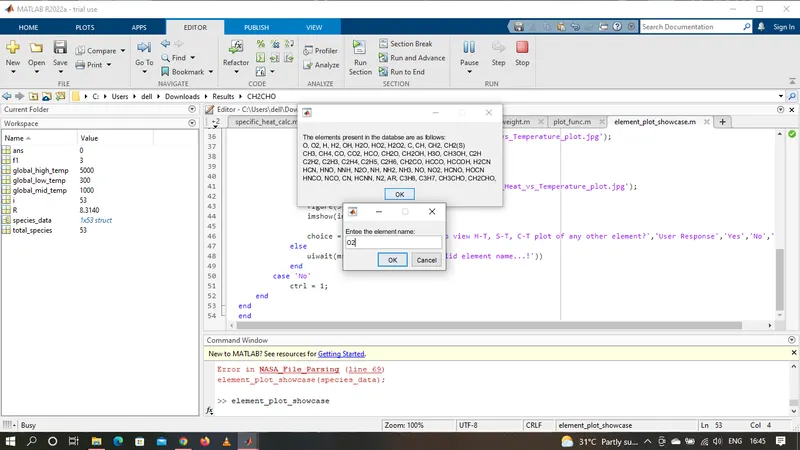
This function accepts the data structure as input.the function asks the useed whether or not to show plots of any particular element. So a while loop with test condition 'ctrl==0' os used. The user enters the element name which is compared from the element matches the element the index position is recorded. On successful matching the name of the element is concatenated to the path of the path of the result folder and is provided to impread function with the specific name of the plot .This way all the 3 plots can be accessed by the user. The loop terminates only when the user enters 'NO' as a choice to exit the program.
%             elementa_plot_showcase.m
% Thsi function displays the specific Heat,Enthalpy and Entropy plots of
% specific element as per user input

function [] = element_plot_showcase(maindata)

%Asking user Respone
choice = questdlg('Do you want to view H-T, S-T, C-T plot of any element?','User Response','Yes','No','No');
ctrl = 0;
while ctrl == 0
    switch choice
        case 'Yes'
            h = msgbox({'The elements present in the databse are as follows:'...'
                'O, O2, H, H2, OH, H2O, HO2, H2O2, C, CH, CH2, CH2(S)'...
                'CH3, CH4, CO, CO2, HCO, CH2O, CH2OH, H3O, CH3OH, C2H'...
                'C2H2, C2H3, C2H4, C2H5, C2H6, CH2CO, HCCO, HCCOH, H2CN'...
                'HCN, HNO, NNH, N2O, NH, NH2, NH3, NO, NO2, HCNO, HOCN'...
                'HNCO, NCO, CN, HCNN, N2, AR, C3H8, C3H7, CH3CHO, CH2CHO,'});
            user = inputdlg('Entee the element name:');
            delete(h);
            for n =1:length(maindata)
                temp_name = maindata(n).Name;
                if strcmpi(temp_name,user)==1
                    pos = n;
                    break
                end
            end

            if pos~= 0
                path = 'Downloads:Results\O';
                filename1 = fullfile(path,temp_name,'Enthalpy_vs_Temperature_plot.jpg');
                image1 = imread(filename1);
                figure(1)
                imshow(image1);

                filename2 = fullfile(path,temp_name,'Entropy_vs_Temperature_plot.jpg');
                image2 = imread(filename2);
                figure(2)
                imshow(image2);

                filename3 = fullfile(path,temp_name,'Specific_Heat_vs_Temperature_plot.jpg');
                image3 = imread(filename3);
                figure(3)
                imshow(image3);

                choice = questdlg('Do you want to view H-T, S-T, C-T plot of any other element?','User Response','Yes','No','No');
            else
                uiwait(msgbox('please enter a valid element name...!'))
            end
        case 'No'
            ctrl = 1;
    end
end
end
Screenshots
1.Molecular Weight of each species.
2. Screenshot of folders where files are saved
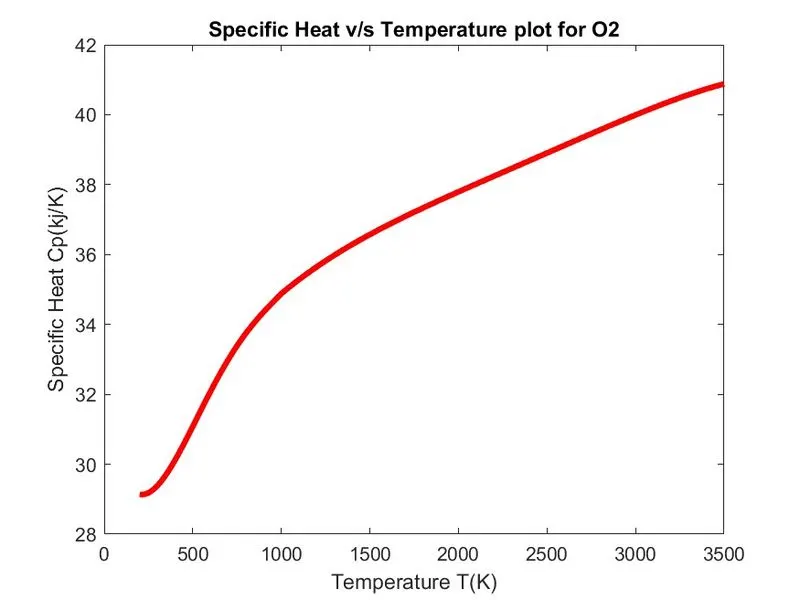
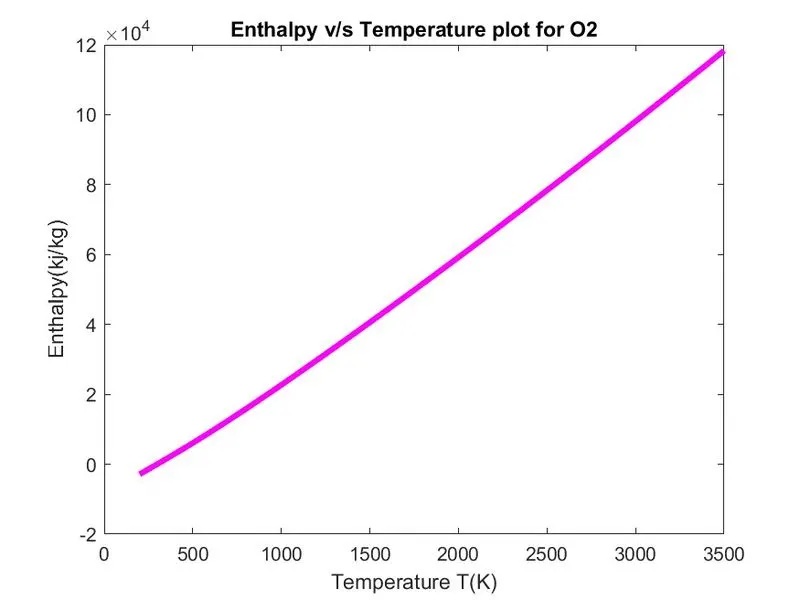
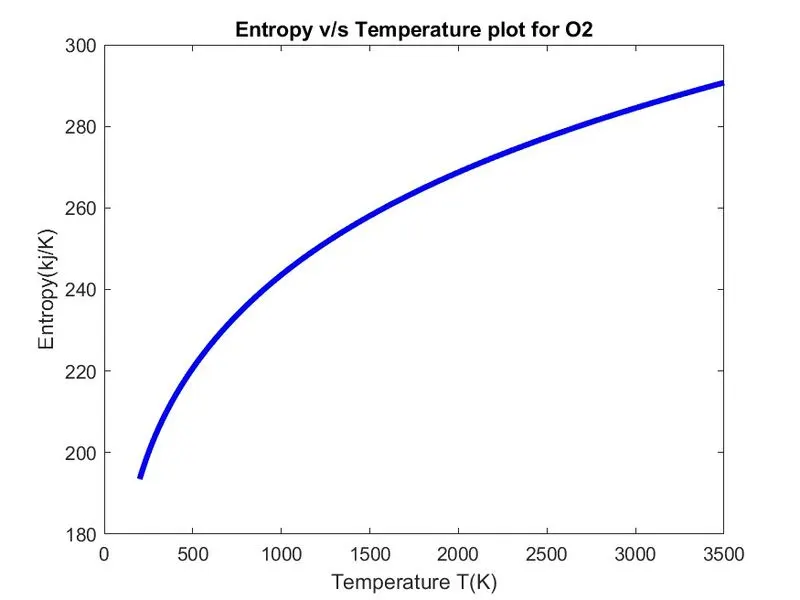
3.Plots for O2 when asked by user
- Specific Heat vs Temperature Plot
- Enthalpy vs Temperature Plot
- Entropy vs Temperature Plot
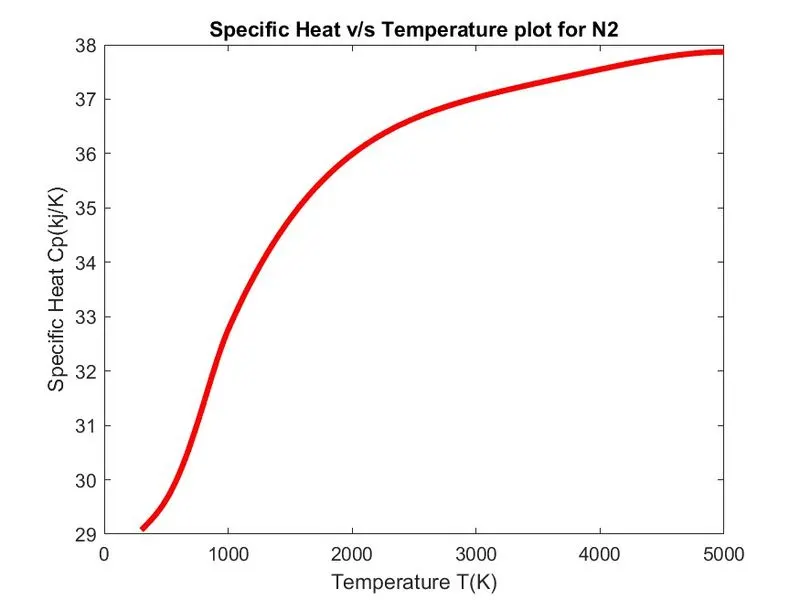
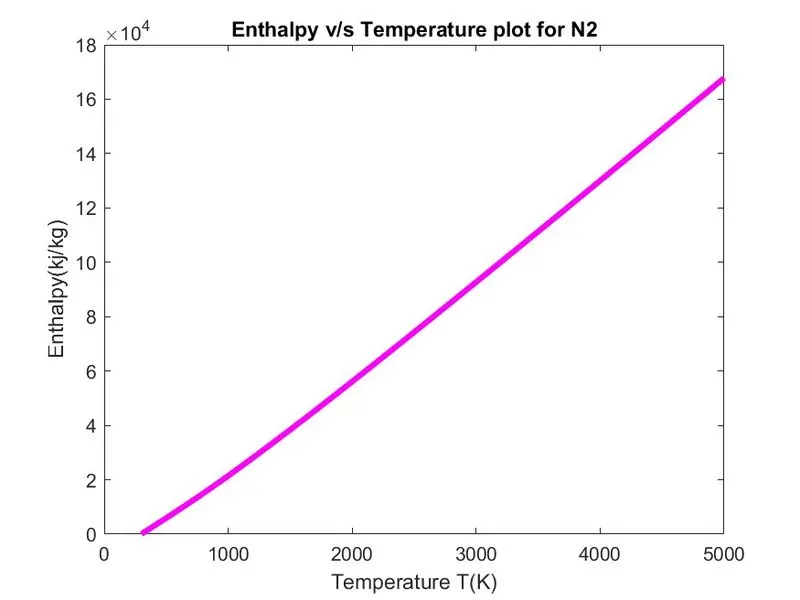
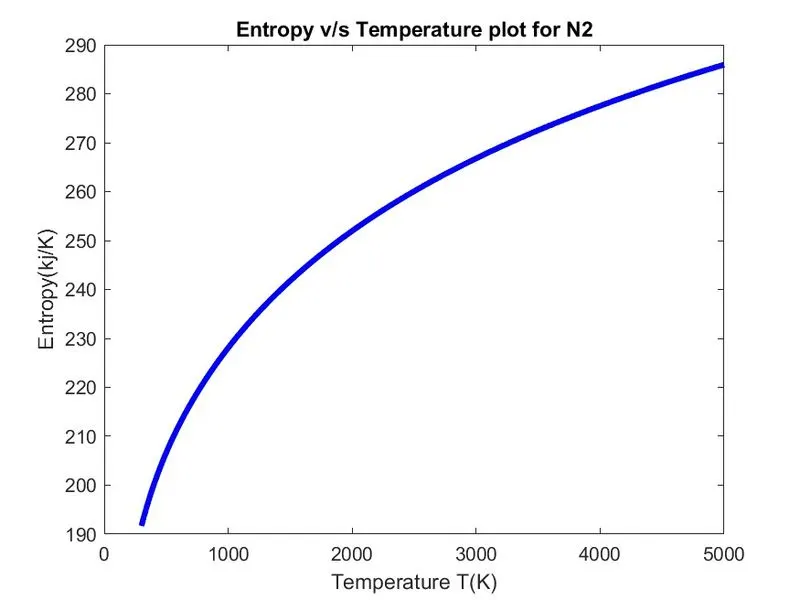
4. Plots for N2
- Specific Heat vs Temperature Plot
- Enthalpy vs Temperature Plot
- Entropy vs Temperature Plot
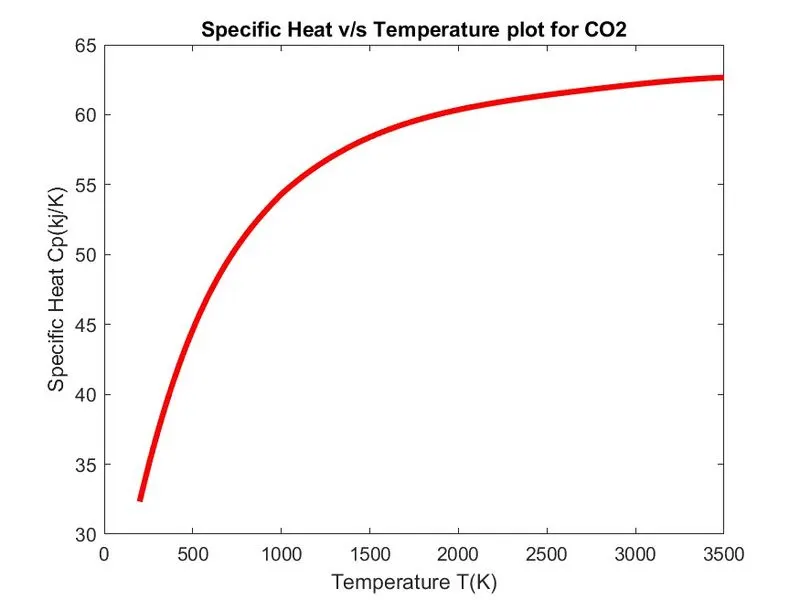
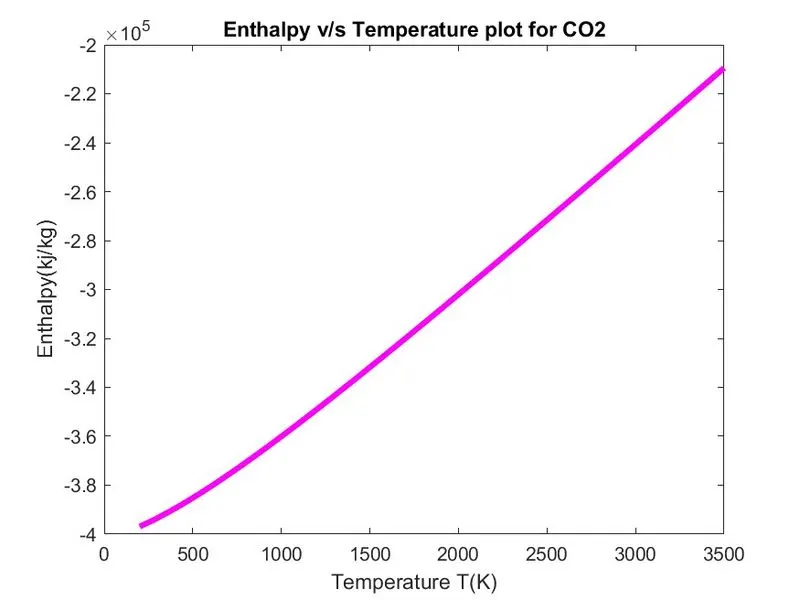
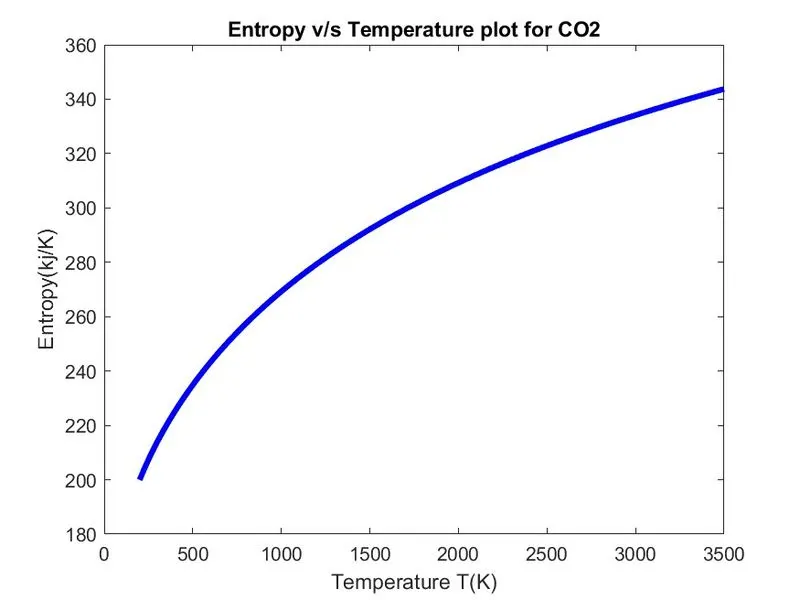
5.Plots for CO2
- Specific Heat vs Temperature Plot
- Enthalpy vs Temperature Plot
- Entropy vs Temperature Plot
Evaluation
To parse NASA thermodynamic file,the MATLAB code is developed by extensive research & development. The research inludes the know-how of file parsing,various MATLAB functions foe various tasks,alternative to make the code easy and efficient. Comments have been added at all the required places in the code for better understanding.Various alternative were tried to make the code much more efficient and reliable. At last error were detected and various methodologies were practiced to resolve the errors. The different plots for each element show the relation and trend between the thermodynamic properties like specific heat,enthalpy & entropy with respect to temperature.
Conclusion
The file parsing project includes several models from finding correct information,converting them to useful from, plotting the relations and saving them automatically at the correct location. All these tasks led to great learning of various functions related to file handlilng in MATLAB and cleared confusions between some function too.This project helps to enhance the thought process and logical thinking also. Overall, it was interesting and a bit challenging project to complete.