Project 1 - Parsing NASA thermodynamic data
LINKS
i have shared all my files in the google drive link below in zip file
https://drive.google.com/file/d/1M13h41a01GduMX3SisflxO_Ugky90Fz8/view?usp=sharing
Write a function that extracts the 14 co-efficients and calculates the enthalpy, entropy and specific heats for all the species in the data file. You will be reading this file NASA thermodynamic data
File parsing
Parsing a file means reading in a data stream of some sort and building an in memory model of the semantic content of that data.
This aims at facilitating perfoming some kind of transformation on the data.
NASA thermodynamic data
NASA provided us the data containing 14 coefficients of 53 different species.
list of 53 species provided
O
O2
H
H2
OH
H20
HO2
H2O2
C
CH
CH2
H2S
CH3
CH4
CO
CO2
HCO
CH2O
CH2OH
CH3O
CH30H
C2H
C2H2
C2H3
C2H4
C2H5
C2H6
CH2CO
HCCO
HCCOH
H2CN
HCN
HNO
N
NNH
N2O
NH
NH2
NH3
NO
NO2
HCNO
HOCN
HNCO
NCO
CN
HCNN
N2
AR
C3H8
C3H7
CH3CHO
CH2CHO
Enthalpy is the measurement of energy in a thermodynamic system.
The quantity of enthalpy equals to the total content of heat of a system, equivalent to the system’s internal energy plus the product of volume and pressure.
entropy,the measure of a system's thermal energy per unit temperature that is unavailable for doing useful work. Because work is obtained from ordered molecular motion,
the amount of entropy is also a measure of the molecular disorder, or randomness, of a system.
specific heat,the quantity of heat required to raise the temperature of one gram of a substance by one Celsius degree. The units of specific heat are usually calories or joules per gram per Celsius degree.
For example, the specific heat of water is 1 calorie (or 4.186 joules) per gram per Celsius degree.
enthalphy,entropy and specific heat is very important aspects of thermodynamics
NASA gave us these three in given below form

Here R is the universal gas constant, T is the temeprature
The FIRST 7 coefficients are HIGH-temperature coefficients and the SECOND 7 coefficients are LOW-temperature coefficients.
Also use the LOCAL TEMPERATURE RANGES which is unique for each individual species, not the GLOBAL TEMPERATURE RANGE.
steps to make this program
1. to calculate enthalphy,entropy and specific heat
I have made function and used the formula to caculate them
2.to calculate molecular weight
I have used the container.map ,i know it is little different but it is very
simple and easy to use method
A Map object is a data structure that allows you to retrieve values using a corresponding key.
Keys can be real numbers or character vectors. As a result, they provide more flexibility for data access
than array indices,which must be positive integers. Values can be scalar or nonscalar arrays.
I have also made the video and given the link on how to calculate molecular weight.
3.now to main code
first i have used the fopen and r to open and read the file
then used fgetl to read lines
secondly, stored the global variables by first splitting them using strsplit
then convertthem to num using str2double
T is denoted as temperature,gave the T values using linspace ,the linspace give the values in equal intervals
R is gas constant
for loop,used to find 53 species,for skipping lines and just count the lines you want to skip and
you will get your results
now we have 14 coefficients
a1,a2,a3,a4,a5,a6,a7,a8,a9,a10,a11,a12,a13,a14
HIGH-temperature coefficients
a1,a2,a3,a4,a5,a6,a7
LOW-temperature coefficients
a8,a9,a10,a11,a12,a13,a14
now to extract coefficients
used strfind,str2double to convert them to num
and after extracting coefficients
used plot commands
to plot graph between specific heat and temperature,enthalphy and temperature ,entropy and temperature
syntax used
fopen - to open the file
'r'- to read the file
fprintf -Write data to text file
ftell(f1)-tells Current position
strsplit - to split the string
str2double- convert string to num
linspace-linspace used to give same intervals
strfind-to find the string
plot-To plot graph
xlabel-for labelling the x-axis
ylabel-for labelling the y-axis
grid on -to show the grid lines
%function to calculate enthalphy

function
H=enthalphy(a1,a2,a3,a4,a5,a6,a7,a8,a9,a10,a11,a12,a13,a14,T,R,medium_global_temp)


if (T<=medium_global_temp)
    H=R.*T.*(a8+a9.*(T./2)+a10.*T.^(2/3)+a11.*T.^(3/4)+a12.*T.^(4/5)+(a13./T));%formula to calculate enthalphy
                                                                              %minimum coeffiecients

else
    H=R.*T.*(a1+a2.*(T./2)+a3.*T.^(2/3)+a4.*T.^(3/4)+a5.*T.^(4/5)+(a6./T));%formula to calculate enthalphy
                                                                            %%maximum coeffiecients
end


%function to calculate entropy

function S=entropy(a1,a2,a3,a4,a5,a6,a7,a8,a9,a10,a11,a12,a13,a14,T,R,medium_global_temp)


if (T<=medium_global_temp)
  S=R*(a8.*log(T)+a9.*T+a10.*T.^2/2+a11.*T.^3/3+a12.*T.^4/4+a14);%formula to calculate entropy
                                                                %minimum coeffiecients

else
    S=R*(a1.*log(T)+a2.*T+a3.*T.^2/2+a4.*T.^3/3+a5.*T.^4/4+a7); %formula to calculate entropy
                                                               %maximum coeffiecients

end


%function to calculate specific heat

function cp=specific_heat(a1,a2,a3,a4,a5,a6,a7,a8,a9,a10,a11,a12,a13,a14,T,R,medium_global_temp)


if (T <=medium_global_temp)

    cp=R*(a8+a9*T+a10*(T.^2)+a10*(T.^3)+a12*(T.^4));%formula to calculate specific heat
                                                    %minimum coeffiecients


else


    cp=R*(a1+a2*T+a3*(T.^2)+a4*(T.^3)+a5*(T.^4));%formula to calculate specific heat
                                                 %maximum coeffiecients

end


%to calculate molecular weight


%A Map object is a data structure that allows you to retrieve values using a corresponding key. %Keys can be real numbers or character vectors. As a result, they provide more flexibility for data access
%than array indices,which must be positive integers. Values can be scalar or nonscalar arrays.

key = {'H','C','O','N','AR','S'};%Return keys of Map object
value = [1.008 12.011 15.999 14.007 39.948 32.06];%Values, specified as an array.

atom = containers.Map(key,value);%creates a Map object that contains keys from keySet, each mapped to a
                                  % corresponding value from valueSet.
                                  %The input arguments keySet and valueSet must have
                                  %the same number of elements, with keySe

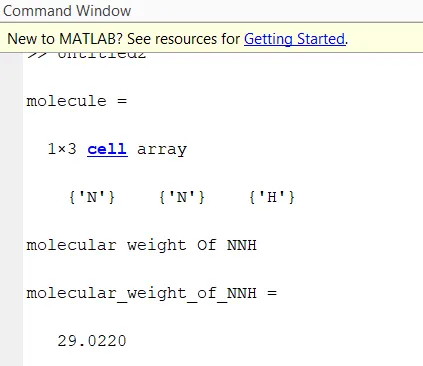
molecule = {'C','H','H','H','C','H','O'} %CH3CHO
disp('molecular weight Of CH3CHO');%to display the name

molecular_weight_of_CH3CHO = sum(cellfun(@(x) atom(x), molecule))%to calculate molecular
                                                                  %weight


main code


%Write a function that extracts the 14 co-efficients and
%calculates the enthalpy, entropy and specific heats for 'O' species in the data file.


f1=fopen('thermo.dat','r');%to open the file thermo.dat and used r used to read the file

line1=fgetl(f1);%Read line from file, removing newline characters

fprintf('line1=%s\n',line1);%Write data to text file


line2=fgetl(f1);%Read line from file, removing newline characters
ftell(f1)%tells Current position
fprintf('line=%s\n',line2);%Write data to text file

tline=line2;


A=strsplit(tline,' ');%to split the string
str2double(A{2})%convert string to num
low_global_temp=str2double(A{2});%convert string to num
str2double(A{3})%convert string to num
medium_global_temp=str2double(A{3});%convert string to num

str2double(A{4})%convert string to num
high_global_temp=str2double(A{4});%convert string to num
%temperature denoted as T
T=linspace(low_global_temp,high_global_temp,1000);%linspace used to give same intervals
                                                  %T is temperature values
R=8.314;%gas constant

%used this loop to skip the comments
for i=1:3              %with this loop i a skip lines and then i don't have to change values everytime
    line3to5=fgetl(f1);
end


%for O species
line6=fgetl(f1);

line7=fgetl(f1);


%now to extract coefficients

%HIGH-temperature coefficients
%a1,a2,a3,a4,a5,a6,a7

%LOW-temperature coefficients
%a8,a9,a10,a11,a12,a13,a14


tline2=line7;

a=strfind(tline2,'E');%to find the string E

tline2(1:a(1)+3)
a1=tline2(1:a(1)+3);
a1=str2double(a1);     %first coeffiecient %str2double convert string to num


a2=tline2(a(1)+4:a(2)+3);
a2=str2double(a2); %second coeffiecient %str2double convert string to num

a3=tline2(a(2)+4:a(3)+3);
a3=str2double(a3); %third coeffiecient %str2double convert string to num


a4=tline2(a(3)+4:a(4)+3);
a4=str2double(a4); %fourth coeffiecient %str2double convert string to num


a5=tline2(a(4)+4:a(5)+3);
a5=str2double(a5); %fifth coeffiecient %str2double convert string to num


line8=fgetl(f1);

tline3=line8;
a=strfind(tline3,'E');%to find the string E

a6=tline3(1:a(1)+3);
a6=str2double(a6);%sixth coeffiecient %str2double convert string to num

a7=tline3(a(1)+4:a(2)+3);
a7=str2double(a7);%seventh coeffiecient %str2double convert string to num

a8=tline3(a(2)+4:a(3)+3);
a8=str2double(a8);%eight coeffiecient %str2double convert string to num

a9=tline3(a(3)+4:a(4)+3);
a9=str2double(a9);%ninth coeffiecient %str2double convert string to num

a10=tline3(a(4)+4:a(5)+3);
a10=str2double(a10);%tenth coeffiecient %str2double convert string to num

line9=fgetl(f1);

tline4=line9;

a=strfind(tline4,'E');%to find the string E

a11=tline4(1:a(1)+3);
a11=str2double(a11);%eleventh coeffiecient %str2double convert string to num

a12=tline3(a(1)+4:a(2)+3);
a12=str2double(a12);%tweleth coeffiecient %str2double convert string to num

a13=tline3(a(2)+4:a(3)+3);
a13=str2double(a13);%thirteen coeffiecient %str2double convert string to num

a14=tline3(a(3)+4:a(4)+3);
a14=str2double(a14);%fourteen coeffiecient %str2double convert string to num


cp=specific_heat(a1,a2,a3,a4,a5,a6,a7,a8,a9,a10,a11,a12,a13,a14,T,R,medium_global_temp);%to calculate specific_heat

H=enthalphy(a1,a2,a3,a4,a5,a6,a7,a8,a9,a10,a11,a12,a13,a14,T,R,medium_global_temp);%to calculate  enthalphy

S=entropy(a1,a2,a3,a4,a5,a6,a7,a8,a9,a10,a11,a12,a13,a14,T,R,medium_global_temp);%to calculate entropy


figure(1)

plot(T,cp,'color','r','linewidth',1.5)%To plot between T and cp
xlabel('TEMPERATURE [K]');%for labelling the x-axis
ylabel('specific_heat [KJ]')%for labelling the y-axis
grid on %to show the grid lines


figure(2)

plot(T,H,'color','r','linewidth',1.5)%To plot between T and H
xlabel('TEMPERATURE [K]');%for labelling the x-axis
ylabel('Enthalphy [KJ/mol]')%for labelling the y-axis
grid on%to show the grid lines

figure(3)

plot(T,S,'color','r','linewidth',1.5)%To plot between T and S
xlabel('TEMPERATURE [K]');%for labelling the x-axis
ylabel('Entropy [J⋅K−1]')%for labelling the y-axis
grid on %to show the grid lines
REFERENCES
https://in.mathworks.com/matlabcentral/answers/106320-make-a-loop-to-calculate-molecular-weight
https://www.quora.com/What-does-it-means-to-parse-a-file
google search