Project 1 - Parsing NASA thermodynamic data
REPORT:
- First NASA data is opened by using the fopen command.
t_data=fopen('THERMO.dat','r');
- data is converted into 1-row and 3 columns to get global temperature.
fgetl(t_data)a=fscanf(t_data,'%s',[1 3]);
- And for finding the coefficients of species, a for loop is used.
for i=1:53line1=fgetl(t_data);line2=fgetl(t_data);line3=fgetl(t_data);line4=fgetl(t_data);
- in for loop up to 53 elements code is written in such a way that every line of data is extracted and converted from string and saved into coefficients.
- To find all parameters, a separate function code is written for each. (CP, ENTHALPY, ENTROPY)
function cP=cp(a1,a2,a3,a4,a5,a6,a7,a8,a9,a10,a11,a12,a13,a14,lowtemp,hightemp,temp,R)midtemp1=(lowtemp+hightemp)/2;if temp<midtemp1cP=(a1+a2.*temp+a3.*temp.^2+a3.*temp.^4*+a4.*temp.^5)*R; %high temperature values.elsecP=(a8+a9.*temp+a10.*temp.^2+a11.*temp.^4*+a12.*temp.^5)*R; %low temperature values.endend
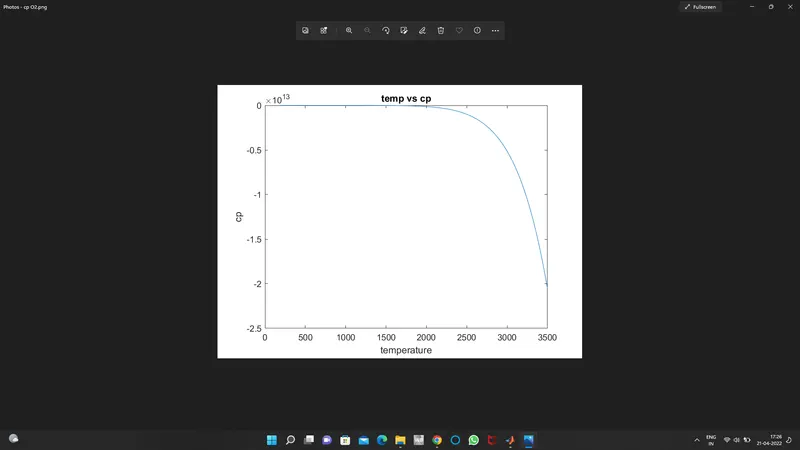
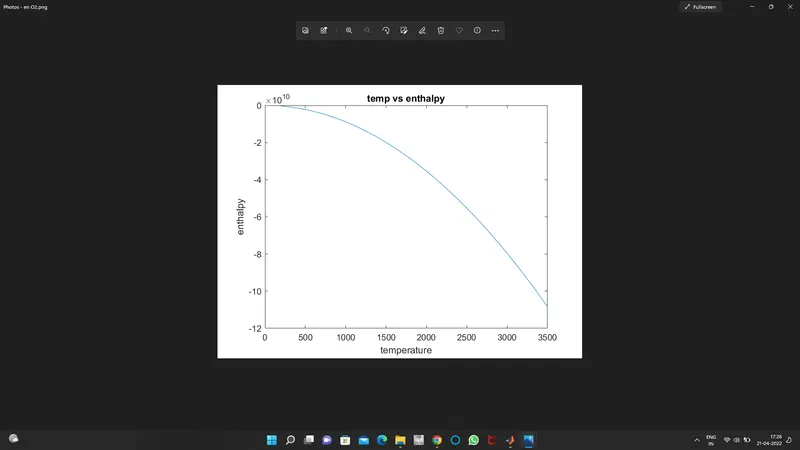
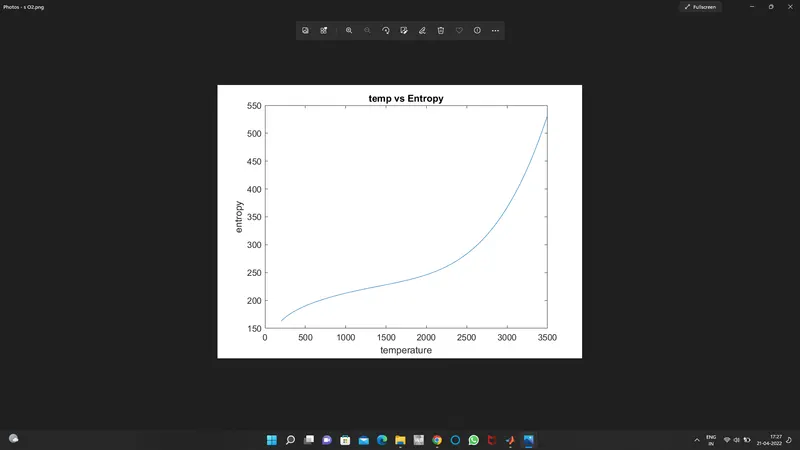
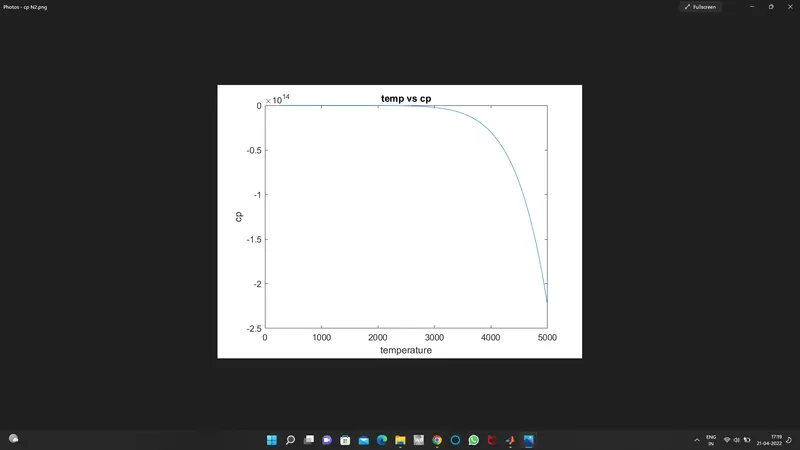
- A directory is created and kept open, and graphs are plotted for each temperature value.
nasa_data=species;mkdir(nasa_data)cd(nasa_data)
- and the graph is saved into a file and closed.
figure(1)plot(temp,cP)xlabel('temperature')ylabel('cp')title('temp vs cp')legend('lowtemp','hightemp')figure=sprintf("cp %s.png",species);saveas(gca,figure)
%function for specific heat function cP=cp(a1,a2,a3,a4,a5,a6,a7,a8,a9,a10,a11,a12,a13,a14,lowtemp,hightemp,temp,R) midtemp1=(lowtemp+hightemp)/2; if temp<midtemp1 cP=(a1+a2.*temp+a3.*temp.^2+a3.*temp.^4*+a4.*temp.^5)*R; %high temperature values. else cP=(a8+a9.*temp+a10.*temp.^2+a11.*temp.^4*+a12.*temp.^5)*R; %low temperature values. end end %function for enthalpy function enthalpy=H(a1,a2,a3,a4,a5,a6,a7,a8,a9,a10,a11,a12,a13,a14,lowtemp,hightemp,temp,R) midtemp1=(lowtemp+hightemp)/2; if temp<midtemp1 enthalpy=(a1+a2.*temp/2+a3.*(temp.^2)/3+a4.*(temp.^3)/4+a5.*(temp.^4)/5+a6.*temp)*R.*temp; %hightemperature values. else enthalpy=(a8+a9.*temp/2+a10.*(temp.^2)/3+a11.*(temp.^3)/4+a12.*(temp.^4)/5+a13.*temp)*R.*temp; %low temperature values. end end %function for entropy function Entropy=en(a1,a2,a3,a4,a5,a6,a7,a8,a9,a10,a11,a12,a13,a14,lowtemp,hightemp,temp,R) midtemp1=(lowtemp+hightemp)/2; if temp<midtemp1 Entropy=(a1.*log(temp)+a2*temp+a3.*(temp.^2)/2+a4.*(temp.^3)/3+a5.*(temp.^4)/4+a7)*R; %high temperature values. else Entropy=(a8.*log(temp)+a9*temp+a10.*(temp.^2)/2+a11.*(temp.^3)/3+a12.*(temp.^4)/4+a14)*R; %low temperature values. end end %main function close all clear all clc t_data=fopen('THERMO.dat','r'); %open the data file. fgetl(t_data) a=fscanf(t_data,'%s',[1 3]); %coverting into 1 row 3 columns % getting global temperature values. global_temp1=a(1:7); global_temp1=str2double(global_temp1); global_temp2=a(8:15); global_temp2=str2double(global_temp2); global_temp3=a(16:23); global_temp3=str2double(global_temp3); for i =1:4 fgetl(t_data); end % getting local temparature and coefficents for all elements. for i=1:53 line1=fgetl(t_data); A=strsplit(line1,' '); s=length(A); species=A{1} lowtemp=str2double(A{s-3}); midtemp=str2double(A{s-1}); hightemp=str2double(A(s-2)); temp=linspace(lowtemp,hightemp,100); R=8.314; line2=fgetl(t_data); K=strfind(line2,'E'); a1=str2double(line2(1:K(1)+3)); a2=str2double(line2(K(1)+4:K(2)+3)); a3=str2double(line2(K(2)+4:K(3)+3)); a4=str2double(line2(K(3)+4:K(4)+3)); a5=str2double(line2(K(4)+4:K(5)+3)); line3=fgetl(t_data); a6=str2double(line3(1:K(1)+3)); a7=str2double(line3(K(1)+4:K(2)+3)); a8=str2double(line3(K(2)+4:K(3)+3)); a9=str2double(line3(K(3)+4:K(4)+3)); a10=str2double(line3(K(4)+4:K(5)+3)); line4=fgetl(t_data); a11=str2double(line4(1:K(1)+3)); a12=str2double(line4(K(1)+4:K(2)+3)); a13=str2double(line4(K(2)+4:K(3)+3)); a14=str2double(line3(K(3)+4:K(4)+3)); %parameters for all temerature values. cP=cp(a1,a2,a3,a4,a5,a6,a7,a8,a9,a10,a11,a12,a13,a14,lowtemp,hightemp,temp,R); Entropy=en(a1,a2,a3,a4,a5,a6,a7,a8,a9,a10,a11,a12,a13,a14,lowtemp,hightemp,temp,R); enthalpy=H(a1,a2,a3,a4,a5,a6,a7,a8,a9,a10,a11,a12,a13,a14,lowtemp,hightemp,temp,R); %creating folders nasa_data=species; mkdir(nasa_data) cd(nasa_data) %plotting %temp vs cp figure(1) plot(temp,cP) xlabel('temperature') ylabel('cp') title('temp vs cp') figure=sprintf("cp %s.png",species); saveas(gca,figure) %plotting %temp vs entropy plot(temp,Entropy) xlabel('temperature') ylabel('entropy') title('temp vs Entropy') figure1=sprintf("s %s.png",species); saveas(gca,figure1) %plotting %temp vs enthalpy plot(temp,enthalpy) xlabel('temperature') ylabel('enthalpy') title('temp vs enthalpy') figure2=sprintf("en %s.png",species); saveas(gca,figure2) cd('C:\Users\1ms18\OneDrive\Documents\MATLAB\NASADATA\') end - 7 and 8 steps are repeated for all species.
ERRORS:
1. Incorrect dimensions for matrix multiplication.
2. unable to use the value of type cell as an index.
Steps were taken to overcome errors:
1. First was due to the missing dot operator.it was corrected by using the dot operator.
2. second was due to a syntax error.
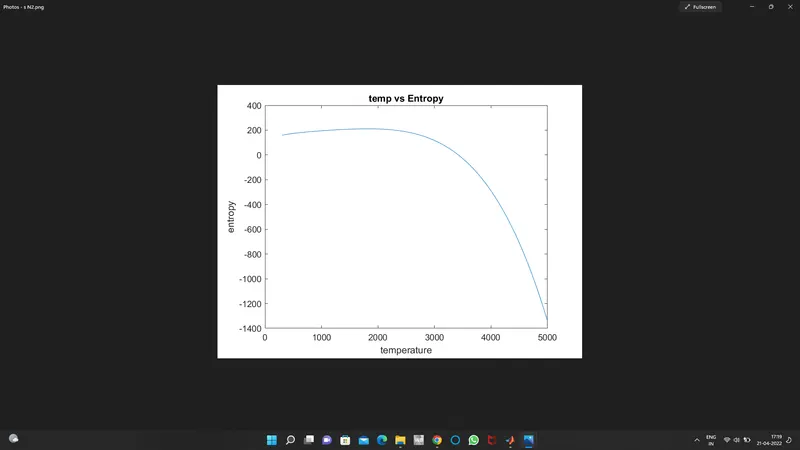
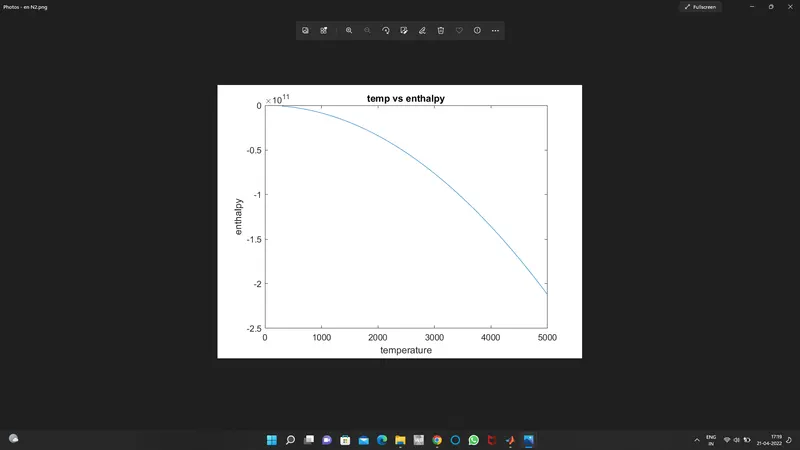
N2 GRAPH
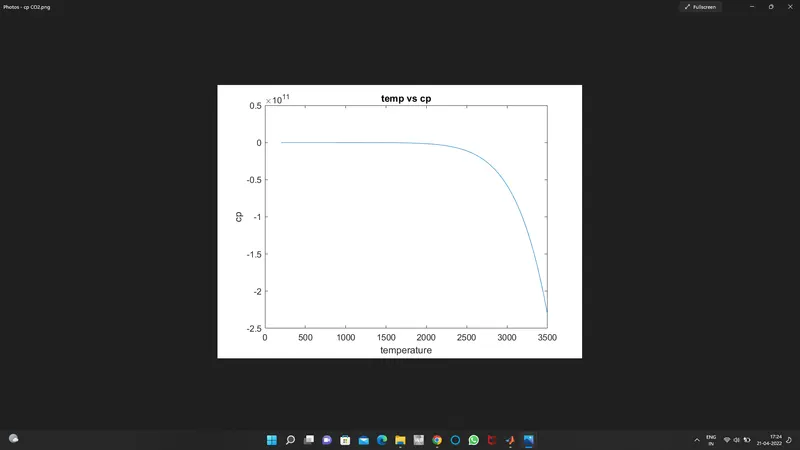
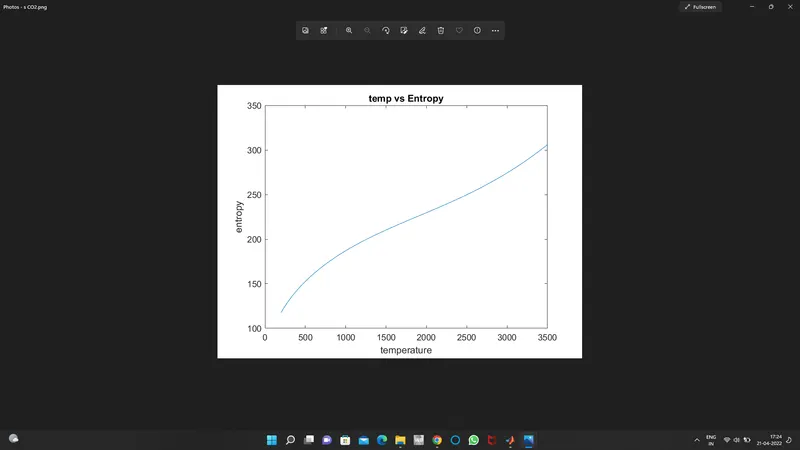
CO2 GRAPH
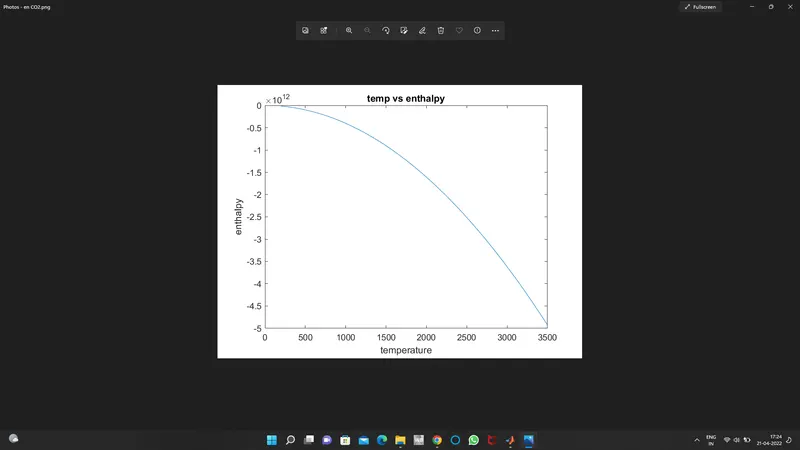
O2 GRAPH