Project 1 - Parsing NASA thermodynamic data
AIM:
to write a code in matlab to parse nasa thermodynamic data file and then calculate thermodynamic properties of various gas species
OBJECTIVE:
.write a function that extracts the 14 coefficients and calculates the enthalpy,entropy and specific heats for all the species in the data file.
. calculate molecular weight of each species
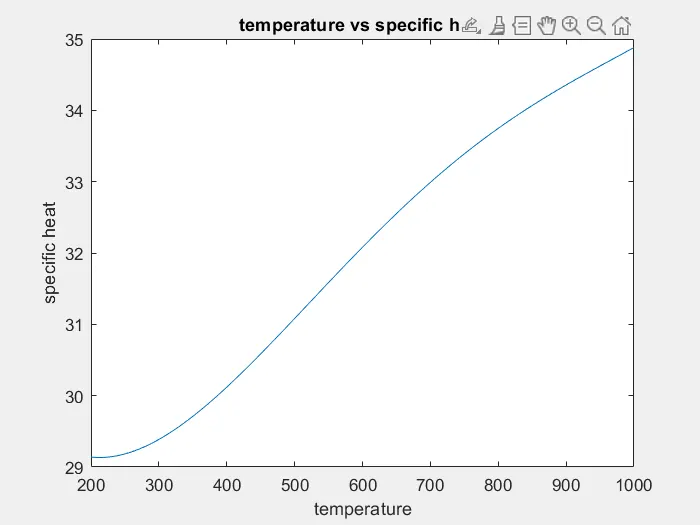
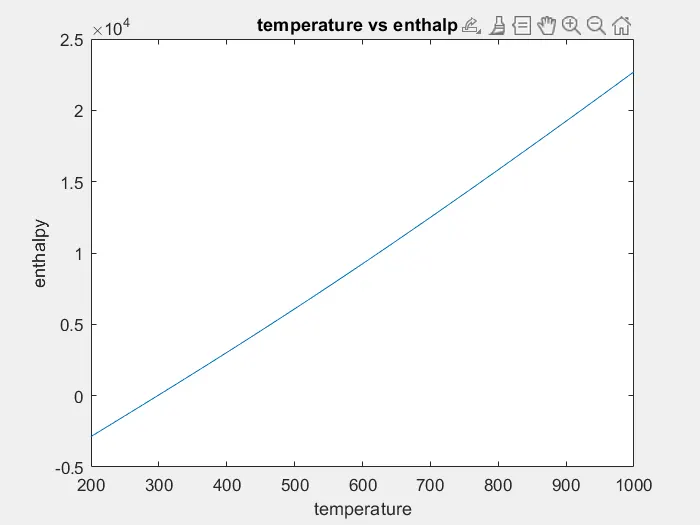
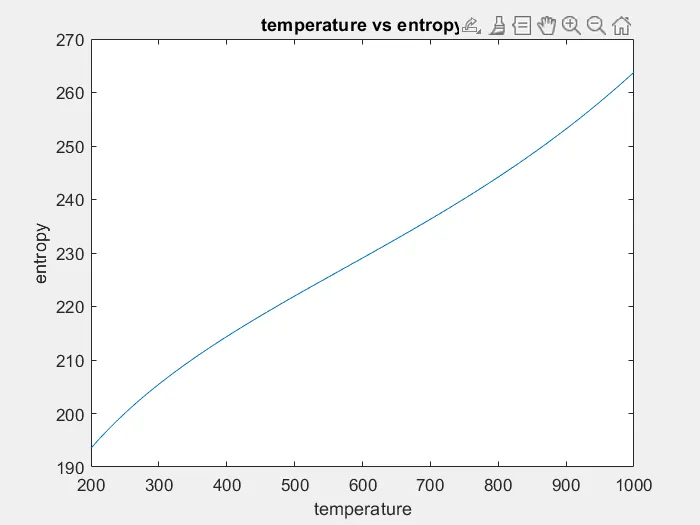
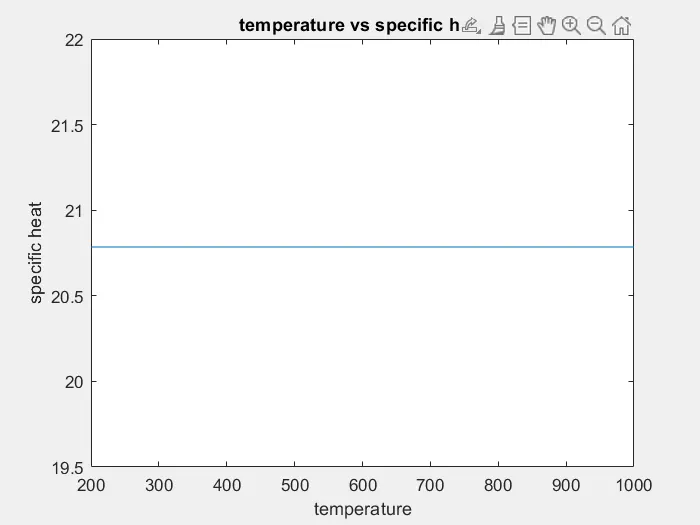
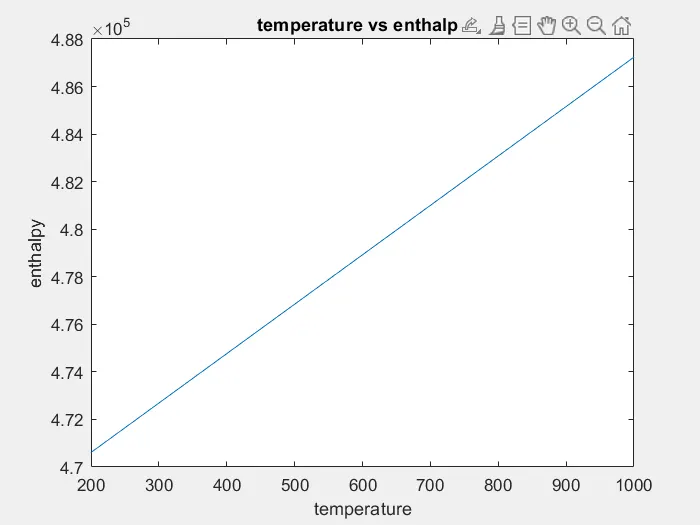
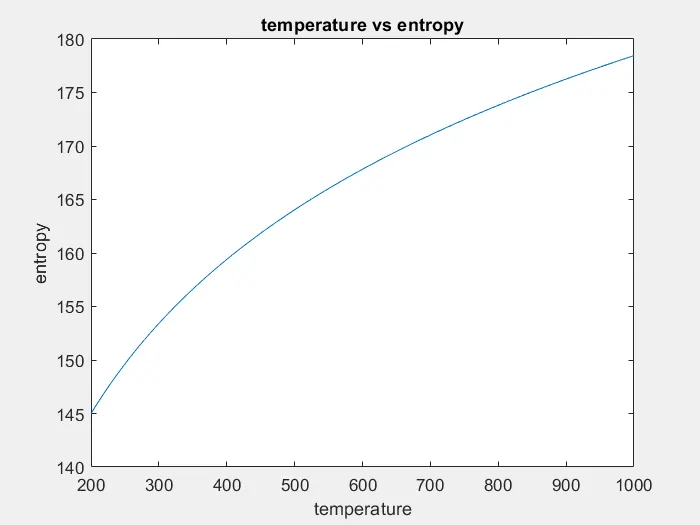
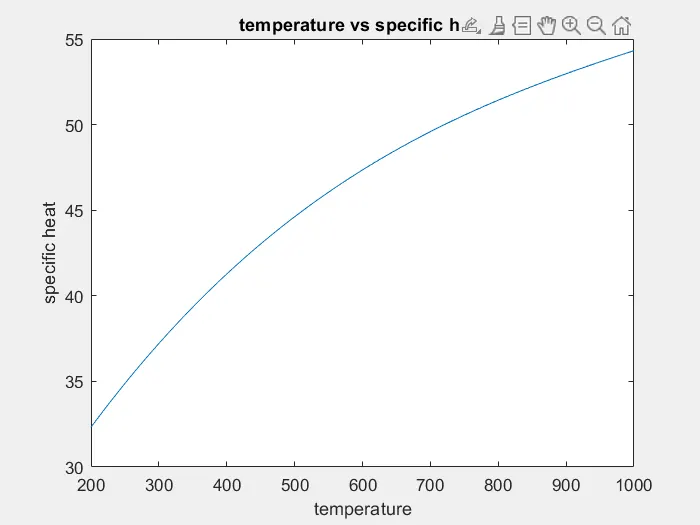
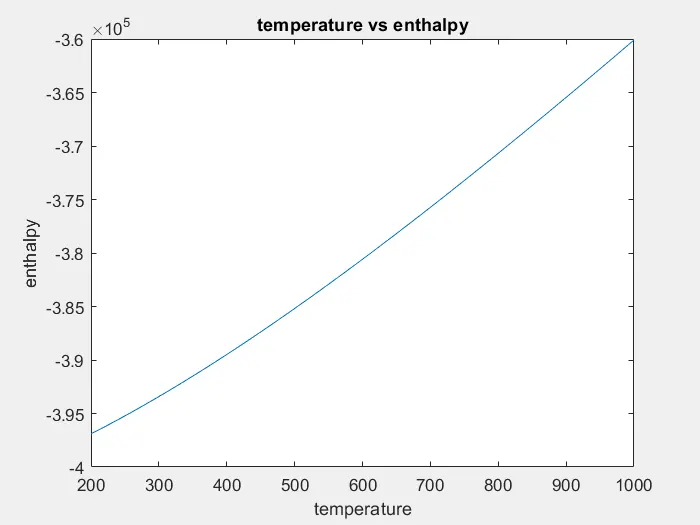
. plotting the specific heat ,enthalpy and entropy for the local temperature range.
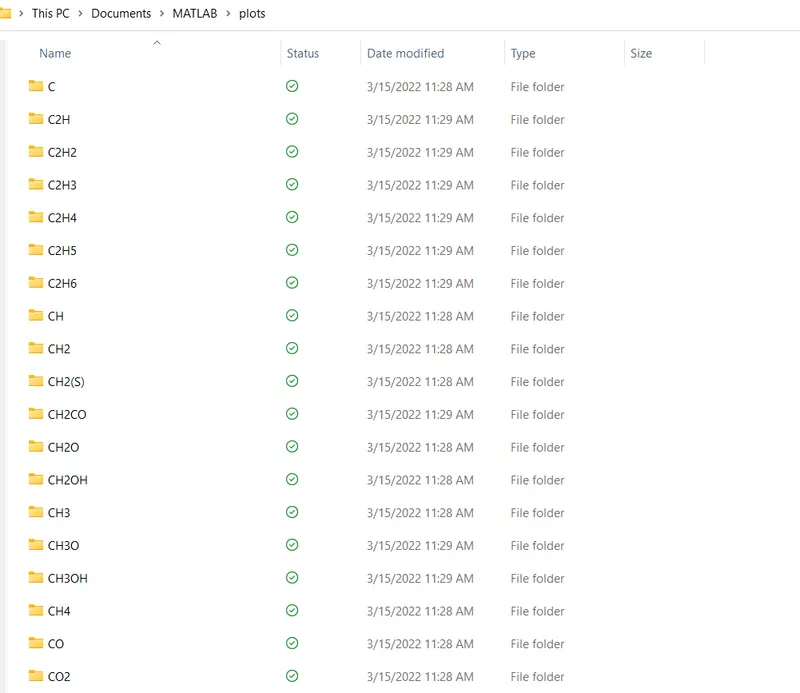
. saving the plots as images with appropriate names and dumping them in seperate folders for each species.
THEORY:
FILE PARSING:
file parsing is a string or symbol either in natural language computer or data structure conferming to the rules of the former grammer.
MATHEMATICAL EQUATION:
FOR SPECIFIC HEAT
cp/r = b1+b2.t+b3.t^2+b4.t^3+b5.t^4
FOR ENTHALPY
H/RT=b1+b2(t/2)+b3(t^3/3)+b4.(t^3/4)+b5.(t^4/5)+b6/t
FOR ENTROPY
S/R = b1.log(t)+b2.t+b3.t^2/2+b4.t^3/3+b5.t^4/4+b7
WHERE:
T = local temperature
b1-b7= high temperature coefficient
b8-b14=low temperature coefficient
R=gas constant =8.314
PROGRAM:
the program for file parsing
clear all
close all
clc

f1 = fopen('THERMO.dat','r');

%reading header information
fgetl(f1);

%global temperature
t_line = fgetl(f1);

a = strsplit(t_line,' ');

global_low_temp = str2double(a{2});
global_mid_temp = str2double(a{3});
global_high_temp = str2double(a{4});


%neglecting the 3 lines
fgetl(f1);
fgetl(f1);
fgetl(f1);

%reading species block
%line 1
for i = 1:53
    t_line2=fgetl(f1)
    s=strsplit(t_line2,' ');
    species_name=s{1};
    A=strfind(t_line2,'G');
    temp_values=t_line2(A+4:length(t_line2));
    B=strsplit(temp_values,' ');

    local_low_temp=str2double(B{1});
    local_mid_temp=str2double(B{2});
    local_high_temp=str2double(B{3});

    t_line=fgetl(f1);
    b=findstr(t_line,'E');
    %1st coefficient
    b1=t_line(1:b(1)+3);
    b1=str2num(b1);
    %2nd coefficient
    b2=t_line(b(1)+4:b(2)+3);
    b2=str2num(b2);
    %3rd coefficient
    b3=t_line(b(2)+4:b(3)+3);
    b3=str2num(b3);
    %4th coefficient
    b4=t_line(b(3)+4:b(4)+3);
    b4=str2num(b4);
    %5th coefficient
    b5=t_line(b(4)+4:b(5)+3);
    b2=str2num(b5);

    %line 2
    line2=fgetl(f1);
    %6th coefficient
    b6=line2(1:b(1)+3);
    b6=str2num(b6);
    %7th coefficient
    b7=line2(b(1)+4:b(2)+3);
    b7=str2num(b7);
    %8th coefficient
    b8=line2(b(2)+4:b(3)+3);
    b8=str2num(b8);
    %9th coefficient
    b9=line2(b(3)+4:b(4)+3);
    b9=str2num(b9);
    %10th coefficient
    b10=line2(b(4)+4:b(5)+3);
    b10=str2num(b10);

    %line 3
    line3=fgetl(f1);
    %11th coefficient
    b11=line3(1:b(1)+3);
    b11=str2num(b11);
    %12th coefficient
    b12=line3(b(1)+4:b(2)+3);
    b12=str2num(b12);
    %13th coefficient
    b13=line3(b(2)+4:b(3)+3);
    b13=str2num(b13);
    %14th coefficient
    b14=line3(b(3)+4:b(4)+3);
    b14=str2num(b14);

    %universal gas constant
    R=8.314;

    t=linspace(local_low_temp,local_high_temp,100);

    %to calculate
    %specific heat by creating function
    C_P=specific_heat(b1,b2,b3,b4,b5,b6,b7,b8,b9,b10,b11,b12,b13,b14,local_mid_temp,t,R)
    %enthalpy by creating function
    H=enthalpy(b1,b2,b3,b4,b5,b6,b7,b8,b9,b10,b11,b12,b13,b14,local_mid_temp,t,R)
    %entropy by creating function
    S=entropy(b1,b2,b3,b4,b5,b6,b7,b8,b9,b10,b11,b12,b13,b14,local_mid_temp,t,R)

    %creating a folder
    mkdir(['C:\Users\patlo\OneDrive\Documents\MATLAB\plots\',species_name])
    cd(['C:\Users\patlo\OneDrive\Documents\MATLAB\plots\',species_name])

    %plotting for

    %temperature vs specific heat

    figure(1)
    plot(t,C_P)
    xlabel('temperature')
    ylabel('specific heat')
    title('temperature vs specific heat')
    image=getframe(gcf);
    imwrite(image.cdata,'t vs cp.png')
    saveas(1,'specific heat','jpg')

   %temperature vs enthalpy
   figure(2)
   plot(t,H)
   xlabel('temperature')
   ylabel('enthalpy')
   title('temperature vs enthalpy')
   image=getframe(gcf);
   imwrite(image.cdata,'t vs H.png')
   saveas(2,'enthalpy','jpg')

   %temperature vs entropy
   figure(3)
   plot(t,S)
   xlabel('temperature')
   ylabel('entropy')
   title('temperature vs entropy')
   image=getframe(gcf);
   imwrite(image.cdata,'t vs S.png')
   saveas(3,'entropy','jpg')

   cd ..

    %calculating molecular mass
    [M]=molecular_weight(species_name);
    K=sprintf('%s mol_wt=%f',species_name,M);
    disp(K)
end
FUNCTION:
FOR SPECIFIC HEAT:
function [c_p]=specific_heat(b1,b2,b3,b4,b5,b6,b7,b8,b9,b10,b11,b12,b13,b14,local_mid_temp,t,R)
for i=1:length(t)
if(t(i)>local_mid_temp)
    c_p(i)=R*(b1+(b2.*t(i))+(b3.*(t(i).^2))+(b4.*(t(i).^3))+(b5.*(t(i).^4)));
else
    c_p(i)=R*(b8+(b9.*t(i))+(b10.*(t(i).^2))+(b11.*(t(i).^3))+(b12.*(t(i).^4)));
end
end
FOR ENTHALPY
function[H]=enthalpy(b1,b2,b3,b4,b5,b6,b7,b8,b9,b10,b11,b12,b13,b14,local_mid_temp,t,R)
for i=1:length(t)
    if(t(i)>local_mid_temp)
    H(i)=(b1+((b2.*t(i))/2)+((b3.*(t(i).^2))/3)+((b4.*(t(i).^3))/4)+((b5.*(t(i).^4))/5)+(b6./t(i))).*t(i)*R;
else
    H(i)=(b8+((b9.*t(i))/2)+((b10.*(t(i).^2))/3)+((b11.*(t(i).^3))/4)+((b12.*(t(i).^4))/5)+(b13./t(i))).*t(i)*R;
    end
end
FOR ENTROPY:
function [S]=entropy(b1,b2,b3,b4,b5,b6,b7,b8,b9,b10,b11,b12,b13,b14,local_mid_temp,t,R)
for i=1:length(t)
if(t>local_mid_temp)
    S(i)=((b1*log(t(i)))+(b2.*t(i))+((b3.*(t(i).^2))/2)+((b4.*(t(i).^3))/3)+(b5.*(t(i).^4))+b7);
else
    S(i)=((b8*log(t(i)))+(b9.*t(i))+((b10.*(t(i).^2))/2)+((b11.*(t(i).^3))/3)+(b12.*(t(i).^4))+b14)*R;
end
end
FOR MOLECULAR WEIGHT:
function[M]= molecular_weight(species_name)

atomic_mass=[15.999,1.008,12.011,14.007,39.948];
elements=['O','H','C','N','A'];

mol_wt=0;
for i=1:length(species_name)
    for j=1:length(elements)
    if strcmpi(species_name(i),elements(j))
        mol_wt=mol_wt+atomic_mass(j);
        z=j;
    end

    end
t=str2double(species_name(i));
if(t>1)
    mol_wt=mol_wt+(atomic_mass(z)*(t-1));
end
M=mol_wt
end
OUTPUT :
FOR O2
N:
CO2:
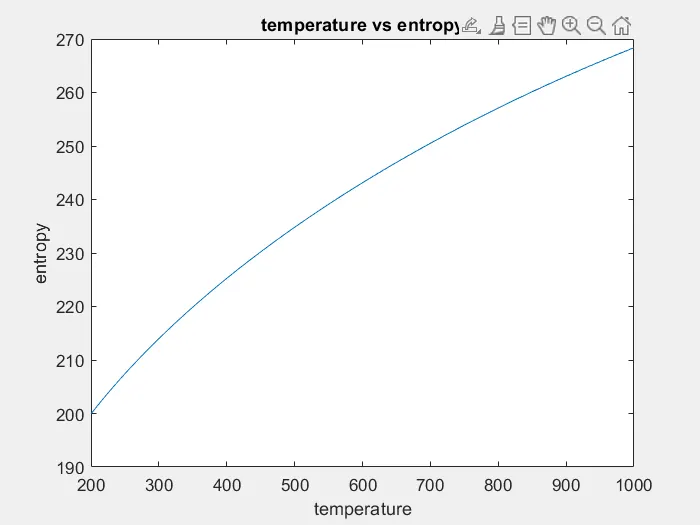
WORKSPACE:
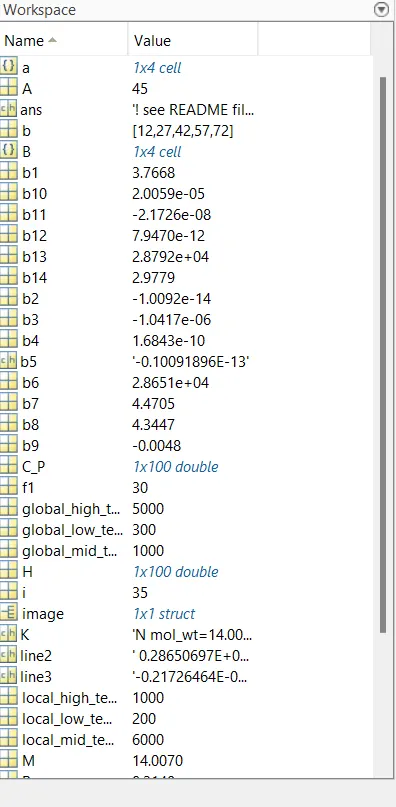
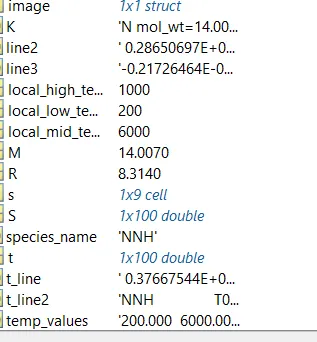
35 FILES:

MOLECULAR WEIGHT:

RESULT:
. the code file parsing is done
. the graph for O2,CO2 and N2 is plotted
. molecular weight for every element is found
.files are created