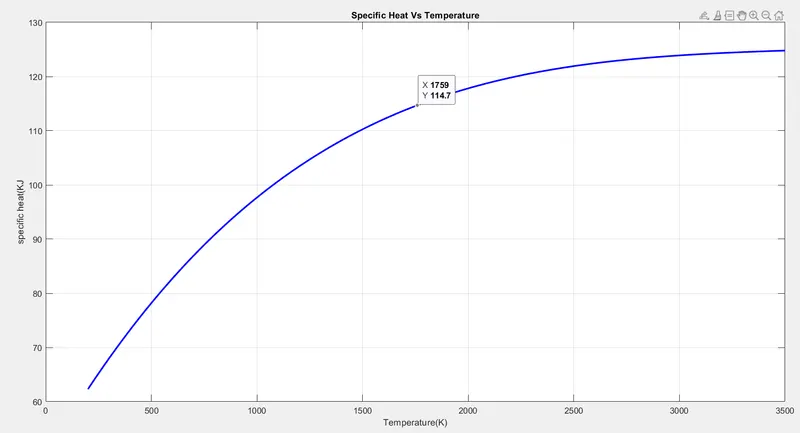
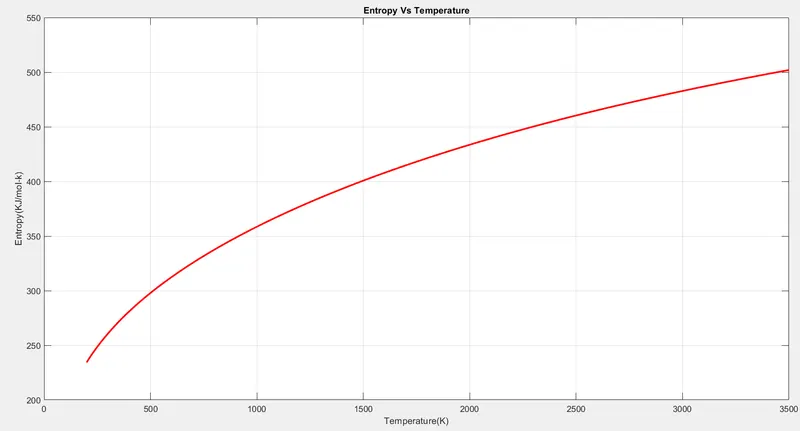
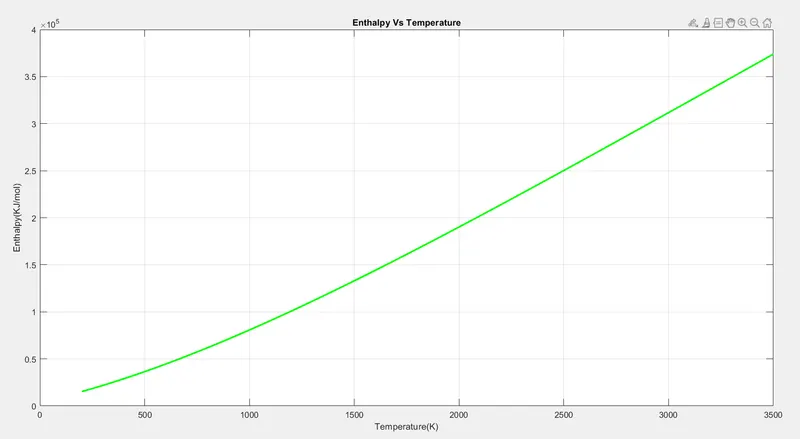
Project 1 - Parsing NASA thermodynamic data
OBJECTIVE :
- To write a function that extracts the 14 co-efficients and calculates the enthalpy, entropy and specific heats for all the species in the data file. You will be reading this file Nasa Thermodynamics file.
- To calculate the molecular weight of each species and display it in command window.
- Plot the Cp, Enthalpy and Entropy for the local temperature range specific for each species.
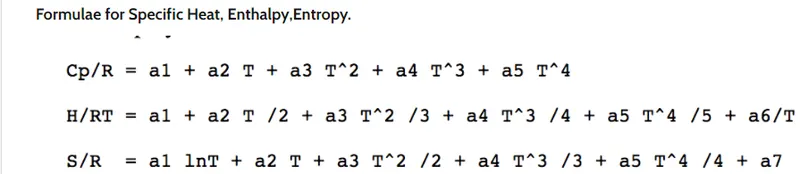
Where Cp = specific heat
S = Entropy
H = Enthalpy
R = Universal gas constant
T = Temperature
SPECIFIC HEAT :
specific heat, the quantity of heat required to raise the temperature of one gram of a substance by one Celsius degree. The units of specific heat are usually calories or joules per gram per Celsius degree.
Cp=[a1+a2.*(t)+a3.*(t.^2)+a4.*(t.^3)+a5.*(t.^4)]*R
ENTROPY :
Entropy is a scientific concept as well as a measurable physical property that is most commonly associated with a state of disorder, randomness, or uncertainty.
S=[a1.*log(t)+a2.*(t)+a3.*(t.^2)./2+a4.*(t.^3)./3+a5.*(t.^4)./4+a7]*R;
ENTHALPY :
Enthalpy, a property of a thermodynamic system, is the sum of the system's internal energy and the product of its pressure and volume.It is a state function used in many measurements in chemical, biological, and physical systems at a constant pressure, which is conveniently provided by the large ambient atmosphere.
H=[a1+a2.*(t./2)+a3.*(t.^2)./3+a4.*(t.^3)./4+a5.*(t.^4)./5+a6./t]*R.*t;
CODE :
clear all
close all
clc
% reading Data file: Thermo
%open a file and 'r' open the file for reading
f1=fopen('thermo.dat','r');
get =fgetl(f1);
%now reading temperature from this file
temp = fgetl(f1);
temp = str2num(temp);
%converting string cells into numbers
global_low_temp = temp(1);
global_mid_temp = temp(2);
global_high_temp= temp(3);
% For skipping comment line
for i=1:3
get= fgetl(f1);
end
A =fgetl(f1);
a=strfind(A,'G');
t =strsplit(A(a+1:end-1),' ');
local_low_temp=str2num(t{2});
local_mid_temp=str2num(t{4});
local_high_temp=str2num(t{3});
temp_range=linspace(local_low_temp,local_high_temp,200);
mkdir nasa_parsing
for i=1:53
species = strtok(A);
cd nasa_parsing;
mkdir(species);
cd(species);
A2=fgetl(f1);
A3=fgetl(f1);
A4=fgetl(f1);
x=strfind(A2,'E');
y=strfind(A3,'E');
z=strfind(A4,'E');
a8=str2num(A2(1:x(1)+3));
a9=str2num(A2(x(1)+4:x(2)+3));
a10=str2num(A2(x(2)+4:x(3)+3));
a11=str2num(A2(x(3)+4:x(4)+3));
a12=str2num(A2(x(4)+4:x(5)+3));
a13=str2num(A3(1:y(1)+3));
a14=str2num(A3(y(1)+4:y(2)+3));
a1=str2num(A3(y(2)+4:y(3)+3));
a2=str2num(A3(y(3)+4:y(4)+3));
a3=str2num(A3(y(4)+4:y(5)+3));
a4=str2num(A4(1:z(1)+3));
a5=str2num(A4(z(1)+4:z(2)+3));
a6=str2num(A4(z(2)+4:z(3)+3));
a7=str2num(A4(z(3)+4:z(4)+3));
[Cp,H,S] = thermo_properties(a1,a2,a3,a4,a5,a6,a7,a8,a9,a10,a11,a12,a13,a14,temp_range);
weight=molecular_weight(species);
display(weight,species);
%plot1 : Cp Vs T
figure(1)
plot(temp_range,Cp,'linewidth',2,'color','b');
xlabel('Temperature(K)');
ylabel('specific heat(KJ');
title('Specific Heat Vs Temperature');
grid on
save('Specific Heat Vs Temperature.jpg')
%plot2 : S Vs T
figure(2)
plot(temp_range,S,'linewidth',2,'color','r');
xlabel('Temperature(K)');
ylabel('Entropy(KJ/mol-k)');
title('Entropy Vs Temperature');
grid on
save('Entropy Vs Temperature.jpg')
%plot3 : H Vs T
figure(2)
plot(temp_range,H,'linewidth',2,'color','g');
xlabel('Temperature(K)');
ylabel('Enthalpy(KJ/mol)');
title('Enthalpy Vs Temperature');
grid on
save('Enthalpy Vs Temperature.jpg')
cd('E:\MATLAB\CHALLENGES\matlab_challenges') %changing directory to original matlab path
A=fgetl(f1);
end
STEPS:
- First THERMO.dat file is loaded. Then the first line is skipped with the help of 'fgetl' command.
- Then the global temperatures are extracted.
- Then the next three lines are skipped.
- Then with the position of 'G' we have extracted local temperatures.
- We have made a temperature array of 200 nos of local temperatures.
- Then extracting data of 53 species we have used 'for' loop and extracted the low and high temperature coefficients.
- We have created seperated folders to save plots of different species .
- And finally displayed molecular weight of all the species in command window.
FUNCTION FOR CALCULATING SPECIFIC HEAT, ENTROPY, ENTHALPY
%funcion program for calculating Enthalpy,Entropy and Specific Heat
function[Cp,H,S]=thermo_properties(a1,a2,a3,a4,a5,a6,a7,a8,a9,a10,a11,a12,a13,a14,temp_range)
R=8.3145;
t=temp_range;
if temp_range<200
Cp=[a1+a2.*(t)+a3.*(t.^2)+a4.*(t.^3)+a5.*(t.^4)]*R;
H=[a1+a2.*(t./2)+a3.*(t.^2)./3+a4.*(t.^3)./4+a5.*(t.^4)./5+a6./t]*R.*t;
S=[a1.*log(t)+a2.*(t)+a3.*(t.^2)./2+a4.*(t.^3)./3+a5.*(t.^4)./4+a7]*R;
else
Cp=[a8+a9.*(t)+a10.*(t.^2)+a11.*(t.^3)+a12.*(t.^4)]*R;
H=[a8+a9.*(t./2)+a10.*(t.^2)./3+a11.*(t.^3)./4+a12.*(t.^4)./5+a13./t]*R.*t;
S=[a8.*log(t)+a9.*(t)+a10.*(t.^2)./2+a11.*(t.^3)./3+a12.*(t.^4)./4+a14]*R;
end
FUNCTION FOR CALCULATING MOLECULAR WEIGHT
% Function for calculating molecular weight
function[wt] = molecular_weight(A)
atom=['C','H','O','N'];
mass=[12 1 16 14];
wt=0;
for i=1:length(A)
for j=1:length(atom)
if A(i)==atom(j)
wt = wt+mass(j)
z=j;
end
end
b=str2num(A(i));
if isempty(b)==1
else
wt=wt+(b-1)*mass(z);
end
end