Project 1 - Parsing NASA thermodynamic data
clear all
close all
clc
f2 = fopen('THERMO (1).dat','r');
fgetl(f2);
A = fgetl(f2);
A = strsplit(A,' ');
G_low_temp = str2num(A{2});
G_mid_temp = str2num(A{3});
G_high_temp = str2num(A{4});
%skipping 1st 3 lines
for i =1:3
    fgetl(f2);
end
%reading the  species
for i = 1:2
    header = fgetl(f2);
    x = strsplit(header,' ')
    species_name= (x{1});


t1 = str2double(x{end-3});
t2 = str2double(x{end-2});
t3 = str2double (x{end-1});


% getting the coefficients
H = fscanf(f2,'%f');
a1 = H(1);
a2 = H(2);
a3 = H(3);
a4 = H(4);
a5 = H(5);
a6 = H(7);
a7 = H(8);
a8 = H(9);
a9 = H(10);
a10 = H(11);
a11 = H(13);
a12 = H(14);
a13 = H(15);
a14= H(16);

T = linspace (t1,t2,100);

R =8.314; % Universal gas constant
mkdir(['C:\Users\VCIN\Documents\MATLAB\File Parsing Project 1\images\Species_final\',species_name]);
% Calculating Cp,H,S

if T >=t3
       cp = (a1 + (a2.*T) +(a3.*(T.^2))+(a4.*(T.^3))+(a5.*(T.^4)))*R;
   H =  (a1 + (a2.*T)/2 + (a3.*T.^2)/3 + (a4.*T.^3)/4 + (a5.*T.^4)/5 + (a6./T)).*T*R;
   S = (a1.*log(T) + a2.*T + (a3.*T.^2)/2 + (a4.*T.^3)/3 + (a5.*T.^4)/4 + a7)*R;

else
    cp = R*(a8 + (a9.*T) +(a10.*(T.^2))+(a11.*(T.^3))+(a12.*(T.^4)));
    H =  (a8 + (a9.*T)/2 + (a10.*T.^2)/3 + (a11.*T.^3)/4 + (a12.*T.^4)/5 + (a13./T)).*T*R;
   S = (a8.*log(T) + a9.*T + (a10.*T.^2)/2 + (a11.*T.^3)/3 + (a12.*T.^4)/4 + a14)*R;


end
% Plotting
figure(1);
plot(T,cp);
title(species_name);
xlabel('Temperature')
ylabel('specific heat')
hold on
figure(2);
plot (T,H);
title(species_name);
xlabel('Temperature');
ylabel('ENthalpy');
figure(3);
plot(T,S);
xlabel('Temperature');
ylabel('Entropy');
title(species_name);

atomic_mass = [16 1 12 14 40];
elements = ['O' 'H' 'C' 'N' 'A'];
mol_wt = 0
for i = 1:length(species_name);
    for j = 1:length(elements);
        if strcmp(species_name(i),elements(j));
            mol_wt = mol_wt + atomic_mass(j);
            z=j;
        end
    end
    t = str2double(species_name(i));
    if (t>1);
        mol_wt = mol_wt +(atomic_mass(z)*(t-1));
    end
end
M = mol_wt;
k = sprintf('%s mol_wt=%f',species_name,M);
disp(k)

%  CREATING FOLDER

saving = (['C:\Users\VCIN\Documents\MATLAB\File Parsing Project 1\images\Species_final\',species_name]);
cd(saving);
saveas(1,'Specific heat','jpg');
saveas(2,'Enthalpy','jpg');
saveas(3,'Entropy','jpg');
end

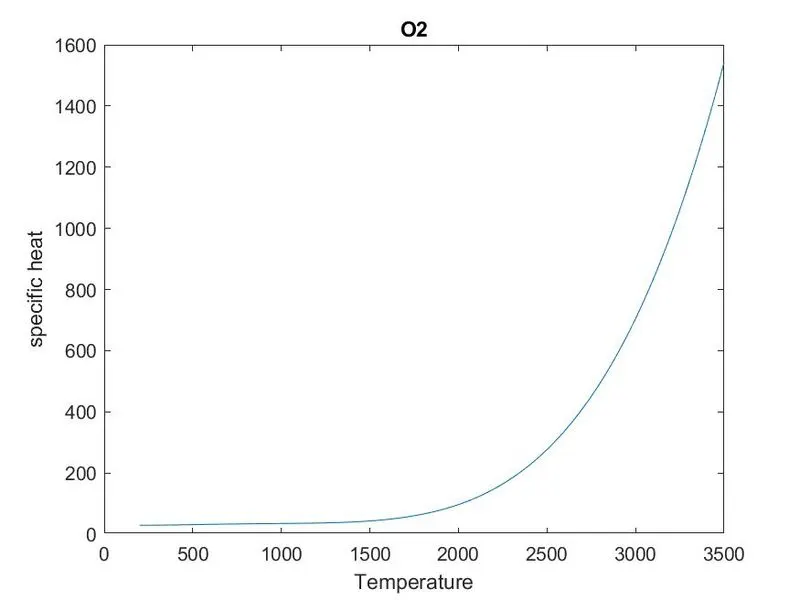
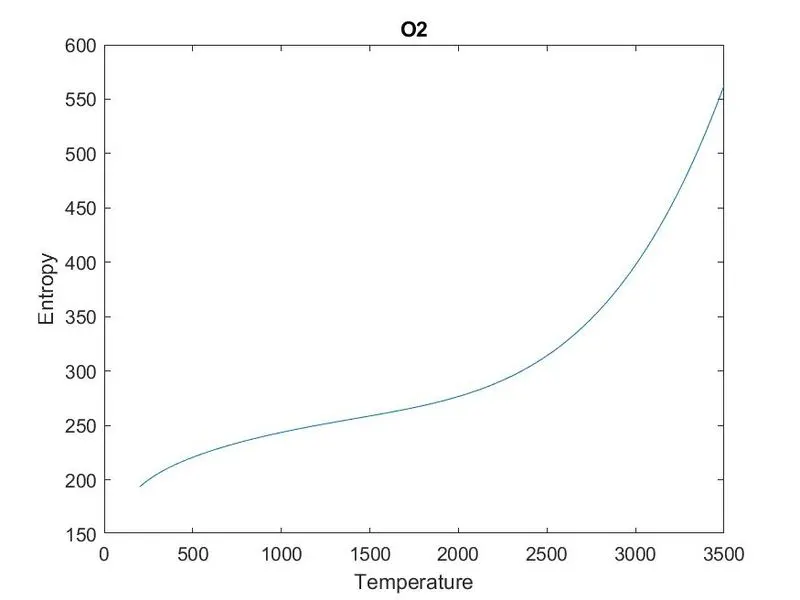
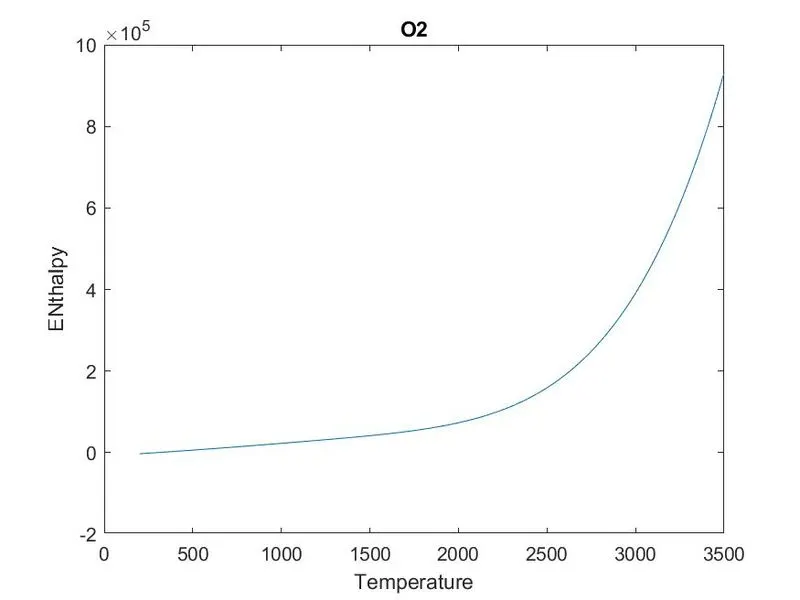
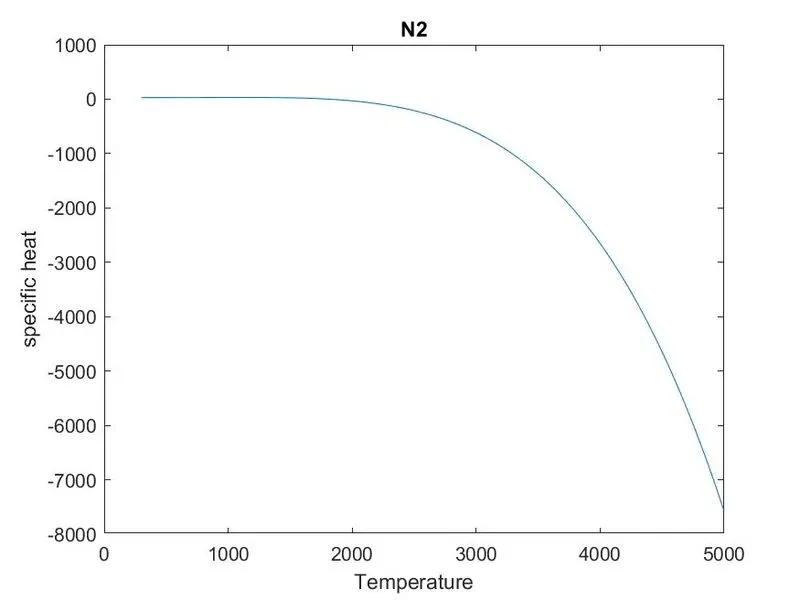
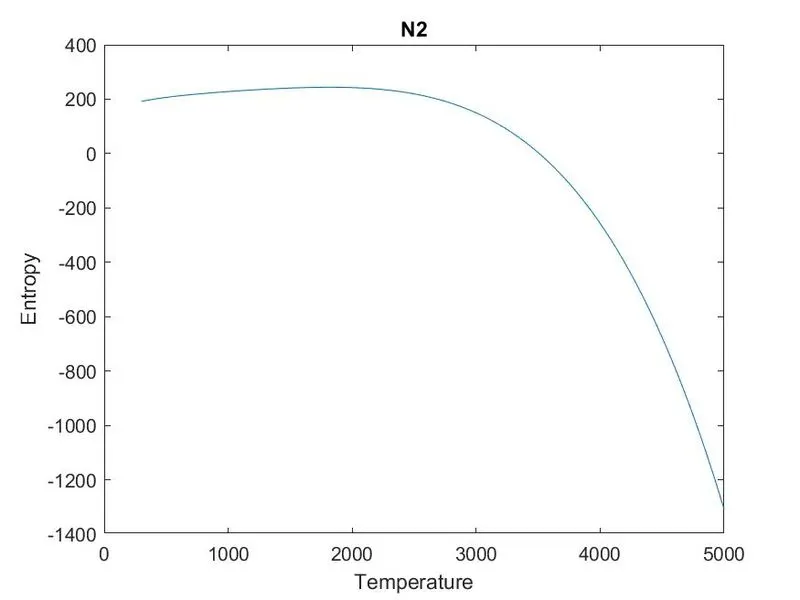
Explanation :
1) clear all
close all
clc
f2 = fopen('THERMO (1).dat','r');
fgetl(f2);
A = fgetl(f2);
A = strsplit(A,' ');
G_low_temp = str2num(A{2});
G_mid_temp = str2num(A{3});
G_high_temp = str2num(A{4});
At first regular procedure then using command fopen for opening the file thermo which is provided by the skill lync .
Mainly I have used fgetl command to skip more lines at first then further strsplit command is used to split the command into variables and string to number conversion done.
2)
for i = 1:53
header = fgetl(f2);
x = strsplit(header,' ')
species_name= (x{1});
t1 = str2double(x{end-3});
t2 = str2double(x{end-2});
t3 = str2double (x{end-1});
In this step by using 'for' loop we can get all 53 species in single run.
3) H = fscanf(f2,'%f');
a1 = H(1);
a2 = H(2);
a3 = H(3);
a4 = H(4);
a5 = H(5);
a6 = H(7);
a7 = H(8);
a8 = H(9);
a9 = H(10);
a10 = H(11);
a11 = H(13);
a12 = H(14);
a13 = H(15);
a14= H(16);
In this step by using simple fscan command we can get the data for all the coefficient .
4)
R =8.314; % Universal gas constant
mkdir(['C:\Users\VCIN\Documents\MATLAB\File Parsing Project 1\images\Species_final\',species_name]);
% Calculating Cp,H,S
if T >=t3
cp = (a1 + (a2.*T) +(a3.*(T.^2))+(a4.*(T.^3))+(a5.*(T.^4)))*R;
H = (a1 + (a2.*T)/2 + (a3.*T.^2)/3 + (a4.*T.^3)/4 + (a5.*T.^4)/5 + (a6./T)).*T*R;
S = (a1.*log(T) + a2.*T + (a3.*T.^2)/2 + (a4.*T.^3)/3 + (a5.*T.^4)/4 + a7)*R;
else
cp = R*(a8 + (a9.*T) +(a10.*(T.^2))+(a11.*(T.^3))+(a12.*(T.^4)));
H = (a8 + (a9.*T)/2 + (a10.*T.^2)/3 + (a11.*T.^3)/4 + (a12.*T.^4)/5 + (a13./T)).*T*R;
S = (a8.*log(T) + a9.*T + (a10.*T.^2)/2 + (a11.*T.^3)/3 + (a12.*T.^4)/4 + a14)*R;
Using R valve for universal gas constant ,here we have used mkdir command for saving the files automatically with whole path.
Then we have used formulas as mentioned in question with accurate answers.
5)
% Plotting
figure(1);
plot(T,cp);
title(species_name);
xlabel('Temperature')
ylabel('specific heat')
hold on
figure(2);
plot (T,H);
title(species_name);
xlabel('Temperature');
ylabel('ENthalpy');
figure(3);
plot(T,S);
xlabel('Temperature');
ylabel('Entropy');
title(species_name)
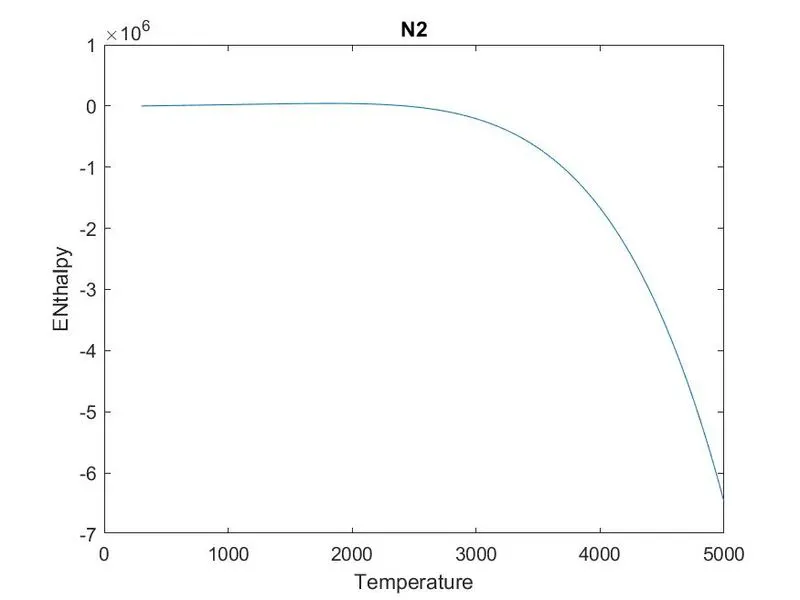
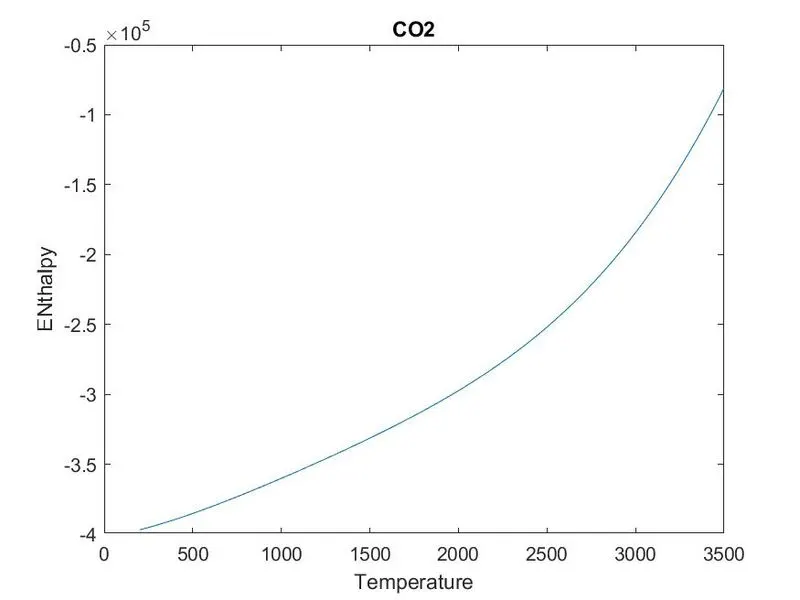
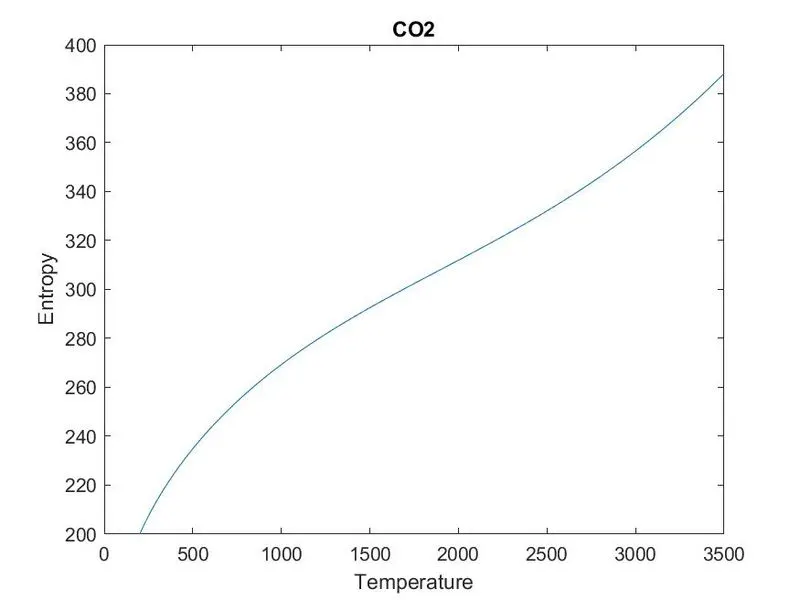
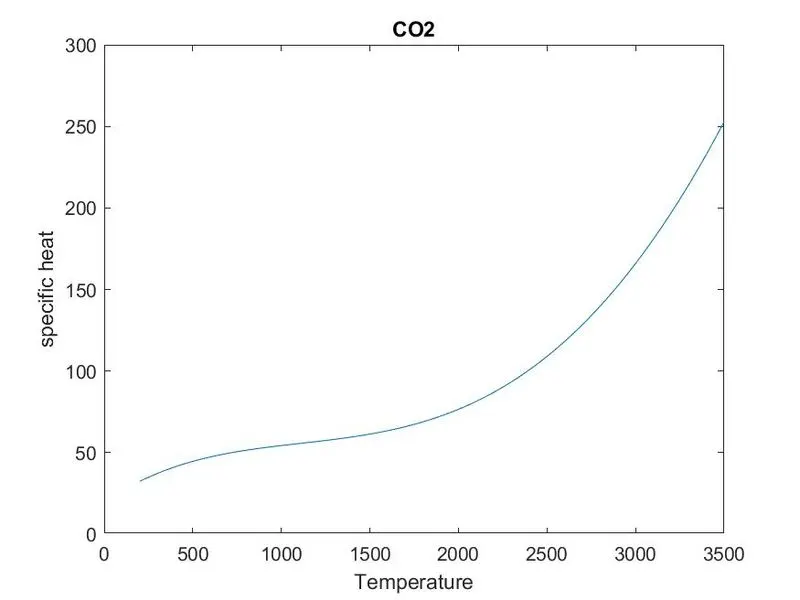
In plotting it ws the simplest step of the program ,as it get clear in advance while reading the code .It requires less explanation as compared to others .
In plotting I have chosen y axis as temperature in all cases .
6)
atomic_mass = [16 1 12 14 40];
elements = ['O' 'H' 'C' 'N' 'A'];
mol_wt = 0
for i = 1:length(species_name);
for j = 1:length(elements);
if strcmp(species_name(i),elements(j));
mol_wt = mol_wt + atomic_mass(j);
z=j;
end
end
t = str2double(species_name(i));
if (t>1);
mol_wt = mol_wt +(atomic_mass(z)*(t-1));
end
end
M = mol_wt;
k = sprintf('%s mol_wt=%f',species_name,M);
disp(k)
In this step i have used approx atomic mass for each element from google.
strcmp command is used for comparing the variables ,comparing the elements and species name simultaneously .This code is hard to digest but i have used the basic method to get answer.
ERRORS : Occured during programming
figure(1);
plot(T,cp);
title(species_name);
xlabel('Temperature')
ylabel('specific heat')
hold on
figure(2);
plot (T,H);
title(species_name);
xlabel('Temperature');
ylabel('ENthalpy');
figure(3);
plot(T,S);
xlabel('Temperature');
ylabel('Entropy');
title(species_name);
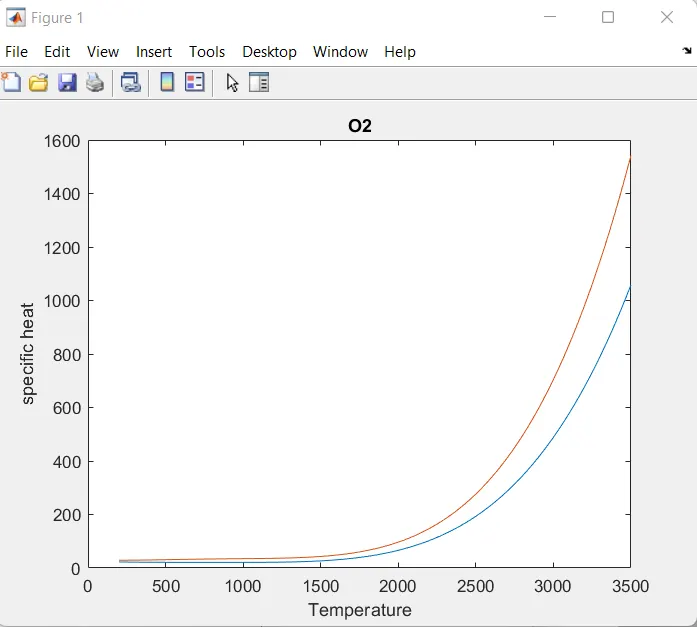
Error Correction :
By removing the hold on command ,it took a lot of time to recogansie while problem.