Project-1: Modelling an electric Car with Li-ion battery
Electric Vehicle:-
a)Electric Vehicle is a vehicle that uses electric motors to produce power and a battery to store energy.
b) It uses an electric motor for propulsion and moving the vehicle instead of an internal combustion engine.
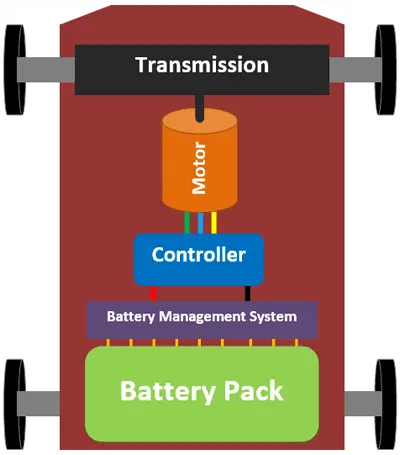
System level Block diagram of EV:-
The electric vehicle consists of-
a) Charging port- EV is charged through the charging port.
b) Onboard charger- It acts as AC to DC rectifier.
c) Battery- It stores the DC energy converted by an onboard charger.
d) Power Controller- It controls the power required by the motor through the battery as a mediator and provides the power to the motor when needed. An inverter changes the DC power stored in the battery to AC.
e) Motor - It produces the torque and supply power to rotate the wheel.
f) Drivetrain - It contains a differential gearbox and fixed gear as the motor is capable of generating large variations of torque needed by the vehicle to run.
g) Auxillary battery- To run the auxiliary components like headlight, wiper, etc.
h) Thermal management system- To maintain the engine and cabin temperature.
The losses to be considered while designing an electric powertrain are-
Motor loss, Accessory loss, Charging loss, Inverter Loss, Mechanical losses.
- More Key components of electric Vehicle:
- Transmission system: Mechanical power is delivered from the motor shaft to the wheels.
- Traction motor: Propulsion power unit which generates motion from electric power.
- Inverter and controller: Changing both the type and extent of electrical power from the battery to the motor.
- Traction battery pack: Energy storage unit which makes energy expenditure while driving the vehicle and acquire energy while charging.
- Design of an Electric Rickshaw:
Blocks used to design the model:
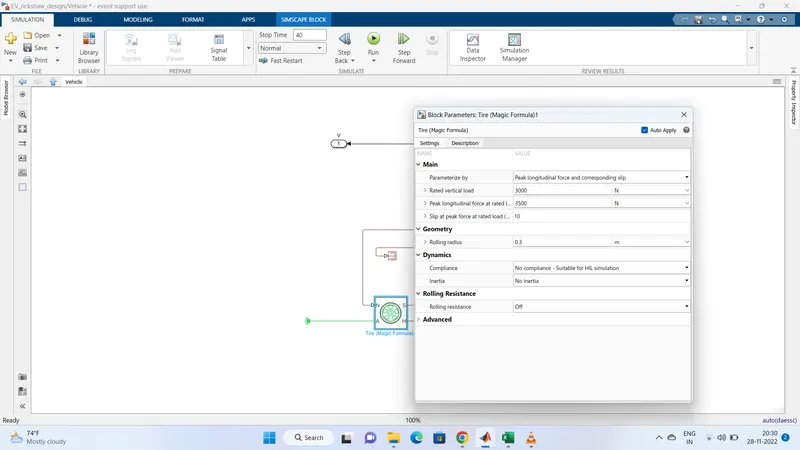
1) Tire:
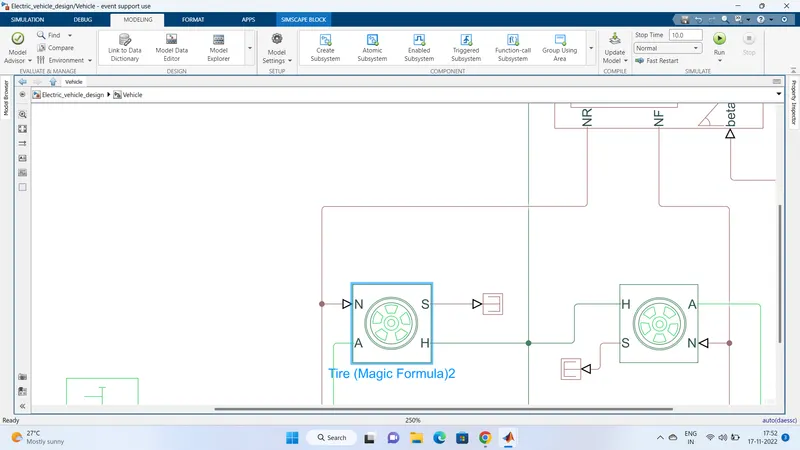
Represents the longitudinal behavior of a highway tire characterized by the tire Magic Formula. The block is built from Tire-Road Interaction (Magic Formula) and Simscape Foundation Library Wheel and Axle blocks. Optionally, the effects of tire inertia, stiffness, and damping can be included.
A -
Connection A is the mechanical rotational conserving port for the wheel axle.
H-
Connection H is the mechanical translational conserving port for the wheel hub through which the thrust developed by the tire is applied to the vehicle.
N-
Connection N is a physical signal input port that applies the normal force acting on the tire.
The force is considered positive if it acts downwards.
S-
Connection S is a physical signal output port that reports the tire slip.
2) Vehicle Body:
Represents a two-axle vehicle body in longitudinal motion. The block accounts for body mass, aerodynamic drag, road incline, and weight distribution between axles due to acceleration and road profile. The vehicle can have the same or a different number of wheels on each axle. Optionally include pitch and suspension dynamics or additional variable mass and inertia. The vehicle does not move vertically relative to the ground.
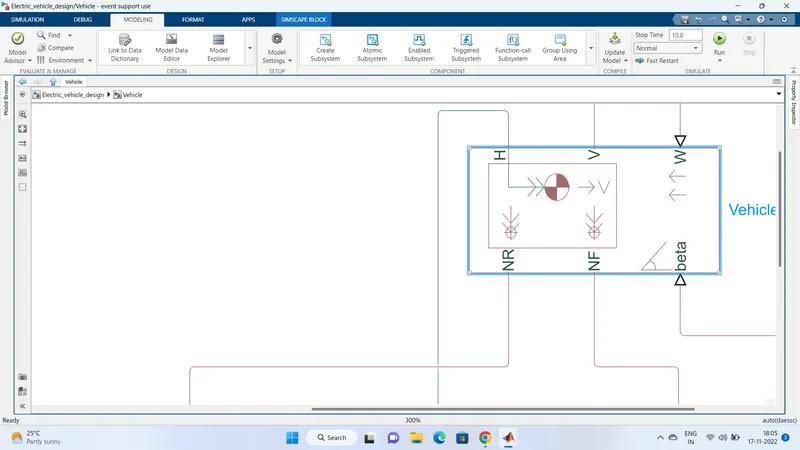
H-
Connection H is the mechanical translational conserving port associated with the horizontal motion of the vehicle body.
V-
vehicle velocity
Nf-
Front Wheel normal force
Nr-
Rear wheel normal force.
3) Simple Gear:
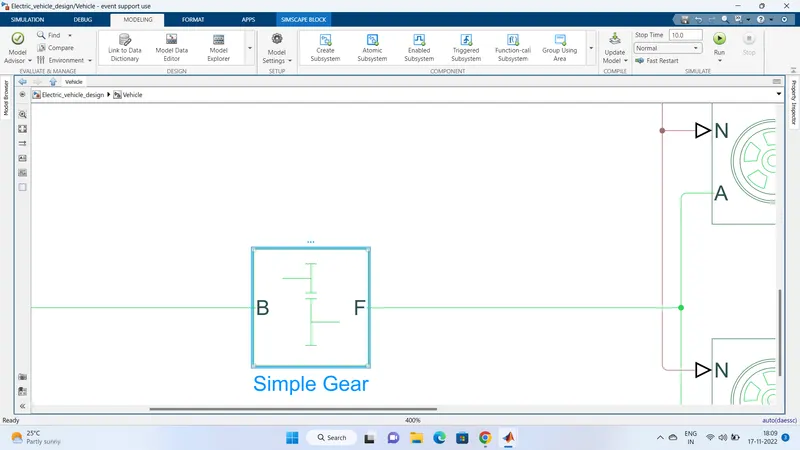
Represents a fixed-ratio gear or gearbox. No inertia or compliance is modeled in this block. You can optionally include gear meshing, backlash, and viscous bearing losses.
Connections B (base) and F (follower) are mechanical rotational conserving ports.
4) Constant and PS constant:
This block creates a physical signal constant:
y = constant
The Constant parameter accepts both positive and negative values. The block output is a physical signal port.
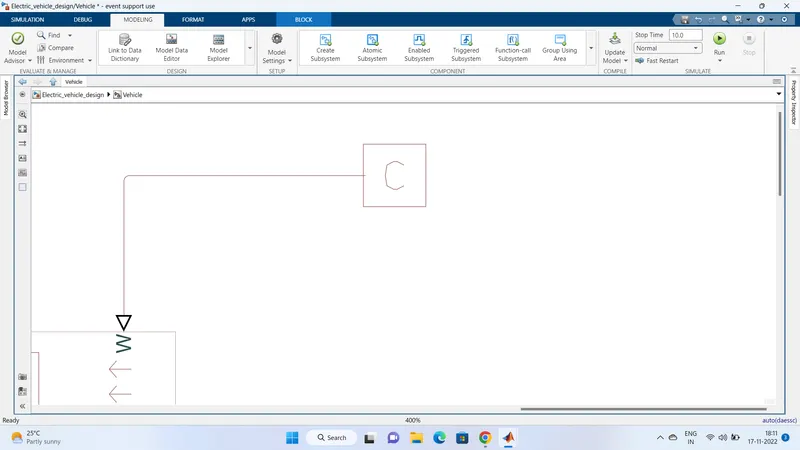
5) Connection port:
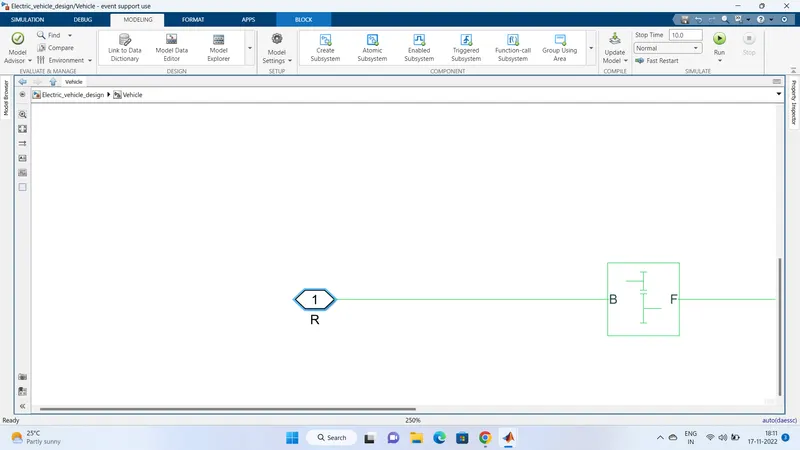
6) Drive Cycle Source:
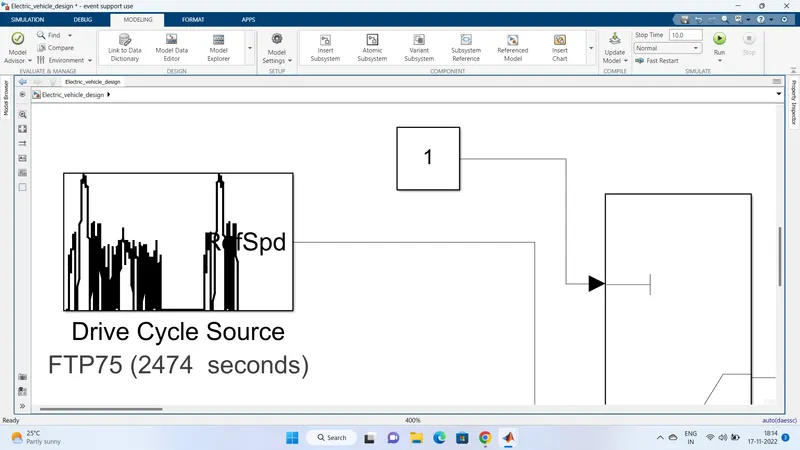
Generates a standard or user-specified longitudinal drive cycle. The block output is the vehicle longitudinal speed. You can import drive cycles from:
- Predefined sources
- Workspace variables, including arrays and time series objects
- mat, xls, xlsx, or txt files
Use the fault tracking parameters to identify drive cycle faults within specified speed and time tolerances.
7) Multiport Switch:
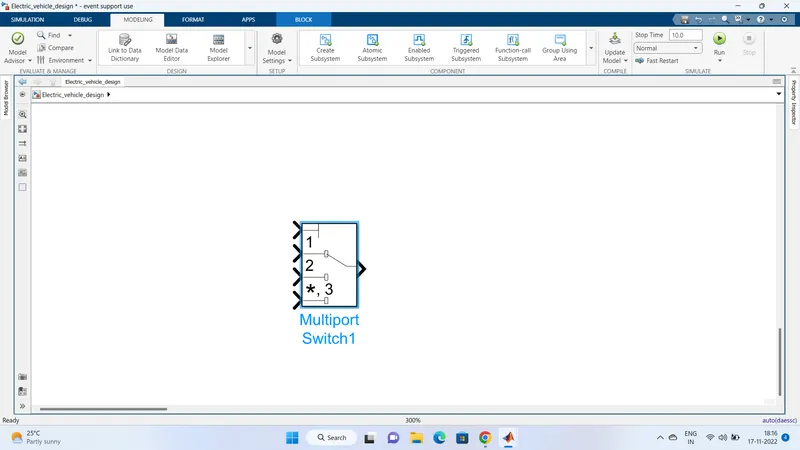
Pass through the input signals corresponding to the truncated value of the first input. The inputs are numbered top to bottom (or left to right). The first input port is the control port. The other input ports are data ports.
9) Controlled Voltage source:
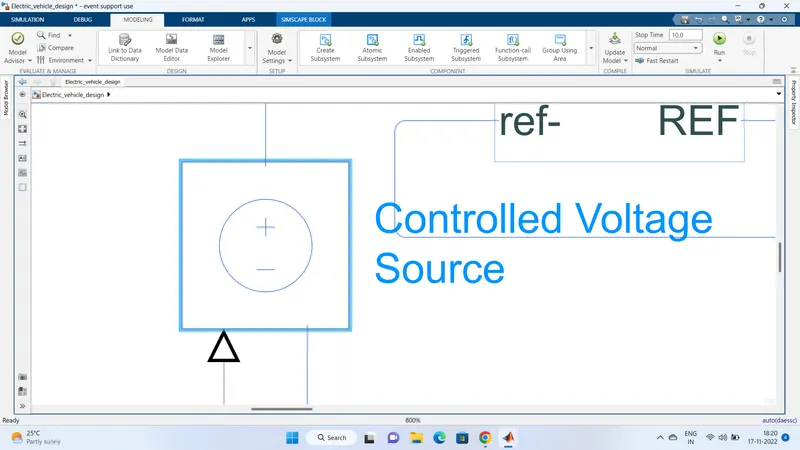
The block represents an ideal voltage source that is powerful enough to maintain the specified voltage at its output regardless of the current passing through it. The output voltage is V = Vs, where Vs is the numerical value presented at the physical signal port.
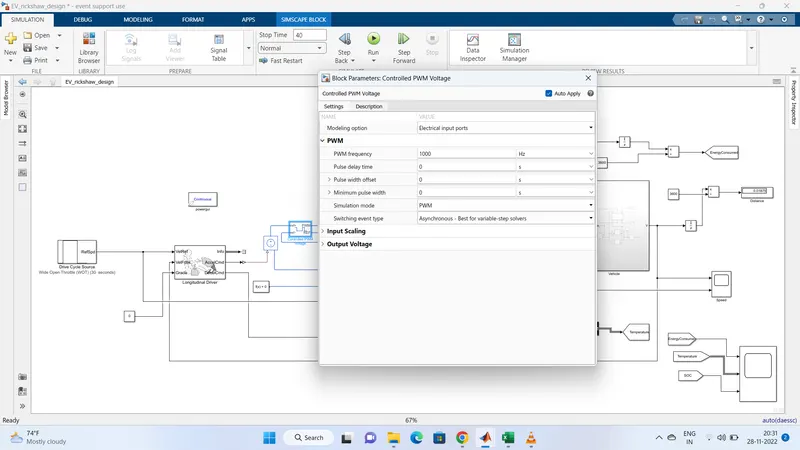
10) Controlled PWM Voltage:
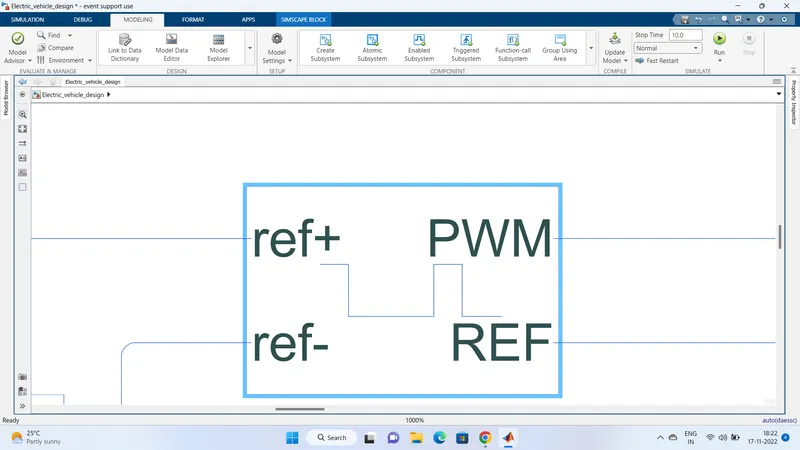
This block creates a Pulse-Width Modulated (PWM) voltage across the PWM and REF ports. The output voltage is zero when the pulse is low and is equal to the Output voltage amplitude parameter when high. The duty cycle is set by the input value. At time zero, the pulse is initialized as high unless the duty cycle is set to zero or the Pulse delay time is greater than zero.The Simulation mode can be set to PWM or Averaged. In PWM mode, the output is a PWM signal. In Averaged mode, the output is constant with a value equal to the averaged PWM signal.
11) H-Bridge:
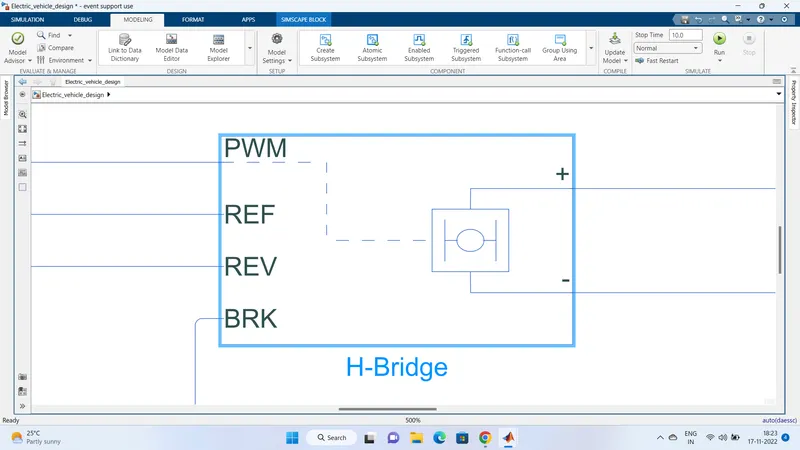
This block represents an H-bridge motor drive. The block can be driven by the Controlled PWM Voltage block in PWM or Averaged mode. In PWM mode, the motor is powered if the PWM port voltage is above the Enable threshold voltage. In Averaged mode, the PWM port voltage divided by the PWM signal amplitude parameter defines the ratio of the on-time to the PWM period. Using this ratio and assumptions about the load, the block applies an average voltage to the load that achieves the correct average load current. The Simulation mode parameter value must be the same for the Controlled PWM Voltage and H-Bridge blocks.
12) Current Sensor:
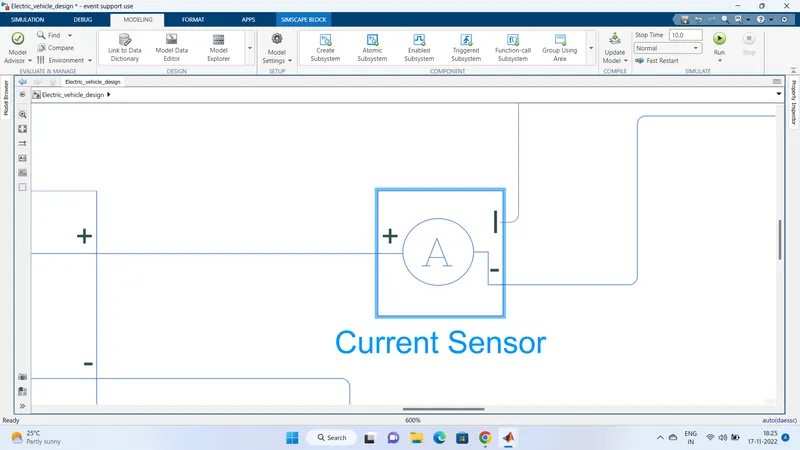
The block represents an ideal current sensor, that is, a device that converts current measured in any electrical branch into a physical signal proportional to the current. Connections + and - are conserving electrical ports through which the sensor is inserted into the circuit. Connection I is a physical signal port that outputs the current value.
13) Controlled Current Source:
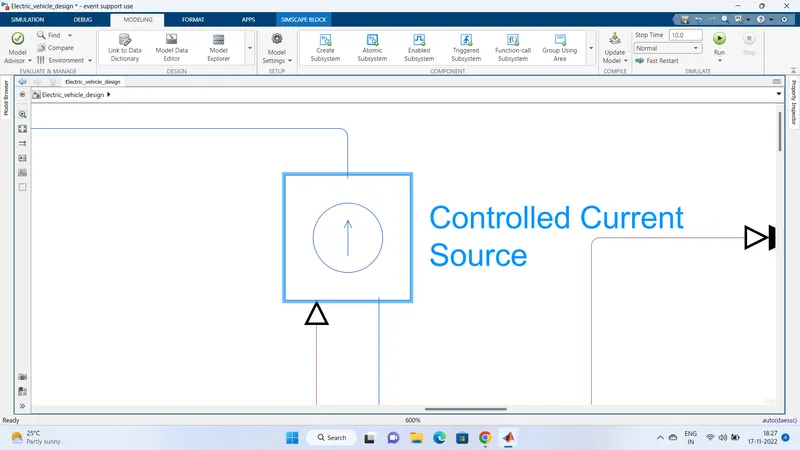
The block represents an ideal current source that is powerful enough to maintain the specified current through it regardless of the voltage across it. The output current is I = Is, where Is is the numerical value presented at the physical signal port.
14) Solver Configuration:
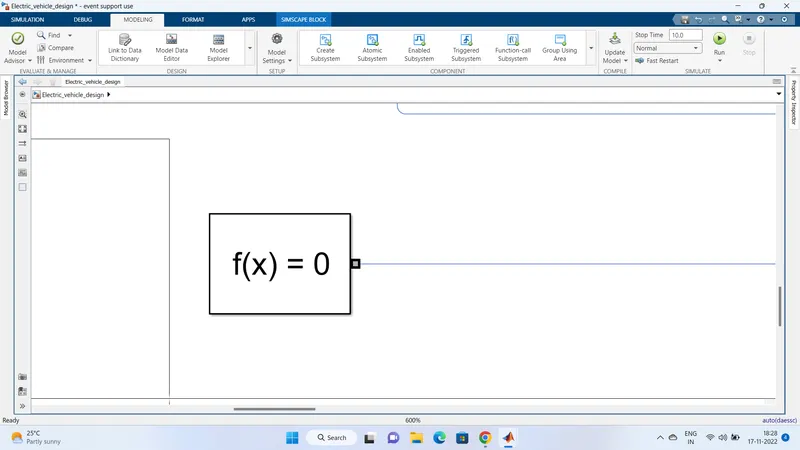
Defines solver settings to use for simulation.
15) Electrical Reference:
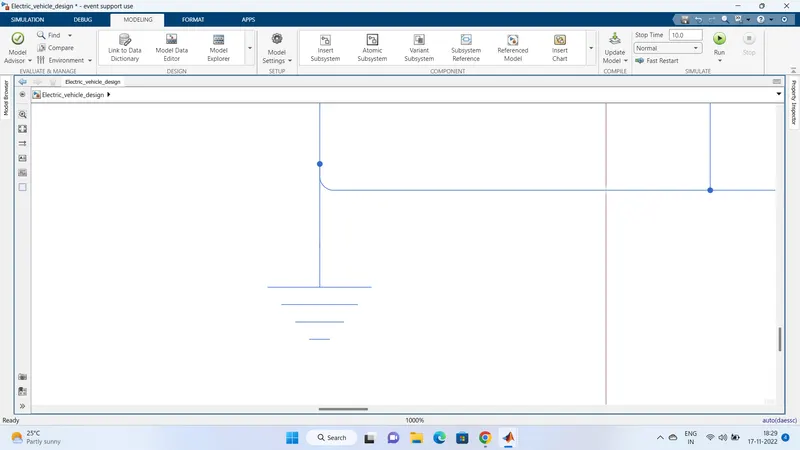
Electrical reference port. A model must contain at least one electrical reference port (electrical ground).
16)Li-ion Battery:
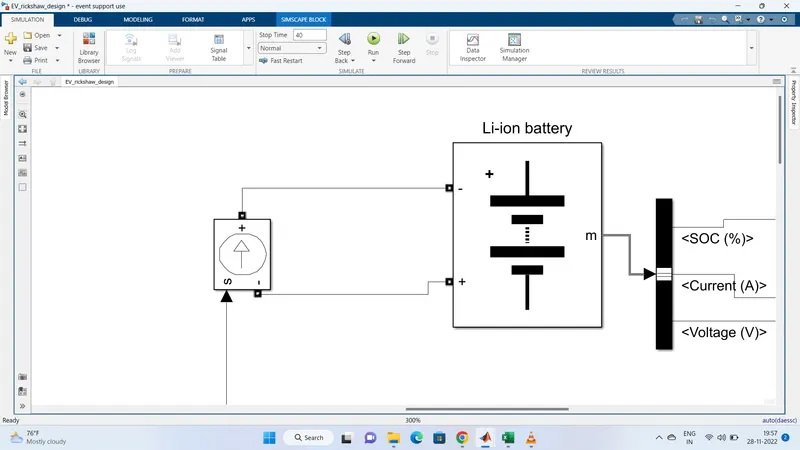
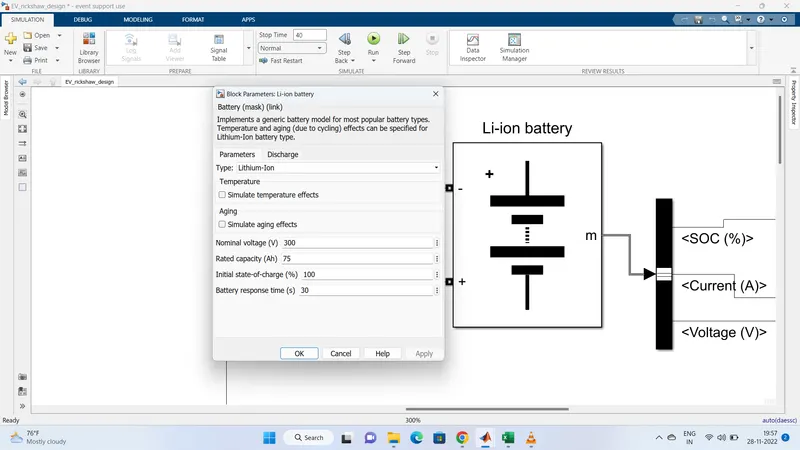
Implements a generic battery model for most popular battery types. Temperature and aging (due to cycling) effects can be specified for Lithium-Ion battery type.
17) DC Motor:
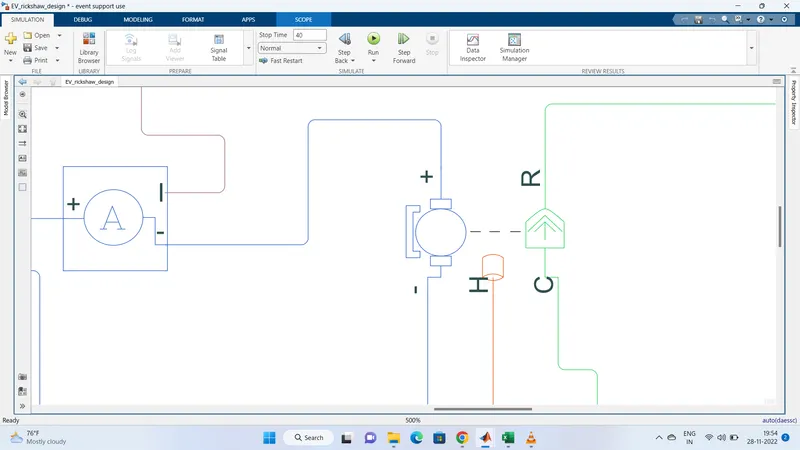
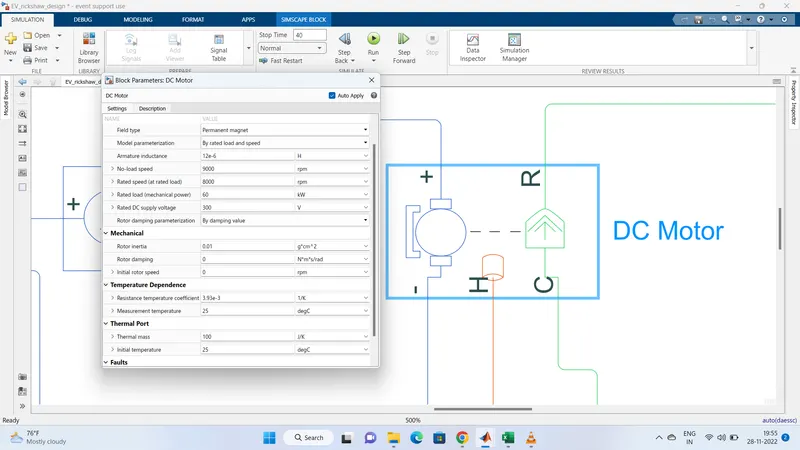
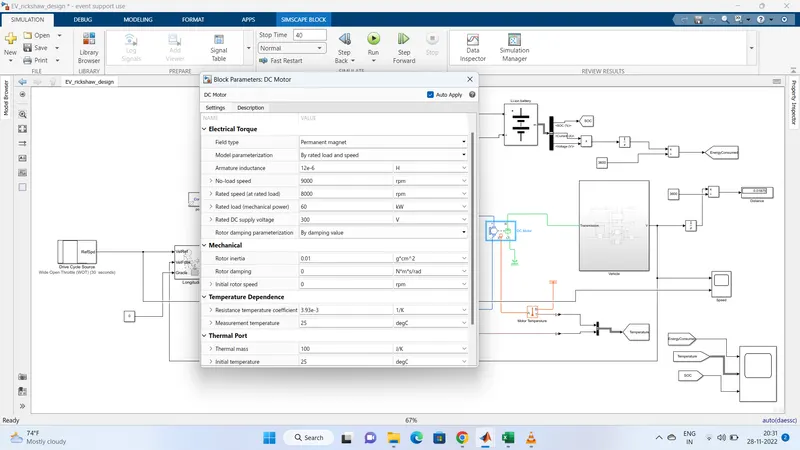
This block represents the electrical and torque characteristics of a DC motor. The block assumes that no electromagnetic energy is lost, and hence the back-emf and torque constants have the same numerical value when in SI units. Motor parameters can either be specified directly or derived from the no-load speed and stall torque. If no information is available on armature inductance, this parameter can be set to some small non-zero value. When a positive current flows from the electrical + to - ports, a positive torque acts from the mechanical C to R ports. Motor torque direction can be changed by altering the sign of the back-emf or torque constants. Here we are using a permanent magnet DC motor.
18) Mechanical Rotational reference:
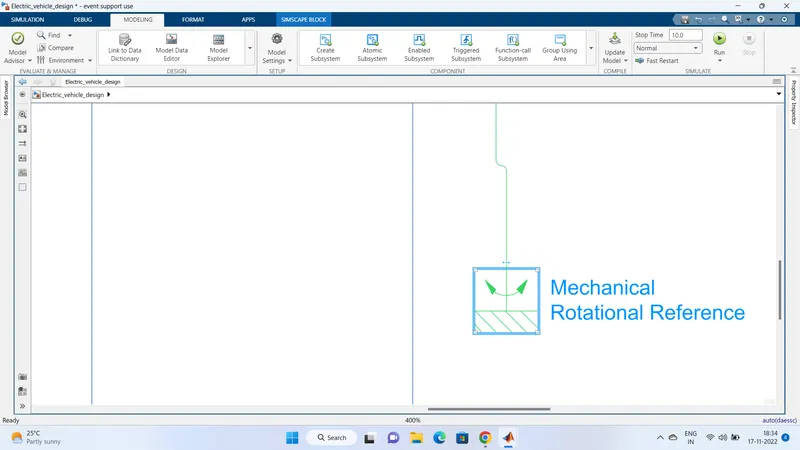
This block represents a mechanical rotational reference point, that is, a frame or a ground. Use it to connect mechanical rotational ports that are rigidly affixed to the frame (ground).
19) Scope:
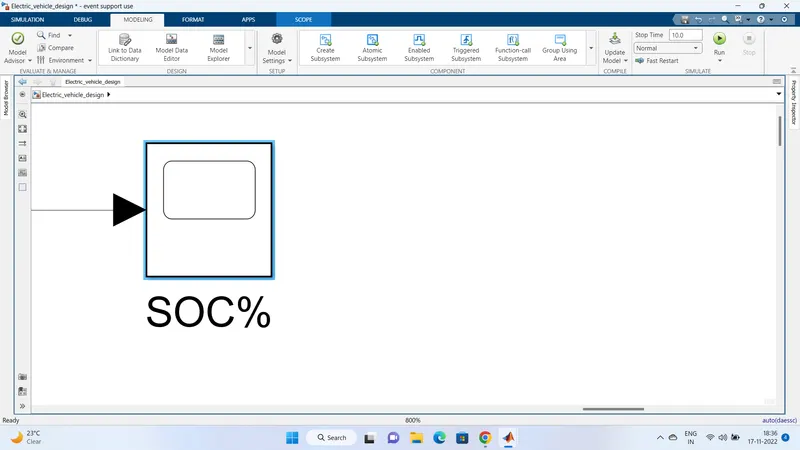
The scope is used to get the output of the system.
20) Integrator:
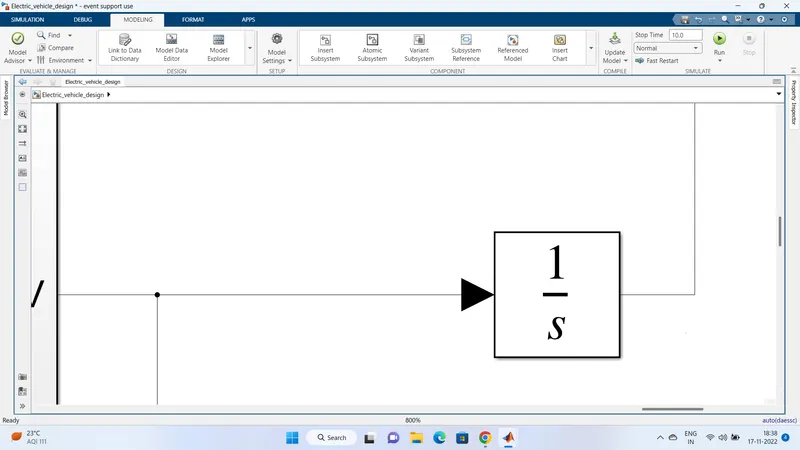
Continuous-time integration of the input signal.
21) Divide:
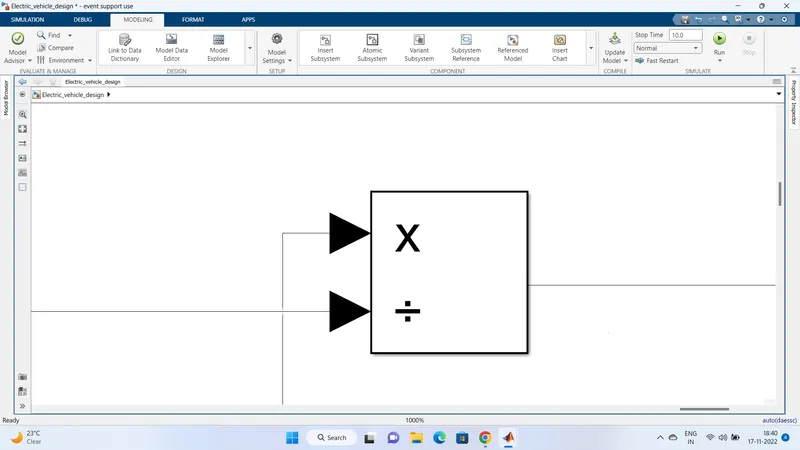
Multiply or divide inputs.
22) Display:
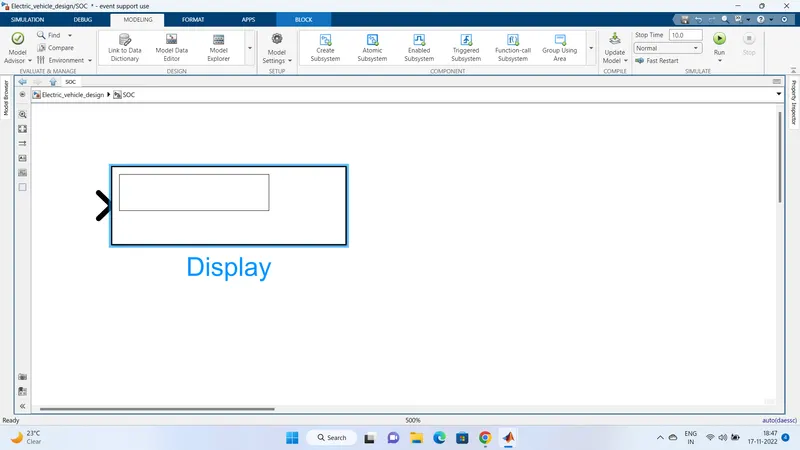
Display input or output values.
22) Controller Temperature:
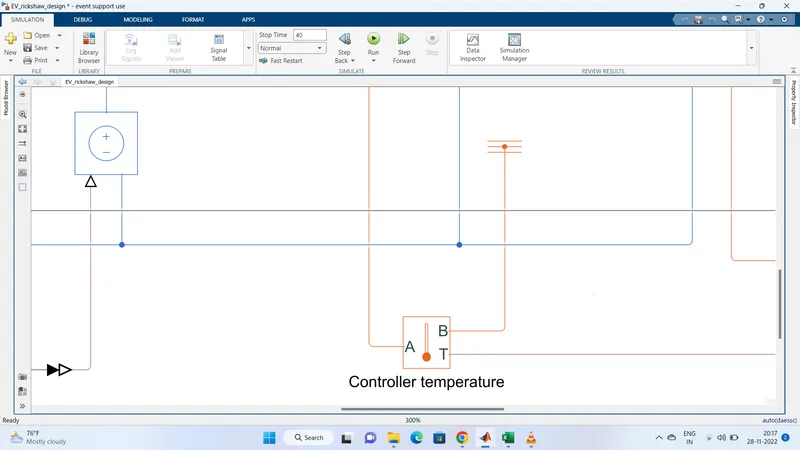
This block measures temperature in a thermal network. There is no heat flow through the sensor. The physical signal port T reports the temperature difference across the sensor. The measurement is positive when the temperature at port A is greater than the temperature at port B.
Model Construction and Explanation:
Vehicle subsystem:
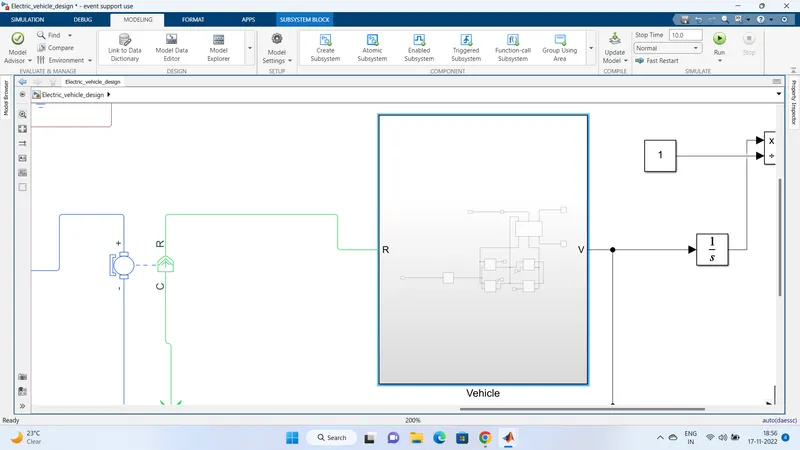
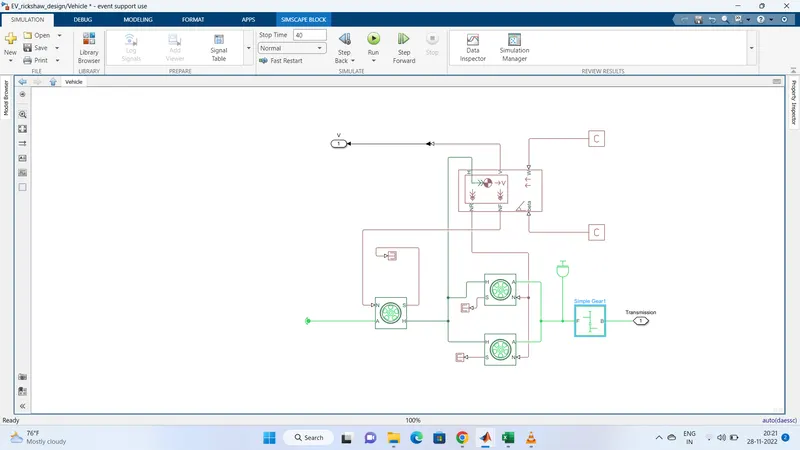
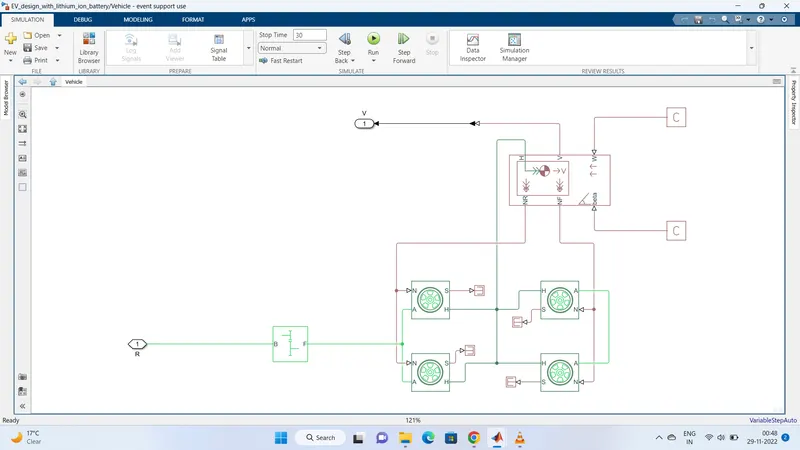
The vehicle subsystem blocks contain the tire arrangement 4 tires arranged as from wheels and rear wheels.The axle blocks are connected to the tire block next to each other to form as front axle and rear axle. Hub is also connected to hub.
A vehicle body block is present and the connections are made to the necessary connection ports of the tire.
For simplification, I had taken the simple gear.
The remaining ports are connected to constants or connection ports.
Electric Vehicle Model:
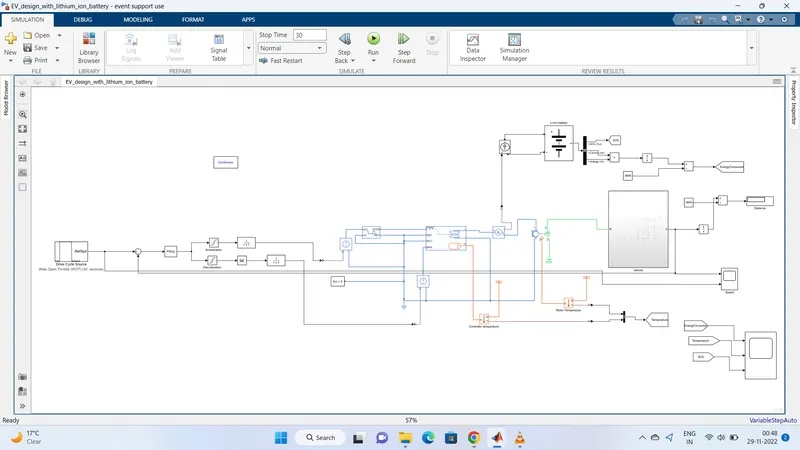
This the electric vehicle model designed and the model is also attached in slx format.
The parameters set are:
Vehicle body parameters
Tire parameters:
Controlled PWM Voltage:
DC motor parameters:
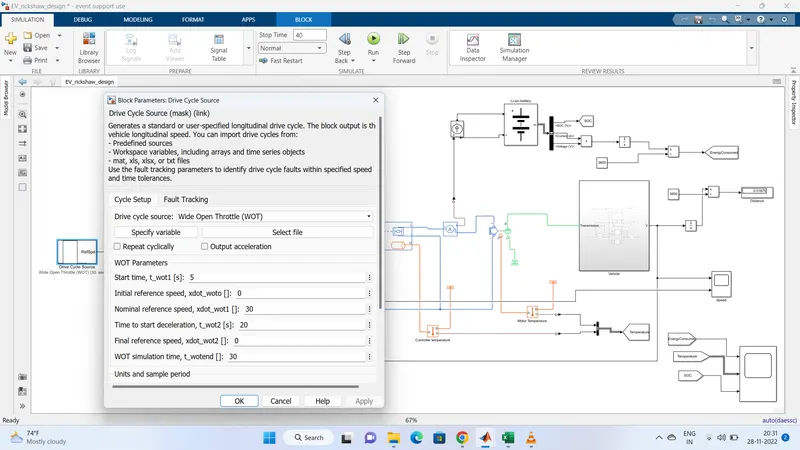
Drive cycle WOT:
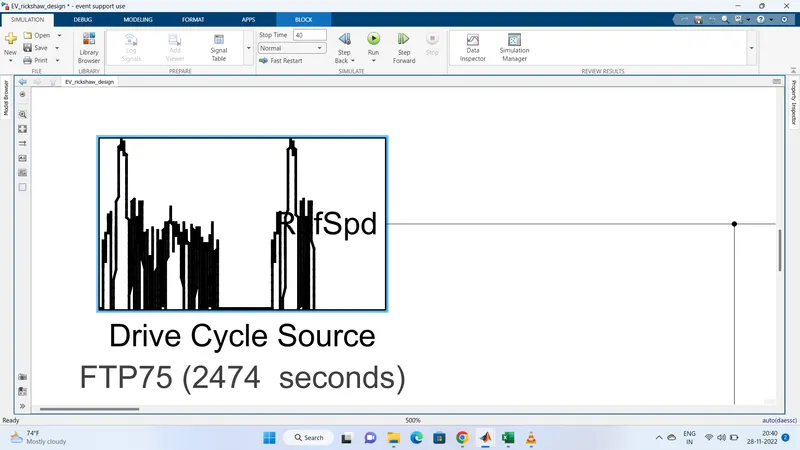
Drive Cycle FTP 75:
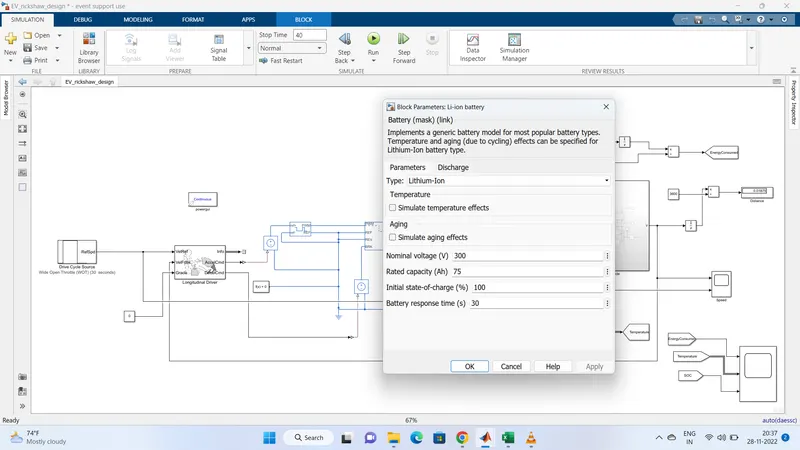
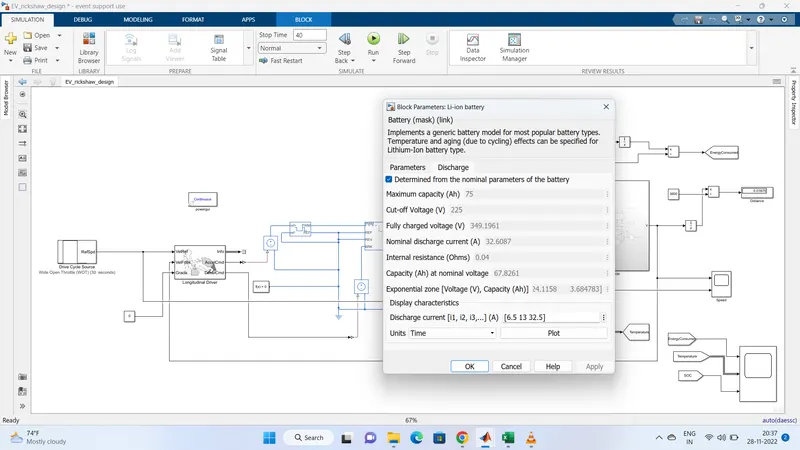
Battery parameters:
Results:
The input data are:

Without Modified Coefficients
After a simulation time of 10 seconds, the following default PID values were used:
- kp = 1
- ki=1
- kd = 0
The distance and speed plot shown below was obtained:
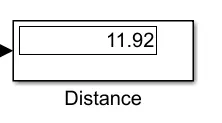
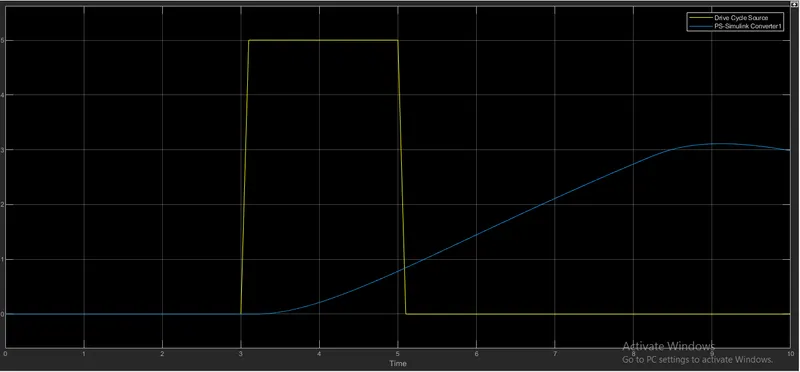
From these results, we can see that the vehicle only begins its acceleration at t = 3.4 seconds as opposed to the commanded t = 3 seconds from the drive cycle. At t = 4 seconds, the vehicle speed has increased to 0.2 m/s whereas the commanded speed from the drive cycle is 5 m/s at the same time period. By t = 5 seconds, the vehicle is meant to start its deceleration back to rest, but the vehicle is still in its acceleration phase as the speed increases to 0.8 m/s at the same time period. After t = 5 seconds, the vehicle's acceleration appears to be linear and the vehicle speed reaches its peak value of 3.1 m/s at t = 9 seconds. Immediately after, the vehicle begins deceleration and the vehicle speed drops to 3 m/s at t = 10 seconds.
For the default PID values, there appears to be a delayed response time in the actual vehicle speed. There is no overshoot and there is very minimal steady state error.
First Modification
For the same simulation time, the proportional and integral constants in the PID controller block were modified to the following:
- kp= 800
- ki = 300
- kd=0
For these parameters, the following speed-time plot was obtained:
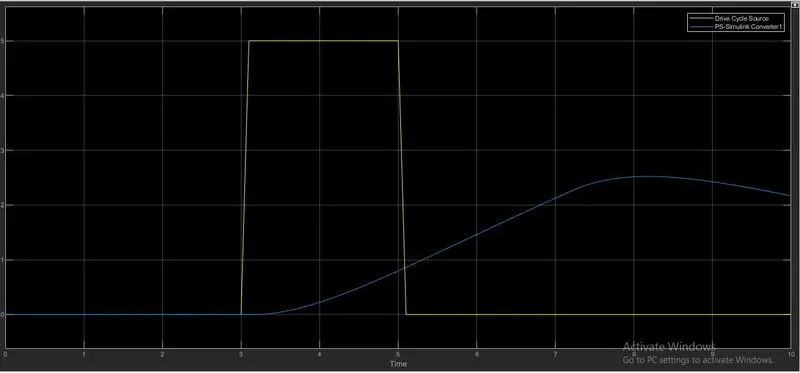
From these results, we can see the plot of the drive cycle data and the actual vehicle speed. In the actual speed of the vehicle, there is a slight delay in the acceleration of the vehicle wherein the vehicle only starts accelerating at t = 3.3 seconds instead of t = 3 seconds as seen in the drive cycle. At t = 4 seconds, the vehicle reaches 0.3 m/s which is much lower than the commanded speed of 5 m/s. By t = 5 seconds, the vehicle achieves a speed of 0.8 m/s whereas the drive cycle is still at 5 m/s and is about to begin its deceleration back to 0 m/s. The actual speed of the vehicle has a delayed response time as it is still in its acceleration stage and has not reached its peak speed value either. By t = 8 seconds, the vehicle achieves its peak speed of 2.6 m/s which is only half of the commanded peak speed. The peak speed was commanded to be maintained for 2 seconds, but the actual peak speed was not maintained and immediately begins to decrease after t = 8 seconds. At t = 9 and t = 10 seconds, the actual speed of the vehicle dropped to 2.5 m/s and 2.2 m/s respectively.
For the selected PID vales, there is a slightly quicker response time. However, compared to the default PID values, the peak speed of the vehicle was 0.5 m/s lesser in this attempt. Once again, there was no overshoot and the steady state error was minimal.
Conclusion
In conclusion, the vehicle speed was controlled to some extent with the implementation of the PID controller block. Since this was not a linearized system, the auto-tune feature in the PID controller block could not be used. Trial and error was performed in a few attempts to control the speed of the vehicle to match the drive cycle reference speed more closely. Despite being able to manually tune the PID controller, the vehicle speed was still unable to reach the desired peak speed value of 5 m/s from the drive cycle. In addition, the vehicle was also unable to sustain said peak speed value from the drive cycle for the desired time period of 2 seconds.
These shortcomings maybe due to the various reasons. For instance, the vehicle may be unable to achieve a value of 5 m/s due to the rolling resistance effect between the road surface and tires. Perhaps, the effect of wind resistance from the headwind also contributed to the vehicle being unable to reach the desired peak speed. If the auto-tune feature in the PID controller block was usable, it may have been possible for the vehicle to follow the drive cycle reference command more closely.