Project 1 - Data Handling and Interpolation
Project 1 - Data Handling and Interpolation
Project :
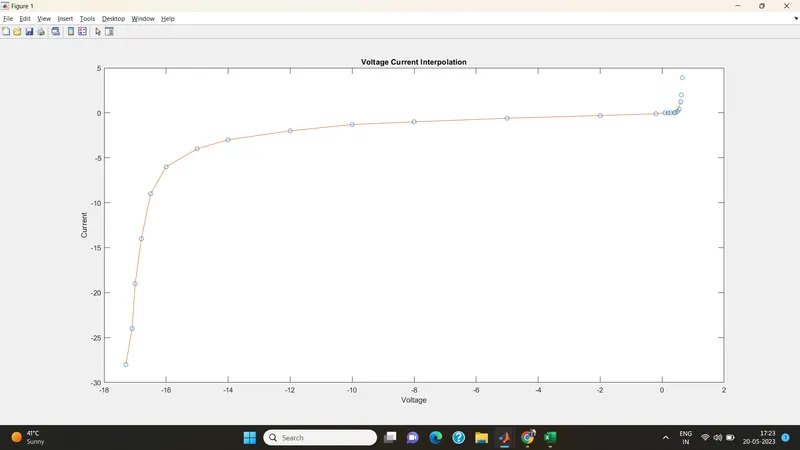
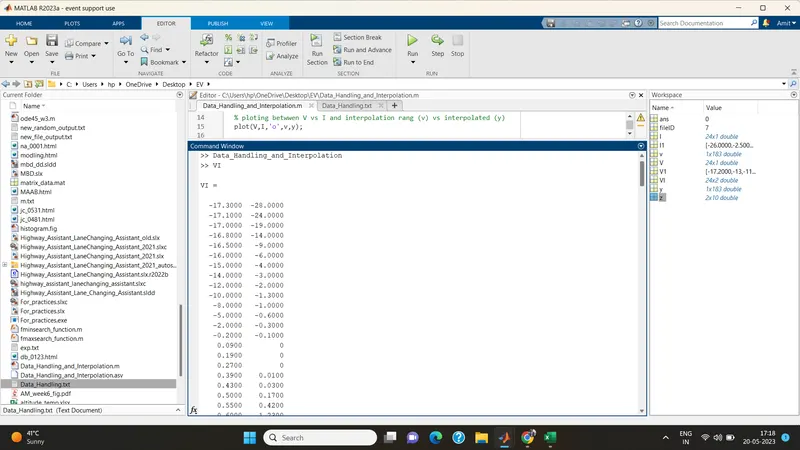
In a laboratory experiment, data of voltage and current has been recorded and the same is attached in an excel file ( Click on this link VI.xlsx ). Read the excel file in the Matlab program and perform the interpolation in the range of -17.3:0.1:0.9. Generate the interactive plot for the interpolated data and store them in a text file.
Key Highlights:
- Graphical solutions are more visual and appealing
- Interpolation of data
- Read excel file
- Write to text file
Deliverables:
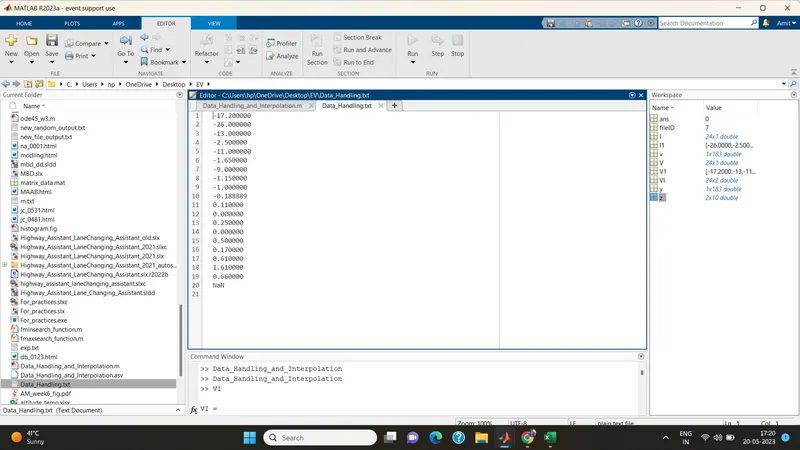
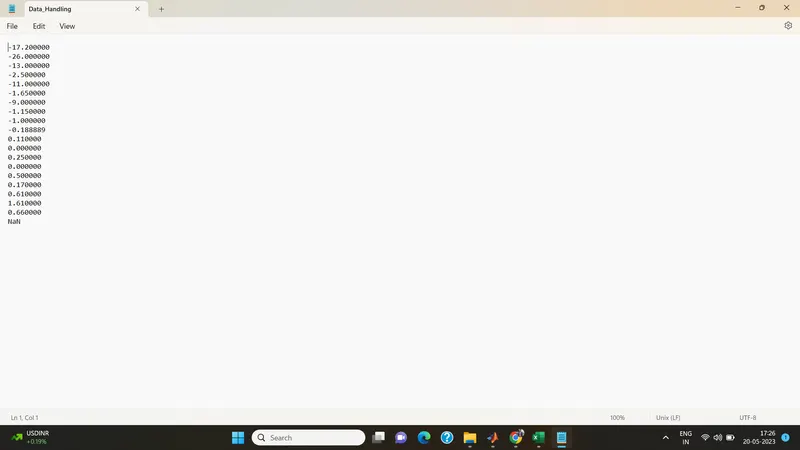
- Find missing data and save it in text
- Interpolate the data set
- Save your program and attach the same.
- Save txt file and upload in attachment
Ans.
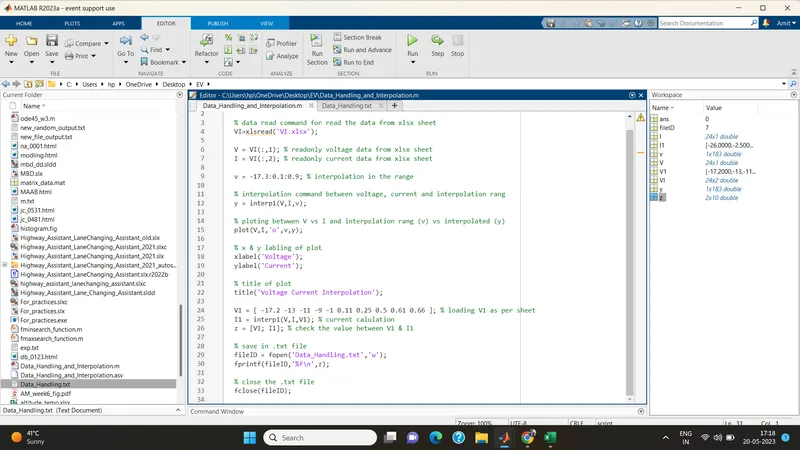
% Project 1 - Data Handling and Interpolation using m-script file
% data read command for read the data from xlsx sheet
VI=xlsread('VI.xlsx');
V = VI(:,1); % readonly voltage data from xlsx sheet
I = VI(:,2); % readonly current data from xlsx sheet
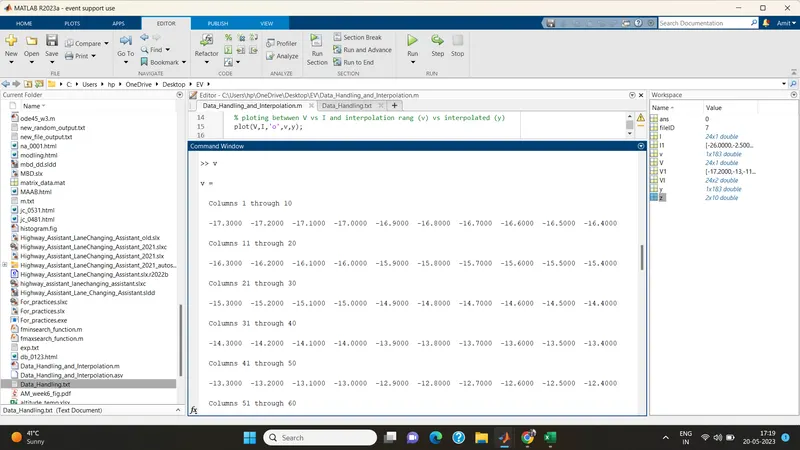
v = -17.3:0.1:0.9; % interpolation in the range
% interpolation command between voltage, current and interpolation rang
y = interp1(V,I,v);
% ploting betwwen V vs I and interpolation rang (v) vs interpolated (y)
plot(V,I,'o',v,y);
% x & y labling of plot
xlabel('Voltage');
ylabel('Current');
% title of plot
title('Voltage Current Interpolation');
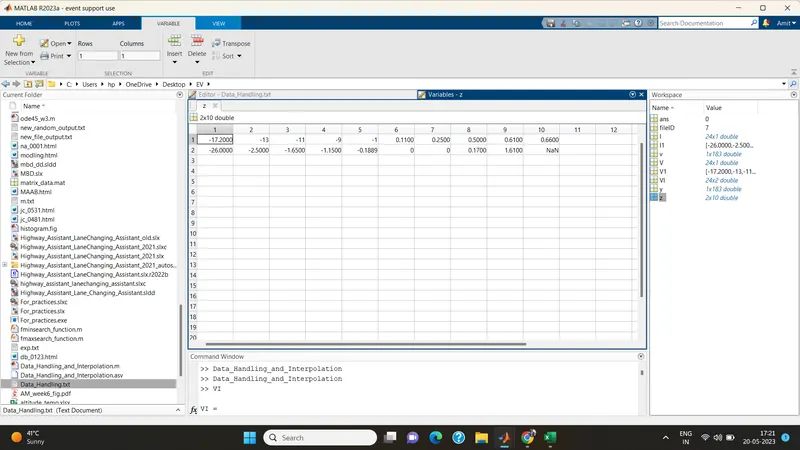
V1 = [ -17.2 -13 -11 -9 -1 0.11 0.25 0.5 0.61 0.66 ]; % loading V1 as per sheet
I1 = interp1(V,I,V1); % current calulation
z = [V1; I1]; % check the value between V1 & I1
% save in .txt file
fileID = fopen('Data_Handling.txt','w');
fprintf(fileID,'%f\n',z);
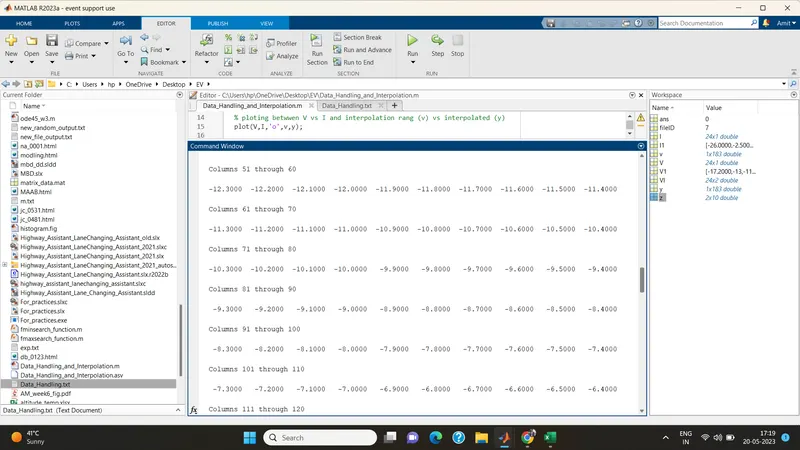
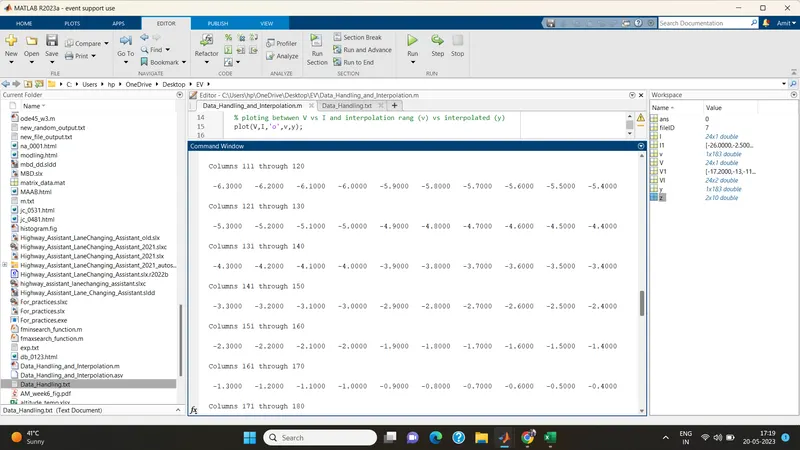
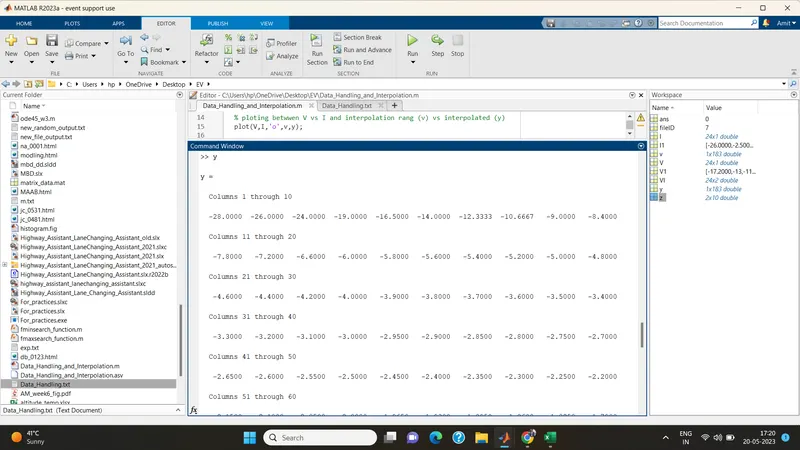
V1 vs I1
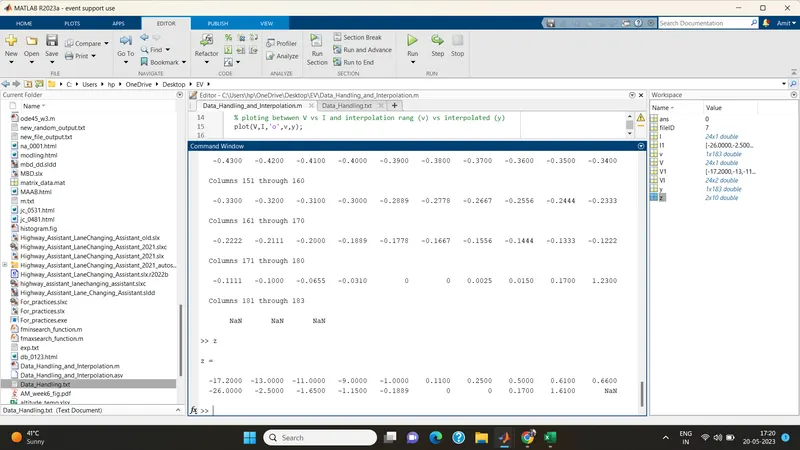
.txt file
V1 vs I1
Ploting V vs I and v vs y