Project 1 - Data Handling and Interpolation
Q.1
clc
clear all
close all
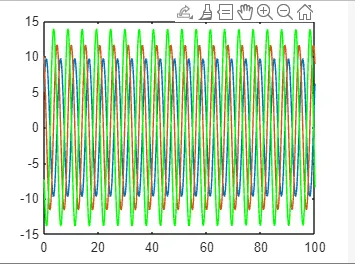
[t, x] = ode45(@func, [0,100], [5,10]); %% 5 and 10 correspond to displcement and velocity
xdot = func(t, x);
plot(t,x)
%% For acceleration
v=x(:,2)
nmax = length(t);
a = zeros(nmax,1);
a(1) = (v(2) - v(1))/(t(2)- t(1));
for n = 2 : nmax
a(n) = (v(n)- v(n-1))/((t(n) - t(n-1)));
end
hold on
plot(t,a,'g-')
function xdot=func(t, x)
k = 10;
m = 7;
xdot(1, :) = x(2, :);
xdot(2, :) = -k * x(1, :)/ m ;
end
Q.2
clc
clear all
[data1]=xlsread('mini_project_2.xlsx');
H=data1(:,1);
T=data1(:,2);
p=polyfit(H,T,3);
figure(1);
plot(H,T);hold;
xlabel('Altitude in metres');
ylabel('Temperature in degree celsius');
title('ISA plot (Altitude vs Temperature plot)');
y1=polyval(p,H);
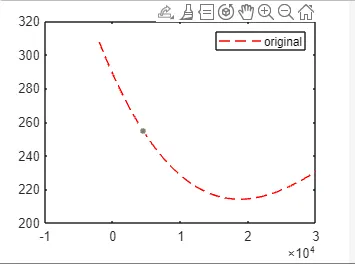
plot(H,y1,'r--');
legend('original','using polyfit');
Q.3
function y=fminsearch_fu(x)
for i=1:length(x);
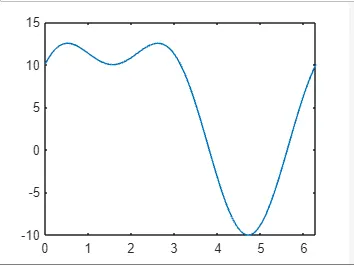
y(i)=10*sin(x(i))+10*cos(x(i))^2;
end
Q.4
x = linspace(-4*pi,4*pi);
y = linspace(0,8*pi);
[X,Y] = meshgrid(x,y);
Z = sin(X)+cos(Y)-2*(sin(X)*cos(Y));
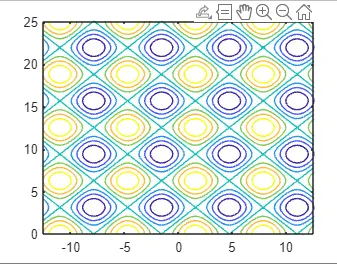
contour(X,Y,Z)